LICHSG Turning Swiftly from Bear to Bull?🧠 Market Structure & Wave Context
The chart shows a clear weekly ABC corrective pattern where price has retraced deeply into the highlighted ABC pattern completion zone (₹484–₹494).
This zone aligns with the typical Wave 4 zone of the previous impulse (Wave 3), and price is reacting within an area where earlier swings also found support.
Earlier:
A sharp rally formed the major Wave 3 high around the ₹695 region.
This was followed by profit booking and a decline into the typical retracement region of Wave 4.
The corrective structure has unfolded into A → B → C, with Wave C now approaching the marked completion area.
This behaviour reflects a healthy correction, not a trend collapse.
📚 Educational Notes (Based on Chart Labels)
ABC Pattern Completion Zone (₹484–₹494):
Weekly charts often complete deeper corrections inside such zones. Price reaching this area suggests a potential end of the corrective cycle.
Golden Zone Pullback:
Chart text shows price previously reacting from the 50%–78% Fibonacci zone, confirming the logic of retracement-based reversals.
Wave Count Change Indication:
An extended retracement in the past led to a change in wave count where Wave C turned into a new Wave 3.
This highlights why extended retracements must be read cautiously.
Typical Wave 4 Zone:
The chart notes that price is sitting at the common Wave 4 depth — 38.2% to 61.8% of the prior wave — a region where large trend moves often resume.
🎯 Predictions (Strictly Based on Chart Targets)
First Swing Target Zone: ₹698 – ₹717
Long-Term Target: ₹869
These levels are shown directly on the chart as potential upside objectives.
🛑 Stop Loss (Weekly Close Basis): ₹474
(as written on the chart itself)
📈 Risk–Reward View (Based Only on Chart Levels)
Entry Zone: ₹484–₹494
Stop Loss: ₹474
Upside Target: ₹717
Approx reward vs. risk as per chart structure:
➡ High R:R potential, since downside is limited to the SL zone and upside targets are significantly higher.
💡 Strategy (Exactly As Chart Suggests)
Buy near the ABC completion zone (₹484–₹494).
Weekly confirmation preferred before scaling — candle close stability above the zone is crucial.
Targets:
• First target → ₹698–₹717
• Long-term target → ₹869
Stop Loss:
Weekly close below ₹474 invalidates the ABC pattern and the corrective structure indicated.
⚠️ Disclaimer
Not SEBI registered.
For educational study of chart structure only — all levels are taken directly from the attached chart.
LICHSGFIN

Double bottom W pattern in LIC housing financeDouble bottom W pattern in LIC housing finance
may test its resistance zone
good for upside movement

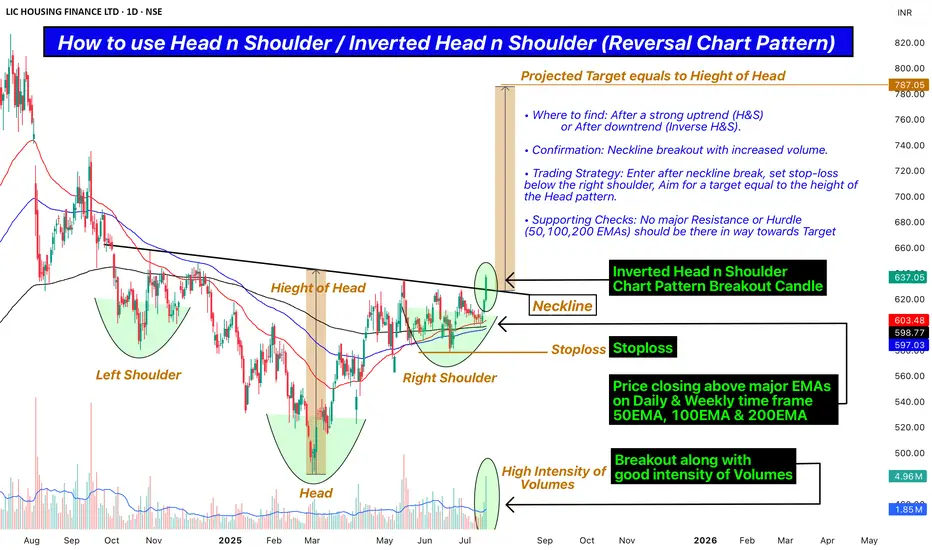
How to use Head n Shoulder / Inv. Head n Shoulder Chart Pattern.Hello Friends,
Welcome to RK_Chaarts,
Today we are going to Learn how to use Head n Shoulder / Inverted Head n Shoulder (Reversal Chart Pattern) as a Professional Trader along with real terms to check, Confirm and apply.
• Where to find: After a strong uptrend (H&S) or After downtrend (Inverse H&S).
• Confirmation: Neckline breakout with increased volume.
• Trading Strategy: Enter after neckline break, set stop-loss below the right shoulder, Aim for a target equal to the height of the Head pattern.
• Supporting Checks: No major Resistance or Hurdle (50,100,200 EMAs) should be there in way towards Target.
This post is shared purely for educational purpose & it’s Not a trading advice.
I am not Sebi registered analyst.
My studies are for educational purpose only.
Please Consult your financial advisor before trading or investing.
I am not responsible for any kinds of your profits and your losses.
Most investors treat trading as a hobby because they have a full-time job doing something else.
However, If you treat trading like a business, it will pay you like a business.
If you treat like a hobby, hobbies don't pay, they cost you...!
Hope this post is helpful to community
Thanks
RK💕
Disclaimer and Risk Warning .
The analysis and discussion provided on in.tradingview.com is intended for educational purposes only and should not be relied upon for trading decisions. RK_Chaarts is not an investment adviser and the information provided here should not be taken as professional investment advice. Before buying or selling any investments, securities, or precious metals, it is recommended that you conduct your own due diligence. RK_Chaarts does not share in your profits and will not take responsibility for any losses you may incur. So Please Consult your financial advisor before trading or investing.
LIC Housing Finance cmp 637.05 by Daily Chart viewLIC Housing Finance cmp 637.05 by Daily Chart view
- Support Zone 600 to 625 Price Band
- Resistance Zone 660 to 685 Price Band
- Rising Support Trendline seen well respected
- Volumes have spiked heavily today by demand based buying
- Breakout seemingly sustained for Double Falling Resistance Trendlines
- Support Zone acting as neckline for Multiple Bullish Technical Chart patterns
- Most common Technical Indicators BB, EMA, MACD, RSI, SAR trending positively
- Bullish Rounding Bottoms with considerate Cup & Handle and a faintly observant Head & Shoulders too

LIC Housing Finance Swing Long- LIC Housing Finance is currently trading at 723
- I can see an FVG in LIC Housing Finance that can make LIC Housing Finance retract lower
- I will be possibly looking for entries around that area
- Invalidation below the long-short ratio

LICHSGFIN - Cup and Handle -Breakout - DailyLICHSGFIN - Chart gave Cup and Handle breakout with good volume.
We can keep stop loss as low of the breakout candle which is 703.
Based on the pattern target can be 723 range with time frame 3-6 months.
Name - LICHSGFIN
Pattern - Cup and Handle breakout
Timeframe - Daily
Volume - Good
Cmp - 723
Target - 811
SL - 703
Fundamental analysis of LIC Housing Finance Ltd (LICHSGFIN):
Company Overview
LIC Housing Finance Ltd is a prominent housing finance company in India, providing loans for the purchase, construction, repair, and renovation of houses/buildings. It also offers loans to corporates for staff quarters and other lines of credit.

LIC Housing Finance-Bullish Swing NSE:LICHSGFIN
27.08.2024
Buy-Above 485 after crossing 21 EMA
Target- 775
Stop Loss-624
Risk Reward- 1:1.5
With very good uptrend from past one year, price has reached all time high
but couldn't able to break. Now again it is trying to climb the same level to break and
create new ATH.
1.Bullish engulfing against last 3 candles
2. Price rejection continuously from the parallel support level. Reject rejection is with 200 EMA
3. Continuous 3 green candles formation in weekly TF.
4.Volumes decreased in red candles during breakdown and now increased volumes found in green.
5. Rejection from 0.5 Fibonacci level again at same support level.
6. Stock bounced from over sold level and now into bullish RSI zone after crossing 40 RSI

LIC Housing Finance (LICHSGFIN) ATH BREAKOUT.Entry Range: Current price level
Targets:
Target 1: ₹961
Target 2: ₹1290
Stop Loss: ₹729
Trade Rationale:
ATH Breakout : The stock has broken out from its all-time high, indicating strong bullish momentum.
Technical Indicators : Volume
Support Levels : The stock has strong support around ₹729, making it a reasonable stop loss level.
Risk Management : Please make sure position sizing is appropriate to manage risk and follow the stop loss to protect capital.

LIChsgfinance showing reversal signsHousing finance sector is looking very positive considering the tapering effects of recession and inflation data.
PNBHsg finance has already skyrocketed post breakout.
Lichsg finance is a good fundamental stock which is looking a good positional trade. This idea is not a recommendation and is shared only for educational purposes.
You can also study stocks like aptus hsg finance, ibull hsg finance, HUDCO which are showing similar trend.

LICHSGFIN review - from 426 to 543 giving 27% gains till nowreviewing NSE:LICHSGFIN chart posted on 5th Aug 2023 when the price was 426
it made high of 543.90 giving superb 27% gains till now
more gains to come in coming months
this analysis is for knowledge sharing and educational purpose .
this post is not a buy or sell recommendation.
link of 5th Aug 2023 post given below

LICHSGFIN Ready For ATH level 🚀🚀Financial Performance:
-Total revenue from operations grew by 33% compared to the previous year.
-Net interest income increased by 83%.
-Net interest margins remained above 3% for two consecutive quarters.
Highest ever quaterly and yearly results.
Target: 1st target 570
2nd target 660
3ld target 780 ATH level.
Warning:- Please note that I'm not a financial advisor, and investing in the stock market involves risks. It's important to do thorough research or consult with a financial professional before making any investment decisions.

LIC Housing Finance- Multiyear Trendline breakout and C&H formatLIC Housing Finance- Multiyear trendline breakout and retracement done on monthly.. C&H completion done. On the verge of breakout for the target of 800. Intermediate targets/ resistance are 526, 600.

LICI Long Position Target 680Buy LICI Between 605 - 610
Stop Loss 595 SL 15 Rs
Target1 :640
Target2 :650
Target3 :655
Target4 :670
Target5 :680
Duration 2-3 Months

Long LIC HSG FIN - Target 460LIC housing finance have made Inverted head and shoulder pattern on weekly charts.
On volume breakout the stock can reach a target of 460 on weekly basis.
Short term view 3-4 weeks.

LICHSGFIN, 1D formed Shootng StarNSE:LICHSGFIN formed Shooting Star and gave closing below it.
Entry : 458.35
Target : 440
SL : 475
RR : 1.1

LICHFSGFIN INV H&S BREAKOUTLichfs Made Bullish Engulfing Candle on Daily TF with Volumes
Closed Above the Resistance Zone and Activating the Inv H& S pattern
Long Term Target is Huge

LICHSGFINLICHSGFIN:- It is going to give breakout after 1.5 years, plan something only after breakout.
Hello traders,
As always, simple and neat charts so everyone can understand and not make it too complicated.
rest details mentioned in the chart.
will be posting more such ideas like this. Until that, like share and follow :)
check my other ideas to get to know about all the successful trades based on price action.
Thanks,
Ajay.
keep learning and keep earning.

Lichsgfin 1dtf perfect Evening star pattern Lic housing finance 1Dtf forms a perfect evening star pattern at a resistance which is a sign of trend reversal.
Stock looks bearish

LICHOUSING FINLICHOUSING made double bottom pattern on DAILY tf with good volumes, although its not confirmed yet, but looking at the volume data & price action it ll eventually break past 383.60.(confirmation level)
Could be bought here or on dip till 365 or on breakout above 383.60 with mentioned stoploss & targets.

LIC HSG FIN showing Bullishness on Daily charts for 10% upmoveLIC HSG FIN is ready for 10% upmove in next 15-20 days.
LTP - 386.5
SL - 375
Targets - 425+
Timeframe - 15-20 days
Risk Reward Ratio 1:3

swing trade activated 1Dit is a swing trade for 2-3 months.
entry activated you can go long
risk reward 1:4
target and stop loss is mentioned there
follow risk management
do your own analysis
do workout
do meditation
start reading books

intradaytaking support from 1d trendline
both side potential
avoid first 15min breakout
wait for 15 min candle closing
targets are marked
if the breakout comes after 10:00 am then the probability of winning will be more.
follow risk management
do your own analysis
do workout
do meditation
start reading books

intradayboth side potential
avoid first 15min breakout
wait for 15 min candle closing
targets are marked
if the breakout comes after 10:00 am then the probability of winning will be more.
follow risk management
do your own analysis
do workout
do meditation
start reading books
