LICI: Breakout Above 800 Targeting 1200Details:
Asset: Life Insurance Corporation of India (LICI)
Breakout Level: ₹800
Potential Targets: ₹1000 (intermediate), ₹1200 (major)
Stop Loss: ₹750
Timeframe: Medium to Long Term
Rationale:
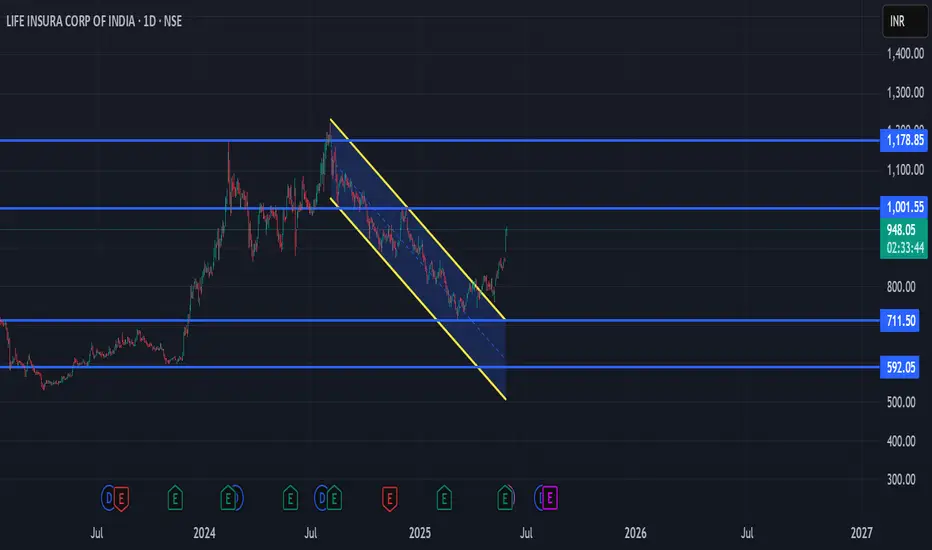
LICI has broken out of a long-term descending channel and is now sustaining above ₹800, signaling a shift in momentum. The stock is now eyeing a move towards ₹1000 with strong potential for ₹1200.
Market Analysis:
Technical Setup: Channel breakout with consistent higher lows forming.
Fundamental Backdrop: Improving investor sentiment around insurance and PSU stocks.
Volume: Above average, confirming breakout strength.
Risk Management:
Stop Loss: ₹750 to manage downside risk.
Capital Allocation: Moderate exposure recommended due to long-term setup.
Risk-Reward Ratio:
Attractive with ~50% upside potential from breakout level.
Conclusion: LICI sustaining above ₹800 is a strong technical signal. As long as it holds this level, it can target ₹1000 and possibly ₹1200 in the coming months.
Licianalysis
Technical Analysis | Powerful Price Action with Volume Breakout📈 LIFE INSURANCE CORPORATION OF INDIA (LICI) – TECHNICAL ANALYSIS
📆 Date: May 28, 2025
🔍 Timeframe: Daily
________________________________________
Price Action:
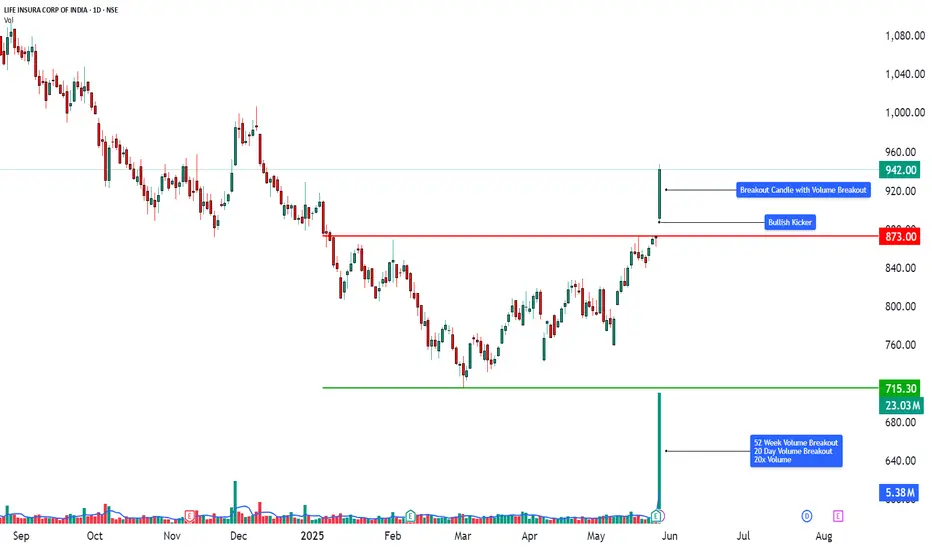
LICI surged over 8.12% in today’s session, registering a breakout after weeks of sideways consolidation. The breakout candle was wide-bodied, closing near the day’s high, and supported by a 20-day volume breakout – signaling fresh bullish momentum and accumulation at lower levels.
________________________________________
Chart Pattern / Candlestick Pattern:
• Sideways Consolidation Breakout
• Strong Bullish Candle (Buy Today, Sell Tomorrow setup)
• 52-Week Volume Breakout
• RSI Breakout
• BB Squeeze Exit – Volatility Expansion Phase
• Bollinger Band Expansion + Momentum Surge
• Multiple bullish candlestick patterns across all timeframes = multi-frame trend alignment.
• Gap-Up + Kicker + Long White Candle combo increases conviction of momentum breakout.
• Heikin Ashi continuity indicates a trend in motion without signs of reversal.
________________________________________
Technical Indicators:
• RSI (Daily): 79 – Bullish territory
• MACD: Bullish crossover active
• Stochastic: 97 – Overbought but confirms momentum
• CCI: 206 – Strong upside acceleration
• Volume: 23.03M – Very high vs. 2.24M average, confirms breakout
________________________________________
Support & Resistance Levels:
• Immediate Resistance: ₹964
• Next Resistance: ₹986
• Major Resistance: ₹1024
• Immediate Support: ₹904
• Secondary Support: ₹866
• Major Support: ₹844
• Weak Support Zone: ₹760–₹720
________________________________________
Chart Overview:
This visual representation highlights:
🔸 Clear resistance break with powerful volume
🔸 Bullish momentum confirmed by multiple indicators
🔸 20-day volume breakout indicating accumulation
🔸 Layered resistance levels between ₹964–₹1024
🔸 Tight squeeze breakout offering high R:R setups
________________________________________
Educational Breakdown:
This trade setup showcases:
• Breakout Confirmation: Price + Volume + Momentum Alignment
• Band Expansion: Beginning of volatility trend
• Momentum Shift: From sideways to bullish trend
• Volume Behavior: Institutional interest clearly visible
• Support Layering: Gives fallback levels for pullback traders
Such a chart is a perfect case study in breakout trading, especially post-consolidation and on high volume days.
________________________________________
How to Trade LICI (for learning purpose):
• Entry Example: ₹942.00
• Stop Loss: ₹844.00 (Risk: ₹98.00)
• Target 1: ₹964.00 (Reward: ₹22.00)
• Target 2: ₹986.00 (Reward: ₹44.00)
• Target 3: ₹1024.00 (Reward: ₹82.00)
• Sample Quantity: 50 shares
• RR Ratio: Short-term ~1:0.5; Swing ~1:1 or more
• Aggressive Traders: Can trail stop-loss as price approaches ₹986
• Conservative Traders: Wait for dip toward ₹904 or ₹866 zones
________________________________________
This breakout setup is ideal for swing trades, backed by strong volume and momentum indicators. However, since the RSI and Stochastic are in the overbought zone, traders should manage risk through stop-losses or wait for minor retracements for safer entries.
⚠️ Risk Management Tip: Always trade with a clearly defined stop loss. Avoid entering positions impulsively. It is advisable to start with a smaller quantity and increase your exposure only if the price action confirms the continuation of the trend. Capital protection should always be the priority.
📢 Disclaimer
This content is created purely for educational and informational purposes. It is not intended as investment advice, stock recommendations, or trading tips. Trading and investing in the stock market involves risk. Please consult with a SEBI-registered financial advisor before making any investment decisions. The author/creator is not registered with SEBI and shall not be held responsible for any losses incurred based on this information. Always do your own research and use proper risk management.
👉 If you found this analysis helpful, don’t forget to Follow, so you never miss out on a trade-worthy setup, breakout opportunity, or valuable educational insight again. Stay updated and trade smarter! 💡📈
LIC of India - Strong Bearish PossiblityStock reaching its RBD area
High possibility supply area 775 - 795
Trend line Rejection area too
Upside Sl strictly above 810
Supply zone areas in 125 as well as 75 Mins as well
Strong possibility of reversal from this area
LTF confirmation required
Downside target area near 735

LICI - Cooling OffStock coming down near its strongest support
862 - 880 (Area of strongest support)
It may go sideways before planning next direction
If cools off near 865 - 870 then a good buy opportunity with strict Sl of close below 860
Any close below 860 negates the view
Once below 860 then the same area (862-880) will start acting as strongest resistance

LICI Life Insurance Corporation of India buy trade with targetsHi! this is Kapil,
I made this graph of LICI by just using simple Fib extensions and reversals for getting to the desired target.
After seeing the closing of LICI in 2024 November month i have decided to Make this Chart.
Consult your financial advisor before investing.

LICI BRAKEOUT --- ON DAILY CHART
NSE:LICI
I am buying this stock
Near 1080
And follow sl on 980
My target will be 1280
My risk reward ratio is 1:2
Return on capital 20%
