Bitcoin's Death Cross is Here: A crash with a message to all!BITSTAMP:BTCUSD has just delivered one of its most significant reality ✔ checks of the year — the recent crash wasn’t simply a dip; it was a multi-layered market unwind that exposes the current fragility of the crypto ecosystem.
📉 Current Bitcoin Situation: “From Euphoria to Uncertainty”
Bitcoin’s trend shifted rapidly over the past few weeks.
Spot ETFs that once fueled relentless upside have significantly slowed inflows, with some days printing net outflows as retail enthusiasm cooled and institutions trimmed exposure.
Meanwhile:
Over billions in long liquidations hit in some days.
Funding flipped aggressively negative
Sentiment turned from greed → hesitation
High beta alts saw steeper collapses, showing risk-off behavior
This wasn’t random volatility — it was a controlled flush triggered by structural weakness.
🔥 Why Bitcoin Crashed: The Real Story
🔹 Technical Factors
BTC lost a major support cluster after multiple failed attempts to hold the mid-range.
Open interest was overheated, creating the perfect setup for a liquidation cascade.
Price rejected sharply from a supply zone that aligns with the weekly imbalance.
☠️ Death Cross on Daily Time Frame: Now Confirmed
The 50 SMA crossing below the 200 SMA is not a “doom event” by itself…
But historically, Bitcoin rarely ignores this signal, especially when paired with weakening momentum and fading liquidity.
⚠ The last major Death Cross?
2022’s brutal bear continuation, which led to several months of grinding downside before any meaningful reversal.
The current structure looks uncomfortably similar:
Lower highs printing consistently
Loss of trend strength
Distribution patterns on higher time frames
Declining demand from smart money inflows
This isn’t fearmongering — it’s observation.
🔹 Fundamental + Macro Factors
ETF inflow cooldown = reduced demand pressure
Miners started selling into strength to stabilize income post-difficulty adjustment
Global markets leaned risk-off due to macro tightening
Whales began distributing quietly (confirmed by on-chain inflow spikes into exchanges)
When technical fragility meets fundamental slowdown, crashes are not accidents — they’re consequences.
🐋 Whales Are Selling: “When the quiet money moves, the market reacts loud.”
On-chain data over the last week showed:
Increase in exchange inflows from large wallets
Spot distribution from old long-term holders
ETF issuers are reducing inventory during downswings
This behavior is classic:
Whales distribute during periods of retail excitement…
Retail panics during whale exits…
And the crash becomes a self-fulfilling cycle.
📅 4–6 Week Forecast: “Chop, Pain & Opportunity”
Over the next month or so, the market will likely experience:
Sideways-to-down structure
Failed rally attempts near the 50 SMA
Whip-saw price action due to low conviction
Accumulation pockets are forming quietly
BITSTAMP:BTCUSD needs to reclaim the 50 SMA with strength before a clean trend resumes.
Until then, volatility ≠ strength.
🎯 Conclusion: Re-Investment Zones & Smart Accumulation
Crashes are emotional for most, but strategic for the prepared.
This is not a call to rush.
It’s a reminder:
Smart money enters when sentiment collapses.
Dumb money enters when sentiment peaks.
Analyze. Prepare. Don’t chase.
🧩 Comment down below 👇 and let’s talk about how to overcome it — build awareness together as traders, not competitors.
If this Idea gave you valuable information, then please boost it, and follow for more practical trading!
Happy Trading & Investing!
Team @TradeWithKeshhav ⚡
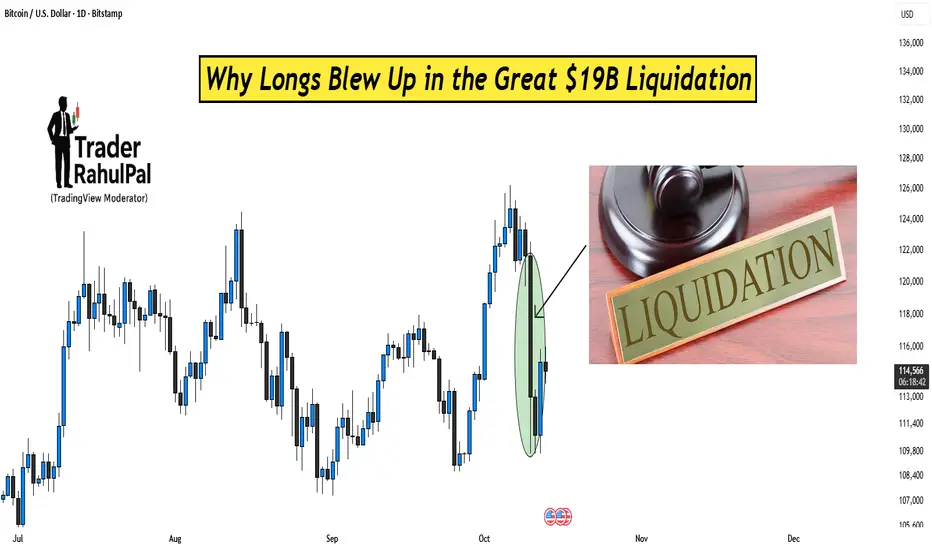
Liquidation

Why Longs Blew Up in the Great $19B Liquidation?Hello Traders!
Recently, crypto markets witnessed one of the biggest shakeouts in history, a $19 billion liquidation that wiped out long traders across Bitcoin, Ethereum, and altcoins in just a few hours.
Everyone called it a “crash,” but what really happened was a classic case of leverage, greed, and poor risk management colliding. Let’s break down the truth behind it.
1. Excessive Leverage Builds the Trap
During bullish phases, traders pile into long positions with 25x, 50x, or even 100x leverage.
The higher the leverage, the smaller the move needed to wipe you out.
Even a 1–2% drop in price can liquidate millions worth of positions instantly.
When too many traders are leveraged in the same direction, the market becomes top-heavy and unstable.
2. Liquidity Hunt – The Smart Money Move
Big players know where the retail stop losses and liquidation points sit, usually below obvious support levels.
They push price just far enough to trigger those liquidations.
Once the forced selling begins, it cascades, creating a chain reaction that accelerates the fall.
It’s not manipulation; it’s how liquidity flows work in leveraged markets.
3. The Domino Effect of Liquidations
When one big position gets liquidated, it triggers auto-sell orders.
Those sells push prices lower, causing more positions to get liquidated.
In minutes, you see billions vanish as exchanges auto-close overleveraged longs.
That’s exactly what created the $19B wipeout, a domino collapse fueled by forced exits.
4. How to Avoid Becoming the Next Victim
Use leverage only if you can handle losing that position completely.
Keep your stop loss and margin buffer wide enough to survive small swings.
Never risk more than 1–2% of your account on a single trade.
And most importantly, don’t chase FOMO entries near resistance levels.
Rahul’s Tip:
Leverage isn’t evil, greed is .
The same tool that builds accounts can destroy them if used recklessly.
In crypto, survival is the real skill, because only survivors get the next bull run.
Conclusion:
The Great $19B liquidation was not random, it was the market teaching a painful lesson about leverage and discipline.
If you want to last long in this game, learn to respect risk before chasing reward.
If this post helped you understand what really happened, like it, share your view in comments, and follow for more realistic market breakdowns!
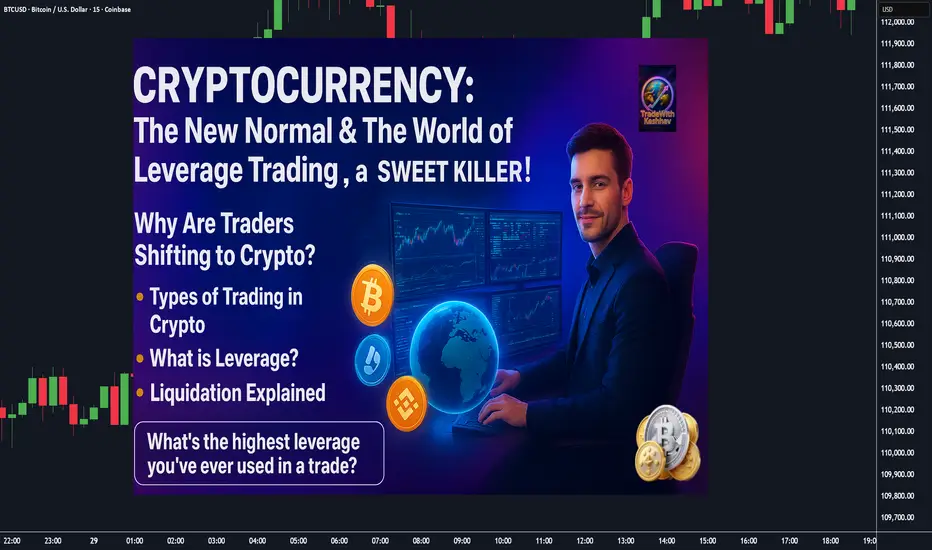
Cryptocurrency : The New Normal & The World of Leverage Trading.📌 Cryptocurrency: The New Normal & The World of Leverage Trading ⚔️ ( A Sweet Killer! )
🌍 Why Are Traders Shifting to Crypto? COINBASE:BTCUSD BITSTAMP:ETHUSD COINBASE:SOLUSD
✔️ Lower capital required compared to stocks
✔️ Fewer gaps (24/7 market = no overnight gap-up/down shockers)
✔️ High leverage opportunities (control bigger trades with smaller margin)
✔️ Global accessibility (Binance, Bybit, OKX, CoinDCX, Mudrex etc.)
📊 Types of Trading in Crypto
💠 **Spot Trading** → In India, 30% tax on capital gains ( check according to your country ).
💠 **Options & Futures** → Taxed as *Business Income* ( like F&O in stocks ). No flat 30% rule.
⚡ What is Leverage?
👉 Leverage means using *small capital* to control a *large trade size* , because the exchange lends you money.
Think of it like **margin trading** in stocks — but much more aggressive.
🔹 Example 1 : Normal Trade style ( No Leverage )
suppose you have 💰 Capital = ₹10,000
Bought BTC at Price = ₹10,000,000
* You can buy 0.001 BTC ( 10000 ➗ 10,000,000 ).
* If BTC rises 10% → Profit = ₹1,000 (+10%)
* If BTC falls 10% → Loss = ₹1,000 (-10%)
👉 Risk & reward move in proportion to your capital.
🔹 Example 2 : Leverage Trade style ( 10x Leverage )
suppose you have 💰 Capital = ₹10,000
opted Leverage = 10x
New Trade Size ( margin ) = ₹1,00,000 ( you can now utilize this margin amount for trading )
* You can buy 0.01 BTC ( 10000 ➗ 10,000,000 ).
* If BTC rises 10% → Profit = ₹10,000 (+100% return)
* If BTC falls 10% → Loss = FULL ₹10,000 ( Liquidation 🚨 )
👉 A 10% move = your account will be blown.
🔹 Example 3:
suppose you have 💰 Capital = ₹10,000
opted Leverage = 50x (Extreme ⚠️)
New Trade Size ( margin ) = ₹5,00,000 ( you can now utilize this margin amount for trading )
* You can buy 0.05 BTC ( 50000 ➗ 10,000,000 ).
* If BTC rises just 2% → Profit = ₹10,000 (+100% return)
* If BTC falls just 2% → FULL ₹10,000 loss ( Liquidation 🚨 )
* If BTC rises just 10% → Profit = ₹50,000 (+500% return)
* If BTC falls just 10% → FULL ₹10,000 loss ( Liquidation 🚨 )
👉 Tiny moves in high volatile asset class = jackpot or wipeout/blown.
⚔️ Key Takeaways :
1️⃣ Leverage multiplies profits 💸 but also multiplies losses too💀 ( a sweet killer! )
2️⃣ Crypto is *highly volatile* (10–20% daily moves are common) → High leverage is extremely risky, if not managed well.
3️⃣ Beginners should **never use more than 2x–3x leverage**
👉 In simple words: **Leverage is a double-edged sword ⚔️**
Used wisely → You’re a king 👑
Used recklessly → You’re broke 🥀
🚘 Liquidation Explained ( ex: Car Analogy )
Imagine you pay ₹10,000 to rent a car worth ₹1,00,000. (That’s 10x leverage).
* The car is in your hands, but ₹90,000 still belongs to the owner of car (exchange).
* If the damage goes beyond your ₹10,000 margin → the owner takes back the car immediately.
👉 That’s liquidation: when your loss = your margin.
🔹 Case 1: Normal Trade style ( No Leverage )
Margin = ₹10,000 → Buy BTC.
If BTC drops 10% → Loss = ₹1,000.
You still have ₹9,000 left.
✅ No liquidation. Just a normal loss.
🔹 Case 2: 10x Leverage Trade style
Margin = ₹10,000
New Trade Size ( margin ) = ₹1,00,000
* BTC rises 10% → Profit = ₹10,000 (+100%)
* BTC falls 10% → Margin wiped = Liquidation 🚨
🔹 Case 3: 20x Leverage Trade style
Margin = ₹10,000
New Trade Size = ₹2,00,000 ( margin )
* BTC rises 5% → Profit = ₹10,000 (+100% return)
* BTC falls 5% → Margin wiped = Liquidation 🚨
👉 Just 5% against you = Account gone.
🔹 Case 4: 50x Leverage Trade style (High-Risk Zone ⚠️)
Margin = ₹10,000
New Trade Size = ₹5,00,000 ( margin )
* BTC rises 2% → Profit = ₹10,000 (+100% return)
* BTC falls 2% → FULL ₹10,000 loss = Liquidation 🚨
👉 Just 2% against you = Blown account = Game over.
🎯 Final Word
Leverage = Power ⚡
But in crypto’s volatile world, it’s also a **trap for the impatient**.
* Smart traders use small leverage.
* Impulsive traders burn out with high leverage.
💬 Question for you: What’s the **highest leverage** you’ve ever used in a trade? Drop it below 👇 (Be honest—we’ve all been tempted!)
If this Idea gave you a value information then please, Boost it, share your thoughts in comments, and follow for more practical trading!
Happy Trading & Investing!
@TradeWithKeshhav and team
Time and Price When price liquidating (sweeps) previous day high (same day high/ Asian high ) , and price came to liquidating the high at perfect time London open time 2 ,after collecting Buy side order (buys side liquidity ) prices will tries to push downwards . since , our htf view is bullish this one is low probable set up .. but still a Valid One
In 5 mint time frame , after liquidating pdh. we can see a clear 5 mint engulfing candle .. and price creates a inducement to sweep . we can either enter on the 5 mint candle or after price swp the inducement candle .. while placing SL right above the high and target a nearby imbalance (FVG) or previous day low .

Weekly BTC-USD(26th July)BTC started the week of July 19th to 25th with the bearish movement, falling to the low of $29,300 on July 0th, however, a strong pullback rally followed and helped BTC to close the week in the green territory and formed a big bullish engulfing candle to close the week with 11% gain at $35,428. At the time of writing, BTC is trading slightly above $38,200.
This strong upward rally is most likely triggered by the massive short liquidation streak, in fact, it spiked to about $48K on Binance futures as over $100 Million of short positions were wiped off. However, BTC is still trading in its horizontal channel and it has to sustain above $41K that will act as a confirmation of trend reversal. Even after this 17% gain, the major trend of BTC is still bearish.
BTC is currently above 0.786 Fibonacci retracement level which is placed around $35K and also its 50-DEMA is also present in this range, therefore, the range of $34.5k to $35k will act as the nearest support level followed by the next support at $32.5K and $30K.
On the higher side, BTC is facing selling pressure from the upper band of the channel which is placed at $39.7K to $41K, also, its 100-DEMA which is placed at $38.6K is also acting as an immediate resistance, once we get a decisive breakout from this range and BTC starts sustaining above $41K, this will act as a confirmation to go long for the next wave.
On the plus side, Daily RSI has given a fresh breakout from its trendline resistance which it was respecting from past January 2021. Weekly MACD is also suggesting a trend reversal as it is trying to enter the positive territory. This depicts that the trend reversal can be expected in the coming days but a confirmation would be required to conclusively suggest that trend has reversed.
