GOLD LIKELY TO RETRACE INTO DEMAND BEFORE EXTENDING HIGHER📅 November 10, 2025 | XAUUSD Daily Trading Plan 💰
🧭 Market Structure Overview
Gold continues to trade within a bullish structure, confirmed by multiple Breaks of Structure (BOS) and a Change of Character (CHoCH) on the 30M timeframe.
The market recently printed a Weak High at 4070, indicating that liquidity remains above and buyers are still in control.
After a strong impulsive leg to the upside, price is expected to retrace into the nearest demand zones before resuming the bullish leg. The unmitigated order blocks around 4001–3999 and 3969–3967 present high-probability re-entry areas.
📊 Technical Breakdown
Structure: Bullish
Liquidity: Equal highs at 4070 likely to be swept before deeper retracement.
Zones of Interest:
Demand #1 → 4001–3999
Demand #2 → 3969–3967
Fair Value Gap: Between 4005–3990 offers potential rebalancing area.
🎯 Trading Plan (LONG Bias)
Entry Zone 1: 4001 – 3999
Entry Zone 2: 3969 – 3967
Take Profit (TP): 4078
Stop Loss (SL): 3994 (6$ risk)
Bias: ✅ LONG
🧩 Rationale
The recent bullish impulse following the CHoCH confirms a structural shift to the upside.
With liquidity resting above the Weak High, we anticipate a short-term retracement to fill imbalance and tap into discount demand zones.
From these zones, bullish continuation towards 4078 remains the most probable scenario — unless price breaks below 3965, which would invalidate the setup.
📌 Summary
Price remains bullish with strong momentum.
Wait for retracement into the identified demand zones for a high-probability long continuation setup.
Liquiditysweep

EUR/JPY Sell Momentum BuildsEUR/JPY has officially transitioned into a sell-side trend following clear exhaustion of its previous bullish cycle. The market structure shows consecutive lower highs and strong downside displacement, confirming that sellers are now in control of short-term momentum.
Recent liquidity sweeps above prior highs were quickly rejected, signaling institutional distribution and profit-taking. Order flow dynamics continue to favor the downside, with bearish impulses showing higher efficiency than any corrective rebounds.
Momentum and sentiment both align with sustained selling pressure. The pair is operating within a redistribution phase, and the market tone remains defensive as participants seek lower value zones.
Overall outlook: Bearish bias remains dominant. The market is expected to extend lower while maintaining controlled volatility until meaningful demand re-enters the market.

GOLD RETRACEMENT BEFORE NEXT LEG DOWN GOLD RETRACEMENT BEFORE NEXT LEG DOWN
Body: 🧭 DAILY TRADING PLAN – GOLD (XAU/USD)
Date: Oct 27, 2025
Main timeframe: M30 – H1
Strategy: SMC + Fibo Zone Reaction + OB/Trendline Confluence
1️⃣ MARKET CONTEXT
Price is consolidating after a sharp drop from 4186 → 4058.
Currently, price is trading inside a support trendline + OB BUY ZONE (4058 - 4061), showing signs of demand reaction.
Above, multiple supply zones are stacked (4093 - 4095 / 4114 - 4116 / 4135 - 4137), creating strong short-term resistance layers.
Structure remains bearish, but a corrective leg toward premium zones is likely before any continuation down.
2️⃣ BIAS
Short-term bullish retracement, then sell continuation from premium supply zones.
3️⃣ SCENARIO 1 — BUY SETUP (Short-term retracement)
Entry: 4061 – 4059
SL: 4055
TP1: 4093
TP2: 4114
RR: ≈ 1:4
Note: Only buy if price forms bullish BOS / engulf on M15 from this OB zone (confluence with Fibo 0.786).
4️⃣ SCENARIO 2 — SELL SETUP (Main setup)
Option 1:
Entry: 4093 – 4095
SL: 4100
TP1: 4061
TP2: 4002
RR: ≈ 1:5
Option 2:
Entry: 4114 – 4116
SL: 4120
TP1: 4061
TP2: 4002
RR: ≈ 1:5
If price reaches 4135 – 4137, this is an extreme premium zone (reactive Fibo + previous double top). Expect strong reaction and liquidity sweep before a larger sell-off.
5️⃣ KEY LEVELS
OB BUY ZONE: 4058 – 4061
SELL ZONE 1: 4093 – 4095
SELL ZONE 2: 4114 – 4116
SELL ZONE 3: 4135 – 4137
Liquidity Target: 4002 – 3930
6️⃣ SUMMARY
Wait for reaction at 4058 zone for short-term buy retracement.
Main idea: Sell from premium → Target liquidity below 4000.

BTC → Correction phase before bullish expansionBTC/USD Report-Based Analysis
Bitcoin is currently in a corrective phase following a structured upward delivery. After showing strength early in the cycle, the market transitioned into a redistribution and consolidation zone, allowing liquidity to rebalance across both sides. This shift suggests that price is undergoing a short-term reaccumulation before the next impulsive move. The recent break of structure (BOS) indicates a temporary bearish delivery, designed to sweep liquidity below prior demand zones. Smart money appears to be collecting positions in discounted price areas, absorbing sell-side liquidity as volatility expands. The clean liquidity pockets under 116,000–114,000 levels highlight potential mitigation zones where larger participants may seek re-entry. The overall structure remains bullish on the higher timeframe. Once the current correction finalizes and liquidity is efficiently collected, BTC may resume its upward expansion, targeting premium zones near 125,000 and above. Momentum confirmation from volume and market flow will be essential for validating this transition back into a bullish delivery phase. In short, BTC is in a controlled correction, aiming to refine liquidity before reinitiating its bullish macro delivery cycle.

Smart Money Play: Watching HDFC Bank’s Bullish ZoneTrading Idea: HDFC Bank (NSE: HDFCBANK)
Price is currently trading around ₹976 after a recent pullback.
Key Observations:
Break of Structure (BOS) confirms bullish market structure.
Liquidity sweep around recent highs.
Daily Fair Value Gap (FVG) spotted between ₹910–₹930.
Bullish Order Block at ₹800–₹830 acting as strong higher timeframe support.
Plan:
Expecting a retracement into the Daily FVG zone (₹910–₹930).
If price reacts bullishly here, potential upside rally towards ₹1,040+.
Confirmation: Look for bullish reversal candles or demand zone rejections inside FVG.
Risk Management:
Aggressive entry: near FVG zone (₹910–₹930).
Conservative entry: only after bullish confirmation.
Stop-loss: below ₹890.
Targets: First TP at ₹990, extended TP at ₹1,040.
Bias: Bullish (after retracement).
Disclaimer: This is not financial advice. For educational purposes only. Please do your own research or consult with a financial advisor before making any investment decisions.

MANORAMA Industries : Momentum pick#MANORAMA #momentumtrade #swingtrade #lowriskhighreward
MANORAMA : Momentum Trade
>> Liquidity sweep visible
>> Low Risk High Reward Trade
>> Volumes dried up
>> Stock showing strength
Swing Traders can lock profit at 10% and keep Trailing
Please Boost, comment and follow us for more Learnings
Disc : Charts shared are for learning purpose only, not a Trade recommendation. Do your own research and consult your financial advisor before taking any position.

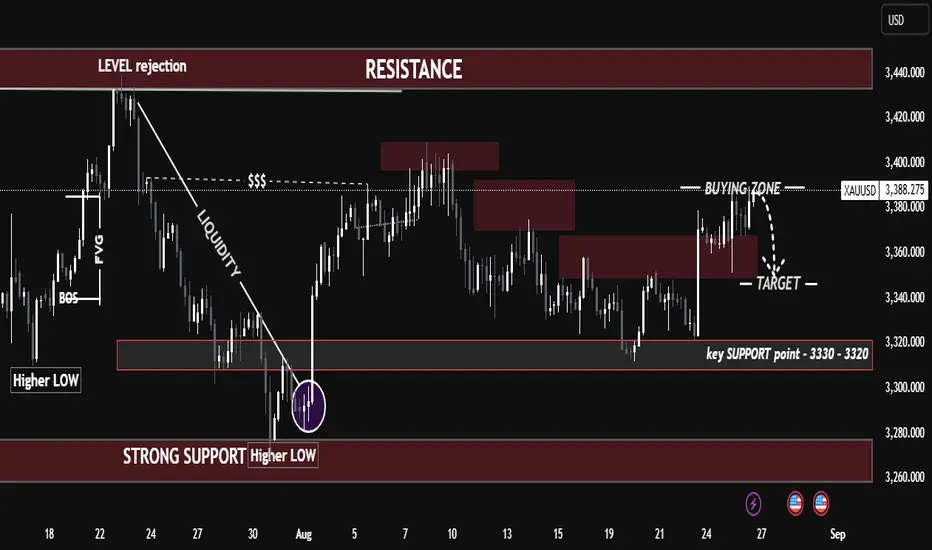
"Gold Setup: Buying Zone Rejection or Breakout Ahead?""Gold Setup: Buying Zone Rejection or Breakout Ahead?"
Gold is currently trading inside a buying zone (3380 – 3400) but facing rejection. Market structure is still holding higher lows, which keeps the bigger trend bullish, but short-term price action suggests a possible retracement move.
Resistance Zone: 3420 – 3440 (strong supply, previous rejection)
Key Support: 3330 – 3320 (major demand, higher low base)
Immediate Target: 3340 – 3360 (if rejection continues)
📉 Short-term bias: bearish correction toward 3340 – 3360
📈 Swing bias: bullish as long as 3330 – 3320 holds
🔑 My View:
I’ll be watching how price reacts around 3330 – 3320. Holding this level could trigger the next bullish leg toward 3420 – 3440. Losing it opens the door for deeper downside into 3280.
Gold Plan 22/08 – Captain Vincent ( IN )Background
On the H1 timeframe , Gold continues to move sideways within the 3328 – 3350 range, sweeping liquidity again and again, making it difficult for retail traders to spot a clear trend.
Currently, Gold has absorbed almost all liquidity from the Nonfarm FVG .
Therefore, the next price action will largely depend on smart money moves and upcoming news catalysts .
Even though the overall trend is still unclear, we can still build trading setups around these key levels .
🪙 Key Levels
🔹 Storm Breaker 🌊 (Sell Zone 3368 – 3370)
SL: 3376
TP: 3365 → 3360 → 3355 → 3350 → 33xx
🔹 Golden Harbor 🏝️ (Buy Zone 3313 – 3315)
SL: 3305
TP: 3320 → 3325 → 3330 → 33xx
📌 Trading Outlook
On higher timeframes, sellers still hold the advantage .
However, Gold may need to test resistance zones again to confirm.
If price reaches Storm Breaker 🌊 → Watch for reaction and prepare to Sell.
If price drops to Golden Harbor 🏝️ → Strong support remains for short-term Buy opportunities.
⚓ Captain Vincent’s Note
"When the sharks sweep the waves, retail traders panic. But those holding the key level map will always know where the safe harbor lies."

Liquidity Sweep Complete – Bullish Continuation Ahead?GOLD ANALYSIS 31/07: Liquidity Sweep Complete – Bullish Continuation Ahead?
🔍 Technical View | XAUUSD | 2H Chart | End of Month Setup
Gold has completed a final liquidity sweep around the 3269–3271 zone and has since rebounded strongly, in line with the prevailing bullish structure. The sharp drop yesterday during the FOMC rate statement appears to have served its purpose: grabbing final sell-side liquidity before preparing for the next bullish leg.
As of now, price is reacting at the 3295 zone, which coincides with the M30 CP (Change of Character) Zone, showing minor intraday retracement. A healthy pullback is likely before a potential bullish breakout of the descending trendline that has been holding price down over recent sessions.
🔵 BUY Strategy: Trend Continuation Setup
We’re watching for potential re-entries on a dip toward the OBS Buy Zone (3286–3284), created after the recent bullish move. This could be the last opportunity to catch the next impulsive leg higher.
Buy Zone: 3286–3284
Stop Loss: 3278
Targets: 3290 → 3294 → 3298 → 3304 → 3308 → 3312 → 3316 → 3320 → 3330 → ???
Key breakout confirmation will come if price closes strongly above 3313 (first key resistance). If broken, this opens the door toward the VPOC zone at 3328–3330, where a high-volume cluster awaits.
🔴 SELL Strategy: Short-Term Rejection Levels
Shorts only become favorable below the VPOC Sell Zone (3328–3330). If price closes above this area, bearish pressure is likely to fade, and bulls will dominate the next leg.
Sell Zone: 3328–3330
Stop Loss: 3335
Targets: 3324 → 3320 → 3315 → 3310 → 3305 → 3300
⚠️ Important: Selling inside a bullish breakout structure is high-risk unless the market gives clear rejection at major supply. Always wait for price action confirmation.
🕯️ Monthly Candle Insight (July Close)
Today marks the final trading day of July. Notably, the last two monthly candles have closed as Doji with long wicks, reflecting deep indecision and ongoing liquidity grabs. This aligns with the upcoming interest rate cut discussions at the next FOMC, which could ignite significant volatility.
📌 Summary:
Liquidity sweep at 3269–3271 is likely complete.
Price now retracing after strong bullish rebound from OBS Buy Zone.
Watch for confirmation above 3313, then 3328–3330 for breakout toward higher zones (335x–337x).
End-of-month close + macro narrative (FOMC) will be crucial to confirm direction.
💡 Pro Tip: Avoid entering late into reactive moves. Wait for retests of clean liquidity zones and use volume-based confluences to validate bias.
📲 Follow us @MMFlowTrading for real-time updates, macro analysis, and market structure insights on gold & major pairs.

Gold’s Next Move After False Headlines & Liquidity sweepXAUUSD 17/07 – MMF Insights: Gold’s Next Move After False Headlines & Liquidity Sweep
🧭 Market Sentiment: Macro Distractions Fuel Uncertainty
The gold market remains under pressure as conflicting geopolitical news and central bank rumors stir volatility. The week opened with rumors that Donald Trump might fire Fed Chair Jerome Powell, sending temporary fear across markets. While Trump later denied the claim, the damage was already done – sentiment remains fragile.
Other active drivers:
Israel’s airstrikes in Syria increase global tension.
EU proposes tariffs on US imports, adding trade friction.
BlackRock warns of delayed inflation pressure as tariffs begin impacting electronics & consumer goods.
💡 All these elements support gold’s potential role as a hedge, but technical signals suggest the market remains undecided.
🔍 MMF Technical Flow Outlook
According to MMF analysis, price structure is unfolding in line with expected liquidity sweeps and order block reactions:
Price rejected from key supply zones near 3,342 – 3,344 (OB + CP structure).
Current bounce around 3,330 – 3,320 signals possible accumulation.
If buyers hold above 3,310, we may see price test the upper OB/VPOC zones again.
Break below 3,310 opens the door toward the MMF liquidity trap zone at 3,296 – 3,294.
🎯 Trade Plan – Precision Entries
🟩 Buy Zone
Entry: 3,312 – 3,310
Stop Loss: 3,306
Take Profits:
→ 3,316 → 3,320 → 3,324 → 3,328 → 3,335 → 3,340 → 3,350
✅ This zone aligns with MMF liquidity retention and H1 continuation structure. Watch for bullish confirmation candles before entry.
🟥 Sell Zone
Entry: 3,362 – 3,364
Stop Loss: 3,368
Take Profits:
→ 3,358 → 3,354 → 3,350 → 3,345 → 3,340
⚠️ Ideal for short-term scalping or reversal confirmation setups. Rejection at VPOC or CP structure validates this zone.
⚠️ Key Notes for Indian Traders
Today’s sentiment is fragile and can shift fast with any unexpected statement from US Fed or geopolitical update.
Apply MMF structure in lower timeframes (M15/H1) for cleaner confirmation.
Avoid early entries. Wait for reaction signals near the marked zones.
💬 What Do You See Ahead?
Will MMF signals lead the market toward the deep FVG zone around 3,296?
Or are bulls getting ready to reclaim 3,360+ zones?
👇 Share your view and let’s trade smarter together with MMF precision.

ETH/USD | Short Setup at 288‐Period EMA ConfluenceEthereum has been grinding higher into a well‑defined supply zone between $1,625 – $1,635, which also coincides with the 288‑hour EMA (currently ≈1,623). This area has acted as resistance on multiple occasions, making it a prime spot for a short entry on signs of rejection (bearish engulf, high‑volume wick, etc.). Our initial profit target is the demand region around $1,555 – $1,565, where buyers have previously stepped in, with a conservative stop placed just above the EMA/supply zone. A clean turn lower from here could carry price all the way back to the key support at $1,547. Watch for increasing selling volume and a rejection candle before committing. Good risk‑reward and clear levels make this an attractive opportunity.

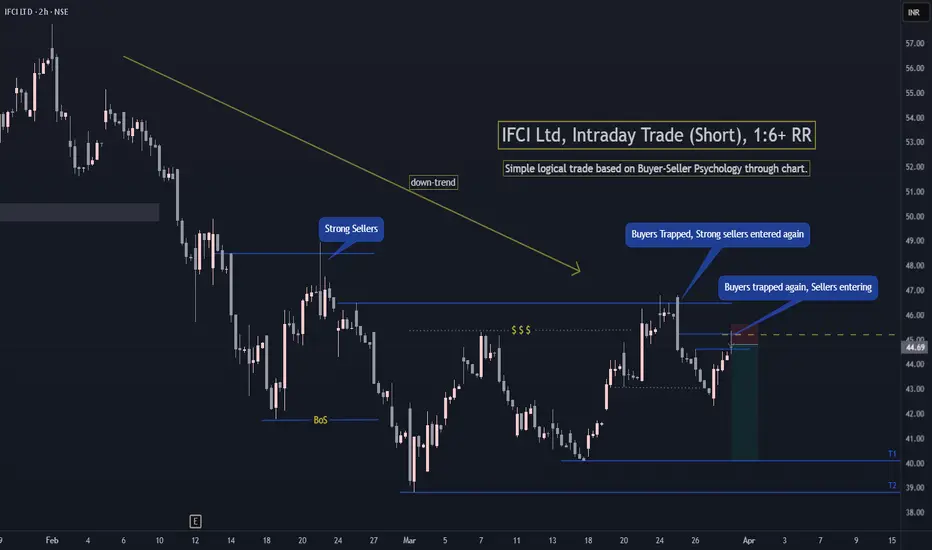
IFCI Intraday Trade (Short)IFCI is in down-trend and sellers have again trapped the buyers in discount zone. So there are high chances of price moving to Target 1 if Nifty is not very much bullish in coming sessions.
Simple trade based on buyer-seller psychology understanding. 1:6+ RR Trade.
If you have any questions. Do ask in comments.
Follow for more such simple and awesome setups. Thanks. Happy trading!
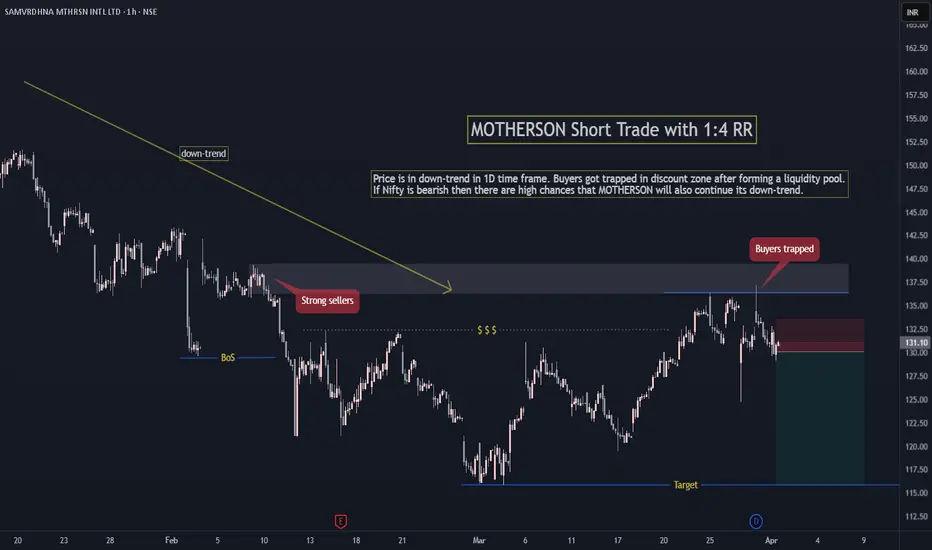
MOTHERSON Short Trade with 1:4 RRPrice is in down-trend in 1D time frame. Buyers got trapped in discount zone after forming a liquidity pool. (Inverse head & shoulder pattern retail traders got trapped )
If Nifty is bearish then there are high chances that MOTHERSON will also continue its down-trend.
Follow for more such simple setups based on Trend, Liquidity Grab and Current market direction. Happy Trading!
26th Dec ’23 - Positive Day with a rising VIX - PostMortem NiftyNifty Analysis
Recap from yesterday: “Since Monday is a holiday, it gives us added uncertainty on what to expect on Tuesday. Despite the 94pts gain by Nifty — I still see the price action as negative. I would like to go with a bearish stance for 26th Dec.”
4mts chart link - click here
Seems like I got the bet wrong, despite weakening geopolitical events - Nifty traded in the positive territory today. Only in the opening 15mts or so we saw a slight tendency to go below water but it was quickly bought into. Nifty rallied 146pts ~ 0.69pts from the LOD to HOD by 12.23.
NiftyIT 4mts charts - click here
Once it hit the intraday high, the steam eased off and then we started going sideways. NiftyIT has been such a decisive factor for Nifty50 these days. It lost almost 382pts ~ 1.07% and then recovered 492pts ~ 1.4% all in the opening 90mts. The final close was in the RED though (-0.41%).
63mts chart link - click here
I am forced to change my stance from bearish to neutral as the price action now shows a higher tendency to go up rather than down. Those strong RED candles of 20th Dec still haunt me - but it has failed to gather the momentum of the other bears. Since it's a holiday week - the FII action may be at a reduced space. Lower liquidity could bring in unusual price spikes - it is best suggested to take your trades with caution.
