OIL | Breakout After Triangle ConsolidationThe stock has given a clear breakout after a long consolidation within a triangle pattern. Post breakout, the price action is respecting the breakout level, which indicates strength and growing momentum. Overall, the structure looks positive and promising.
Technical Observations:
Breakout observed after triangle consolidation
Price is holding above the breakout zone
Momentum looks strong, indicating buyer dominance
Chart structure suggests potential continuation on the upside
Fresh Entry Zone:
Buy Above: ₹522.50 (on confirmation and volume support)
Potential Targets:
Target 1: ₹595
Target 2: ₹767
Further upside possible if momentum sustains
This setup looks suitable for traders who are looking to catch a momentum move, provided risk is managed properly.
Important Disclaimer:
This post is strictly for educational purposes only.
It is meant to explain:
How a final breakout occurs
How price action can expand after consolidation
Please do not treat this as financial advice.
Before taking any trade:
Consult your financial advisor
Use your own analysis and judgment
Always calculate risk and position size
Remember:
Every trade involves risk.
We operate in the financial markets where capital preservation is as important as capital growth.
Final Note:
Trade safely.
Trade with discipline.
And most importantly — keep learning and growing
LONG

XAUUSD Gold Next Move In Upcoming 2 Weeks ExpectedGold is Now Moving to 5600 to 5615 Which is Retracement level of 1.618 For Golds Previous Swing Extension levels and can expect a retracement of till 5000 to 5100 Levels In Upcoming Weeks Lets See WhatS Going to Happen..........# XAUUSD .. Check My 4hr chart Frame

Kalyan Jewellers Bullish SetupKalyan Jewellers
F&O Segment Stock
The stock fell almost 50% from its high of about ₹783 in September 2024. But now it's finding good support, building a base, and moving inside a parallel channel. For the past year, it's been stuck in a range—which usually means a bigger move is getting ready (could be a channel, triangle, or some other pattern).
Here's why I'm positive about it:
It's holding strong at the channel's lower support line.
It's sitting right on key moving averages (EMA support).
There was a big jump in trading volume near the support zone, which shows real buyers stepping in.
The chart shows a few resistance levels above—these can become price targets if the stock breaks out.
For safety, keep your stop loss at the previous major low for capital protection.
Trade wisely.

Is BTCUSD (Bitcoin) heading towards $91,000?Hello!
BTC has finally broken through its main downward trendline, signaling a shift in market sentiment after a prolonged period of selling pressure. Following this breakout, the price formed a clear inverse head and shoulders pattern, indicating that buyers have stepped in strongly after the final liquidation at the head level. Since then, BTC has been moving within a clearly defined ascending channel, consistently creating higher highs and higher lows, which confirms the bullish trend.
As long as the price respects the lower boundary of this channel, the bullish structure remains intact. The next significant resistance lies between the 92,500 and 93,000 levels, which also aligns with the previous breakout area you marked. This area is likely to attract sellers, making it a realistic target for the current move.
Overall, the chart continues to support an upward movement towards the 93K level, unless the price breaks below the channel support, which would weaken the bullish reversal setup.

BTCUSD: Overbought Rally Approaches Strong Support ZoneBINANCE:BTCUSD is nearing a crucial support zone, one where buyers have consistently stepped in before and sparked significant reversals. This price history alone makes this level incredibly important to watch closely. Price is approaching this zone once more, and the current market structure suggests potential for a bullish move if we see signs of rejection, such as a strong bullish engulfing candle, long lower wicks indicating absorption of selling pressure, or an uptick in buying volume.
If this support holds, I anticipate price will push towards the 98,700 area, fitting well with a short-term rebound scenario. However, if price breaks through this support and remains below it, the bullish thesis will be invalidated, opening up the possibility for a deeper pullback.
The best approach here is to wait for confirmation from the chart. Pay attention to how candles close, how volume behaves, and only consider long positions if the market defends this support level clearly. Solid risk management is key: position sizing, stop loss placement, and invalidation levels should always be aligned with the volatility that could arise around such a critical area.
This is just my personal view on the current support and resistance structure, not financial advice. Always do your own research and trade with a well-structured risk management plan. Best of luck out there!

Technical Analysis of BTCUSD – Is a Correction Approaching?BINANCE:BTCUSD is currently moving within a clearly defined falling wedge pattern, with price now pressing against the lower boundary of the structure. This level may act as dynamic support, and if price shows a strong rejection, a corrective move toward the resistance zone near 102,000 could occur.
If sellers manage to defend that resistance area, the bearish structure remains intact, giving BTCUSD the potential to continue dropping to lower levels. But if price breaks above that zone, there is room for a higher correction toward the upper boundary of the wedge.
At this stage, paying close attention to candlestick patterns and volume behavior around this key area is crucial for identifying the best selling opportunities. Make sure every trade setup is supported by clear confirmation, and always apply solid risk management.
If you have any additional insights or a different perspective on this setup, I’d love to hear it. Feel free to share your thoughts in the comments!

EUR/USD is entering a decisive SMC zone – Big move loading...📊 EUR/USD H4 – SMC Mapping & Trading Plan
1. Market Structure
Main trend: bearish (after clear CHoCH and BOS).
Price has formed Equal Highs (EQH) → strong liquidity above.
Untested liquidity zone below (OBB) → expectation for price to sweep down.
2. Key Zones
Supply Zone (OBS + FVG):
1.18100 – 1.18200
This supply aligns with the Fair Value Gap.
Expecting price to retest this zone and reject downward.
Demand Zone (OBB):
1.16500 – 1.16650
Strong demand zone combined with liquidity resting below previous lows.
3. Trade Logic (SMC Flow)
Scenario 1 (Short Setup):
If price reaches the OBS + FVG (1.1810 – 1.1820) area,
Expect bearish reaction → Sell setup.
SL: above 1.1830.
TP: demand zone at 1.1650.
Scenario 2 (Long Setup after liquidity sweep):
If price taps into OBB (1.1650 – 1.1665) and holds,
Expect bullish reaction → Buy setup targeting 1.1750 – 1.1780.
SL: below 1.1630.
4. Market Psychology
Buy side: attempting to push higher but likely just a pullback to fill FVG and sweep liquidity above EQH.
Sell side: in control after BOS to the downside, targeting demand below.
Flip Zone: once supply is broken, it may flip into a new reaction zone (support).
✅ Summary Plan
Sell Zone: 1.1810 – 1.1820 → TP 1.1650
Buy Zone: 1.1650 – 1.1665 → TP 1.1750

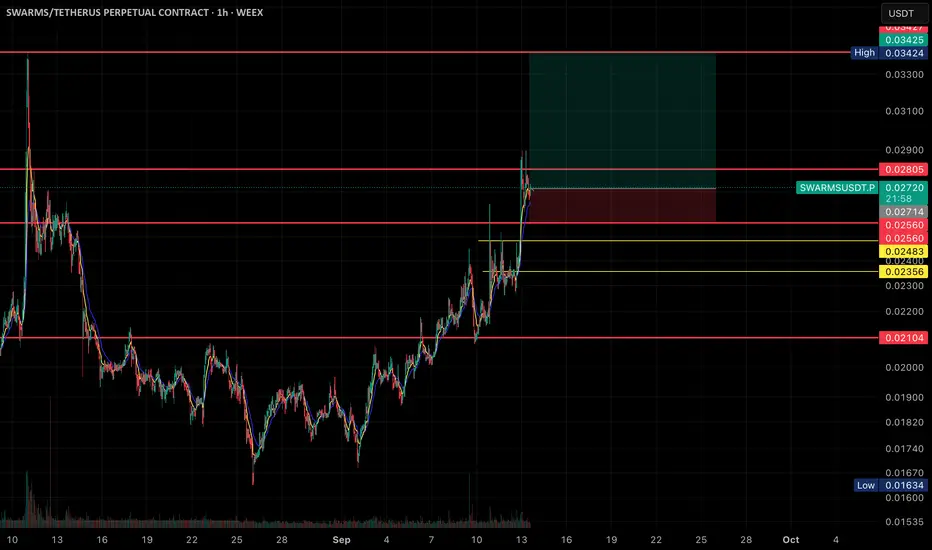
Swarms long ideaPair/Contract: SWARMS/USDT Perpetual Contract (1H timeframe, WEEX).
• Current Price: ~0.02719 USDT (+3.19%).
• Price Action:
• The chart shows a strong uptrend with higher highs and higher lows from early September.
• Price recently broke above a key resistance around 0.02714 – 0.02805, now acting as support.
• Setup:
• A long trade position is highlighted.
• Entry Zone: around current price (0.02719).
• Stop-loss: placed below the breakout zone, around 0.02560.
• Target Zone: ~0.03324 (upper resistance area).
• Support & Resistance Levels:
• Resistance: 0.02805, 0.03424.
• Supports: 0.02714, 0.02560, 0.02483, 0.02400, 0.02356, and a major support at 0.02104.
• Risk/Reward:
• The highlighted green/red box shows a favorable risk-to-reward ratio (larger upside potential vs downside).
• Indicators: Short-term moving averages are aligned upward, supporting bullish momentum.
📈 In summary: The chart is showing a bullish breakout setup where the price has pushed above resistance, with upside potential toward the 0.033+ zone, while stop-loss is set just below the breakout level.
ATH HIT ATHGot it ✅
This chart shows that the trade setup played out perfectly as predicted:
• Price broke out strongly from the entry zone around 0.0422–0.0423, exactly respecting the planned setup.
• It never hit the stop loss (0.0372), showing the risk management was well-placed.
• Instead, the coin rallied straight into the target zone, reaching a high of 0.0623, perfectly hitting the take-profit area.
• The EMAs supported the move, confirming the bullish momentum throughout.
• Even after taking profit, price is consolidating above support, showing continued strength.
📌 In short: The prediction worked out exactly as planned — clean entry, safe stop, and successful take-profit hit.

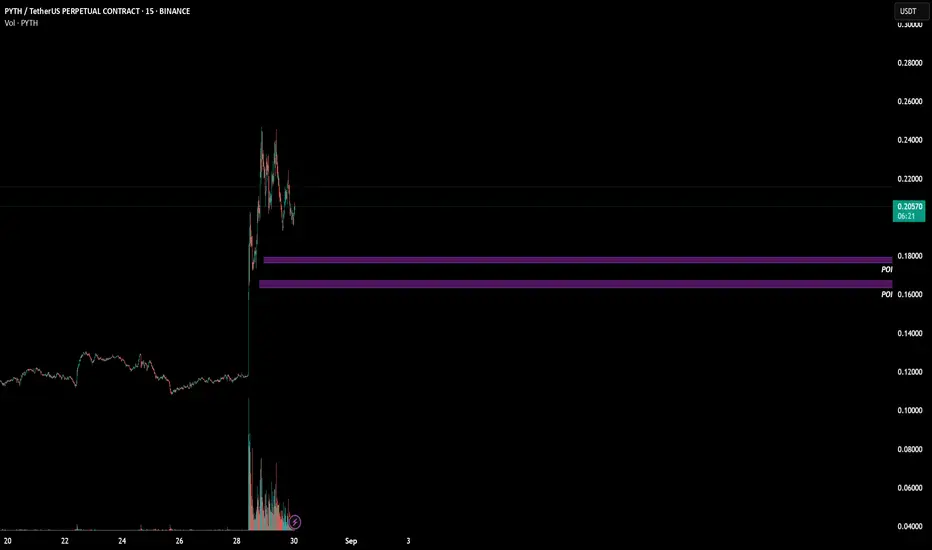
PYTH/USDT LONG IDEA
Long Idea to follow the impulsive trend of PYTH.
I personally like the 1st POI better - 0.1770 area.
This one also I am looking for at least double digit move.
Good luck everyone and happy trading!
ETHENA/USDT – 4H Long Setup📊 ETHENA/USDT – 4H Long Setup
Entry: 0.6520 (Current breakout level)
Stop Loss (SL): 0.5336 (Below 4H support)
Take Profit Targets:
• TP1: 0.6174 (previous 4H resistance retest)
• TP2: 0.6606 (major resistance level, dotted yellow)
• TP3 / Extended Target: 0.7000 – 0.7003 (major swing high)
📈 Analysis:
• Price has broken above recent consolidation and is retesting upper range.
• Strong support around 0.5333 (4H) and 0.5121 (1D), giving a favorable risk/reward.
• Increasing volume on the breakout suggests bullish momentum.
• Next key resistances are clearly marked at TP1 and TP2, with potential continuation to swing high zone.
⚠️ Note: Watch for rejection at TP2 zone; a partial take profit there can secure gains while letting the rest ride towards 0.70.

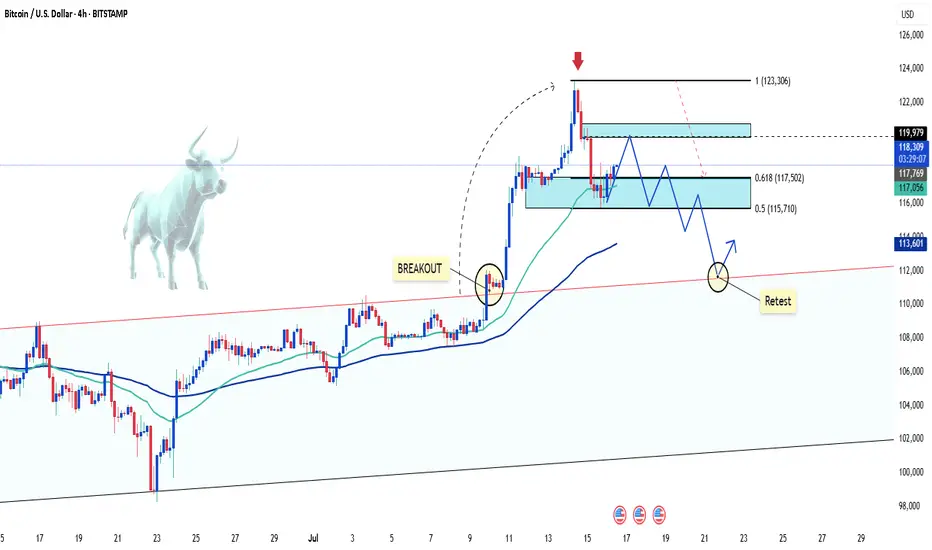
Bitcoin rebounds with strength after whale dumpAfter a surprising sell-off triggered by whale pressure, Bitcoin (BTCUSD) has shown impressive internal strength, bouncing quickly from the Fibonacci support zone between 114,488 and 116,571 USD (0.618 – 0.5 levels).
The D1 chart reveals that the bullish structure remains intact, with EMA 34 and EMA 89 acting as solid support levels. The recent "dump" did not alter the overall trend; on the contrary, it created an opportunity for reaccumulation within the price box—serving as a vital base for the next breakout.
A likely scenario is that BTCUSD will continue to move sideways for a few more sessions before targeting the 1.272 Fibonacci extension near the 128,000 USD area. If this plays out, it would be a strong confirmation of the next growth phase for Bitcoin.
Do you believe Bitcoin is ready to break all-time highs and set a new record? Share your thoughts below!

TATACONSUMHi guys, In this chart i Found a Demand Zone in TATACONSUM for Long Term, Observed these Levels based on price action and Demand & Supply. WW. Don't Take any trades based on this Picture
...because this chart is for educational purpose only not for Buy or Sell Recommendation..
Thank Q

Bullish In Bitcoin Just My View
We Have to wait for an Confirmation can 5M candle I.e. Hammer or Bullish Engulfing, Marubozo...
Entry @ 119035
Sl @ 118170
Tp 1 @ 122287 ( Must Book 75%)
Tp 2 @ 125000 (With Trailing SL)
Have a Great Day guys

BTCUSDT – Uptrend Remains IntactBitcoin is undergoing a mild pullback after breaking out to a recent high near 120,000 USD. The price is currently consolidating within a price box ranging from 112,325 to 120,016 USD – a healthy pause before a potential continuation of the bullish trend.
The key support zone lies at 112,325 USD (Fibonacci 0.618), which could act as a launchpad if retested. Should buying pressure clearly re-emerge at this level, BTC may resume its upward trajectory and aim for the 1.618 Fibonacci extension at 132,459 USD.

BTC/USD Pullback: What’s Next for Bitcoin?Hello, passionate and wealthy traders! What are your thoughts on BTC/USD?
After a strong surge above the 122,500 USD zone, BTC/USD has started to experience a slight pullback. This is completely normal and necessary for Bitcoin to gain new momentum.
In my personal view, the recent peak of BTC/USD signals that this correction is in play. But where do you think BTC/USD will adjust to? Personally, I believe the 111,500 USD zone is quite reasonable. It’s also the previous breakout level, and this pullback aims to test the uptrend safely.
What about you? Where do you see BTC/USD heading? Looking forward to hearing your thoughts!
MOTISONS, positive outlook in coming daysNSE:MOTISONS
Again coming up with trade idea. tight consolidation in range of 3-4% within last 5-6 days. Price is taking support on short term EMA. Looks like weak hands are exiting. Breaking above the pivot line (22.08) could lead to significant push when crossing with good volume. Good volume is observed today.
SL is somewhere around 5-6% (Refer the long position drawn over the chart).
One can invest 10% portfolio size as per following calculations
Position sizing and managing risk is the key.
Portfolio is: 1,00,000
Position size: 10,000
Risk 5%: 500. Which means only 0.5% of overall portfolio value is under risk.
Stay connected for commentary for coming days.
Disclaimer:
The information provided herein is for educational and informational purposes only and should not be construed as investment advice. The stock analysis and recommendations are based on publicly available information, data sources believed to be reliable, and our interpretation at the time of writing.
Investing in equities involves risks, including the risk of loss of capital. Past performance is not indicative of future results. Readers and investors are advised to conduct their own research or consult a qualified financial advisor before making any investment decisions.
The author(s), affiliates, or associated entities may hold positions in the stocks mentioned, and such positions are subject to change without notice.
We do not guarantee the accuracy, completeness, or timeliness of any information presented, and we disclaim any liability for financial losses or damages resulting from the use of this content.

BTC/USD Soars: A Surge That Took the Market by SurpriseBitcoin BITSTAMP:BTCUSD has shocked the market with a massive surge, reaching new highs in recent days. This unexpected jump has taken many traders and analysts by surprise, as BTC breaks through previous resistance levels.
The driving forces behind this surge appear to be increased institutional interest, positive market sentiment, and strong demand from retail investors. As Bitcoin enters new territory, it's essential for traders to stay vigilant and manage their risk, as volatility remains high.
Will Bitcoin continue its rally or face a correction? Keep an eye on the charts for the next move!

BTCUSDT – Is a Breakout Imminent?Bitcoin is once again testing the descending trendline that previously triggered three strong rejections, hovering around the 106,500–106,600 USDT zone. A clear rounded bottom has formed, with strong support holding around 104,200–104,700, fueling the recent rebound.
Price action is now consolidating just below the key resistance, setting the stage for a potential bullish continuation pattern. A clean breakout above this zone could open the door for a rally toward 108,600 and even 110,200 – both previous highs.
However, if the trendline holds again, the highlighted support zone is likely to attract fresh buying interest. The overall market bias leans bullish, but confirmation via breakout is crucial for the next move.
Are you ready to ride the next BTC wave?

A NICE CONTRACTION before Breakout! - GODREJPROPThe following points need to be considered before entering a trade:
---------------------------------
1. A good accumulation near the level of 1950 is observed.
2. A good contraction pattern indicates a sharp breakout of the zone.
3. Price is repeatedly testing its 200 ema making Higher lows.
Considering these points, a trade can be entered as follows:
Entry - 2277, SL 2150, Tgt 2550, RR 1:2
DISCLAIMER : This is NOT a Trade recommendation, but only my observation. Please make your own analysis before entering any trade.

Trendline BreakoutA trendline breakout occurs when the price of an asset moves decisievly above a downward- sloping trendline, potentially signalling a change in the prevaling trend.
Entry at around 190
with stop loss of 180 we can target 207 one it closes above 196.

Crude Oil Futures Under Pressure; Key Resistance Confirmed at ₹5Crude Oil futures on the MCX continued their downward trajectory on Wednesday, closing near ₹4,949 amid growing bearish momentum. WaveNodes Pro Max AI flagged a "Seller Trap Possible", but downside targets remain intact for now.
Seller trap alert means big players are finding opportunity to trap or shed short sellers.
The system-identified Short Entry at ₹5,212 has held firm as resistance, with two clear retests failing to breach the impact zone of ₹5,233–₹5,263. This former support has now flipped decisively into supply, adding pressure on intraday rallies.
🔻 Key Developments:
AI Bearish Probability: Rises to 50.9%, surpassing bullish odds.
Target 1 (₹5,036–₹5,103) achieved successfully.
Target 2 set at ₹4,750–₹4,818, with potential for deeper correction toward ₹4,465–₹4,533.
Profit Booking Alert: ₹5,084 marked as short-term profit-taking zone.
📉 Market Sentiment:
Volatility remains elevated at 23 PPB, with good volatility reading at 21 PPB, suggesting controlled but active movement.
Despite bearish strength, the AI warns of a possible seller trap, especially if prices reclaim levels above ₹5,084.
🧠 Analyst Take: “The rejection at ₹5,212 confirms the breakdown structure. As long as crude trades below this zone, lower targets remain open. However, a surprise reclaim could trigger short covering,” analysts from WaveNodes noted.
📊 Outlook:
Trend: Bearish
Resistance: ₹5,212–₹5,263
Support: ₹4,750 → ₹4,465
Traders are advised to watch volumes closely as crude approaches the next support band. A failure to break lower could validate the seller trap thesis.

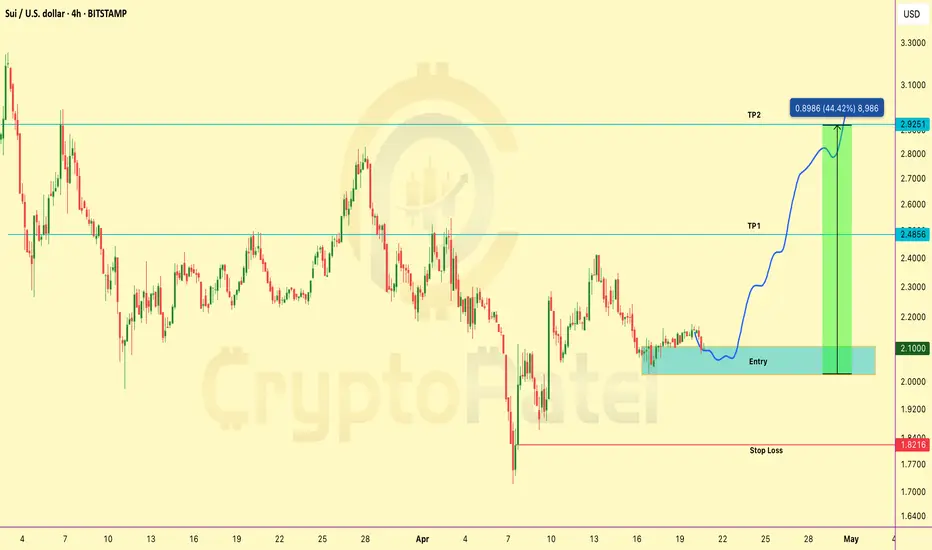
SUI/USDT Chart Analysis and Looking Long Setup for Good RRIf you're hunting clean setups with solid R:R — this CRYPTOCAP:SUI long looks 🔥
▶️ Entry: $2.10–$2.00
▶️ Targets: $2.48 / $2.92
▶️ SL: $1.82
Perfect for risk-managed apes. Don’t sleep on it.