Update on NASDAQ BULLISH BIAS IDEA.This is how market respects the zone and levels.
I don't share signals and dreams , I share clarity and ideas for you to focus on.
Longposition

$AG setting up for a rip your face off rally #tothemoonFirst Majestic is a hated stock as of now, it also has the largest short position in the entire silver miners listed in NYSE. Bad sentiments and frustrated investors is a great combination to identify when a sector bottoms.
Looking at the price action as of now, especially from $4.5 to $7.8 it looks like a strong bullish reversal. Also this is a institution move, smart money is buying silently. Also with silver heading to new highs, which means that silver miners are turning healthy. Many silver miners are making decent margins already around 15-20% OPM, the higher silver prices go the more Free Cash Flow will be generated which will directly impact bottom line. And, the valuations are dirt cheap.
Reasons why like like First Majestic :
- Acquired Gatos Silver recently, by this deal the net AISC improves, i feel it should be around $20-18. Before acquisition NYSE:AG AISC was $25, Gatos Silver being a low cost producer should now cumulatively bring the AISC down.
- They also announced a share repurchase program which is a positive.
- They are the only silver miner with a Mint capacity, First Mint Store. Unlike other mints, which are either government-owned or privately held. Good addition to capture the entire value chain.
Well at current valuation and where the silver price is at its hard for me to see the downside. So i may be biased. I will only exit this scrip if i see Silver go below $23. That is my exit criteria.
Disclaimer : This analysis is purely for education. As i am invested in this scrip I may be biased. Don't take this as an investment advice. Please consult your financial advisor before any speculative investments.

DRAGONFLY LTDDRAGONFLY INC, as per chart view it formed FALLING WEDGE PATTERN and made breakout with entry level $6.88 with EMA crossover. We can expect the Final target to $13.

DRAGONFLY INCDRAGONFLY INC, as per chart view it formed FALLING WEDGE PATTERN and made breakout with entry level $6.88 with EMA crossover. We can expect the Final target to $13.

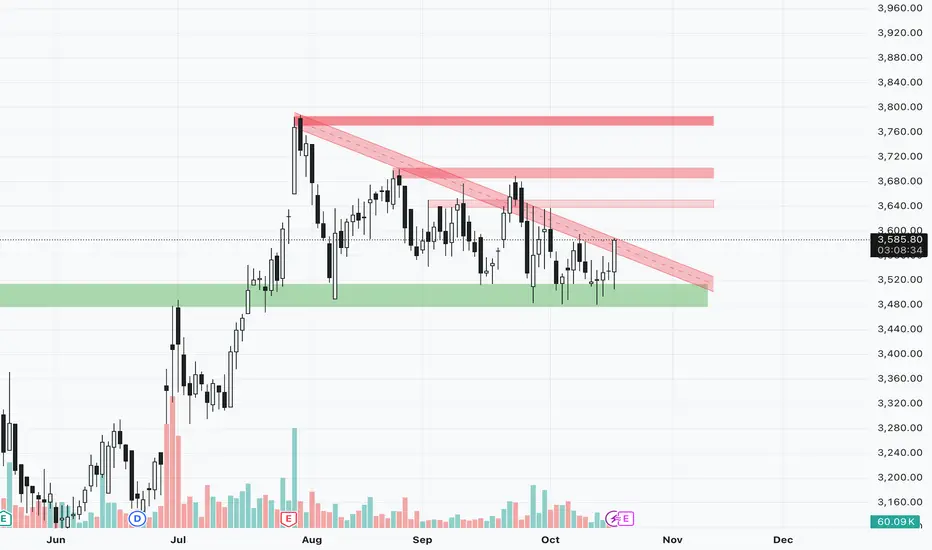
Torrent Pharma Long Swing CandidateChart Analysis :
Price making a flat decending triangle pattern while holding a major weekly support of 3500 levels and looking to breakout above the trendline resistance zone and can be considered for long. One can enter here or wait for 3600 above daily close or one hour sustain above 3600.
Key Levels :
Targets (Resistance) - 3650/3685/3700/3750
StopLoss (Major Support) - 3500 below daily close
Disclaimer:
I am not SEBI registered. This analysis is for educational purposes only and not investment advice. Please do your own research before trading or investing.
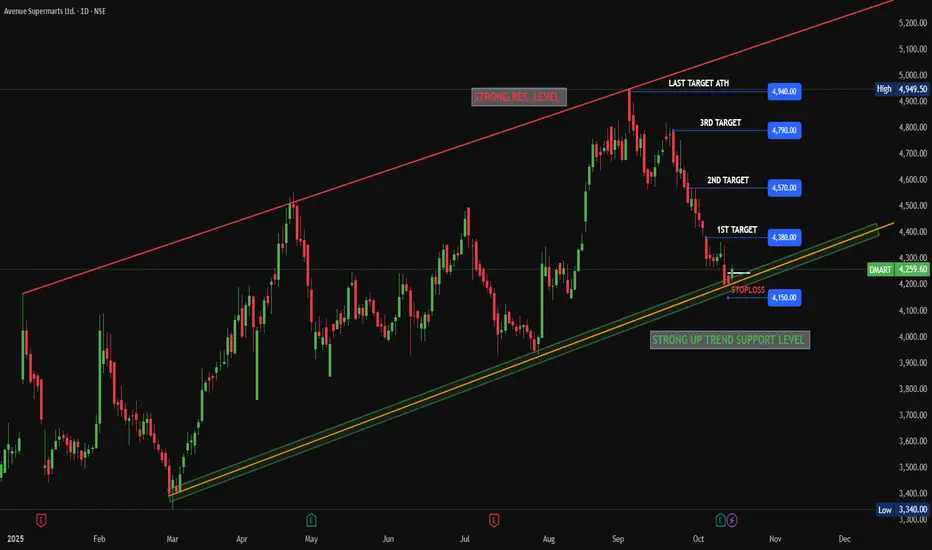
DMART LONGDMART (Avenue Supermarts) has reached a strong trend support level. Additionally, in the daily timeframe, the current candle closed at the previous day's candle level.
Therefore, we can go long in DMART for a swing trade. Fundamentally, the quarterly results are already out, so there is no immediate issue regarding upcoming events.
Go long on DMART, but make sure to manage your trade quantity, risk, and reward based on your risk appetite. This is for educational purposes only and does not guarantee returns.
GLENMARK PHARMA LONG SETUP FORMATIONKeep eye on Glenmark Pharma closing above 1845 than make long position with small stoploss and wait for the reward. No guaranteed return assured. Do your analysis from your side than made an entry.

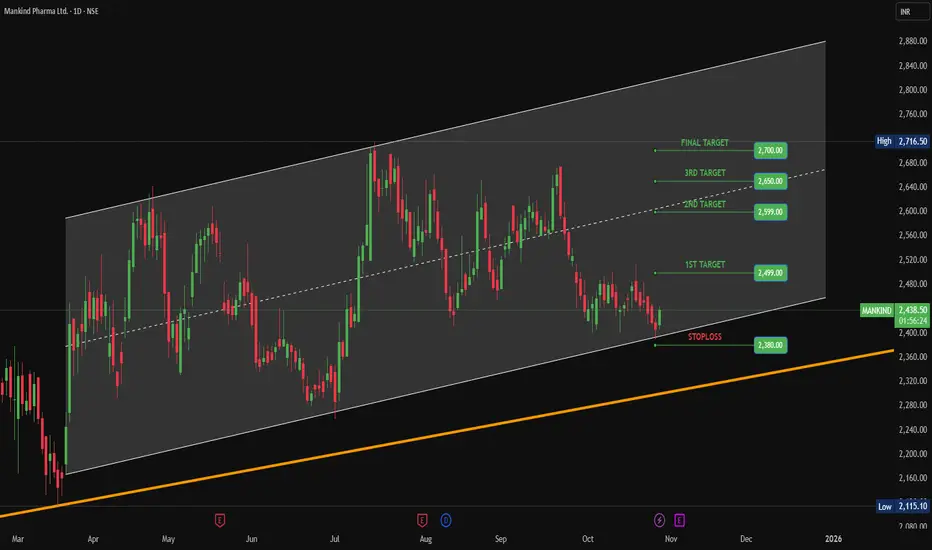
BUY MANKIND PHARMAMankind pharma at trend support level and already gives a strong breakout on candle stick pattern. Taking small Risk for big reward.
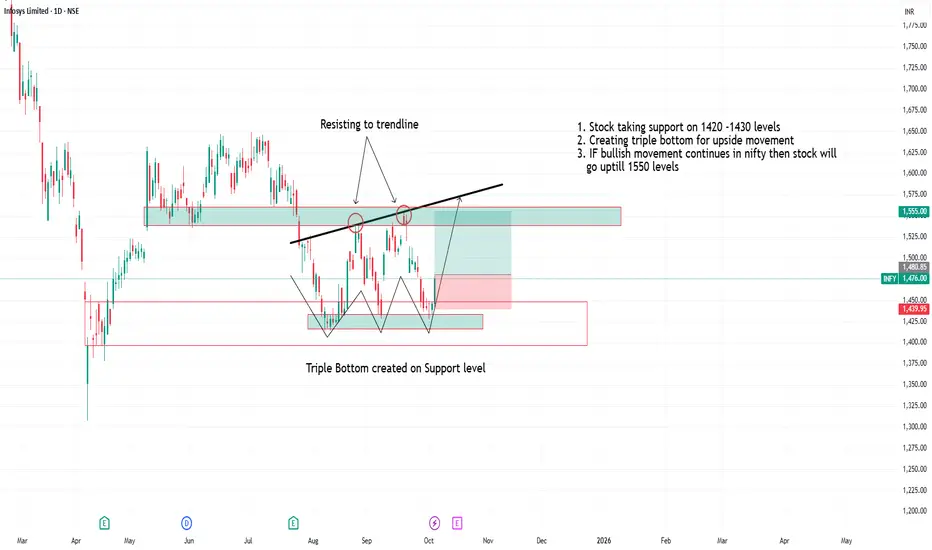
Infosys creating triple bottom on 1420-1430 level1. Stock taking support on 1420 -1430 levels
2. Creating triple bottom for upside movement
3. IF bullish movement continues in nifty then stock will
go uptill 1550 levels
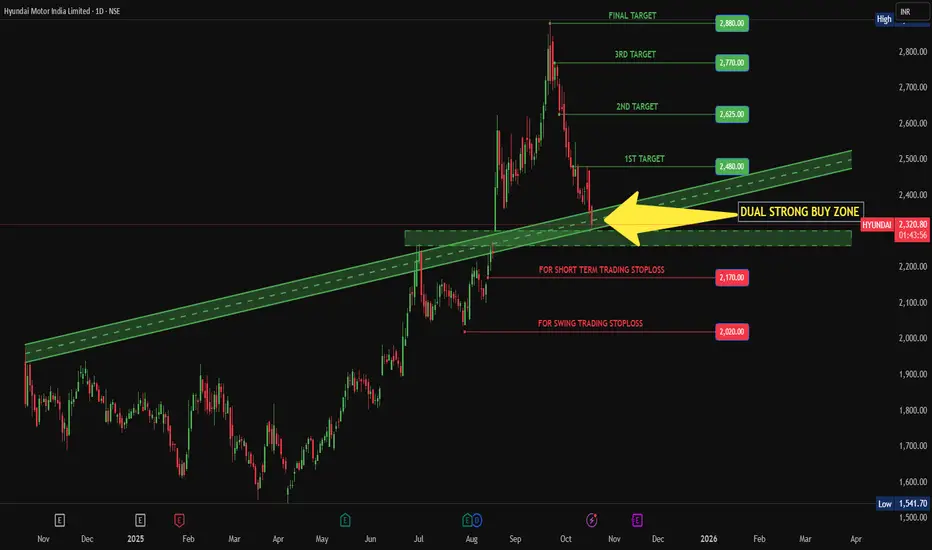
HYUNDAI IN STRONG BUY ZONEHyundai Motors India reach at dual strong buy zone area to consider as a long trade, use your skill as well knowledge to enter in a trade not guaranteed return. Do your own research than make a trade. But technically and fundamentally Hyundai is in good spot to consider as a long trade.
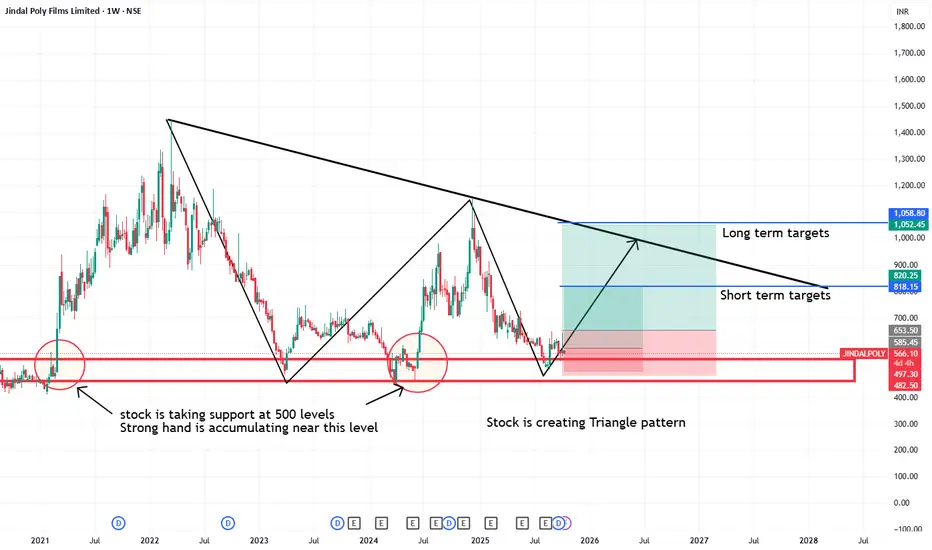
Jindal poly creating triangle pattern stock is taking support at 500 levels
Strong hand is accumulating near 500 level
Good triangle pattern is forming
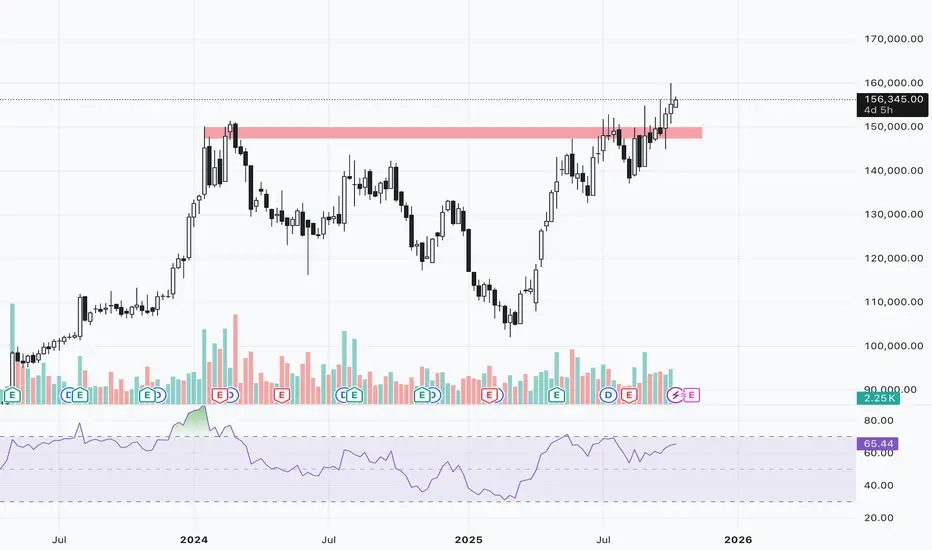
MRF Breakout Swing CandidateChart Analysis :
The stock has broken out above the all time high resistance and major psychological level of 150000 and is sustaining above the zone. A long position can be considered around 156500 zone.
Key Levels :
Entry : 156350-156500
Targets : 160000/163170
Stop-Loss : 152500 below day tf close
Disclaimer:
I am not SEBI registered. This analysis is for educational purposes only and not investment advice. Please do your own research before trading or investing.
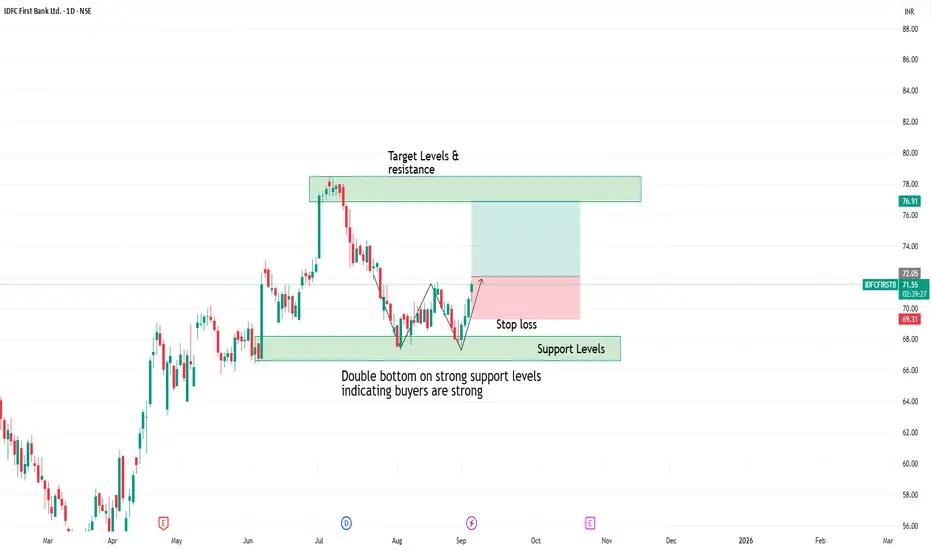
Double bottom created in idfc first bank Double bottom created on support levels
which indicates buyers are strong and accumulating at support levels
one can observe this for upside movement with strict stoploss
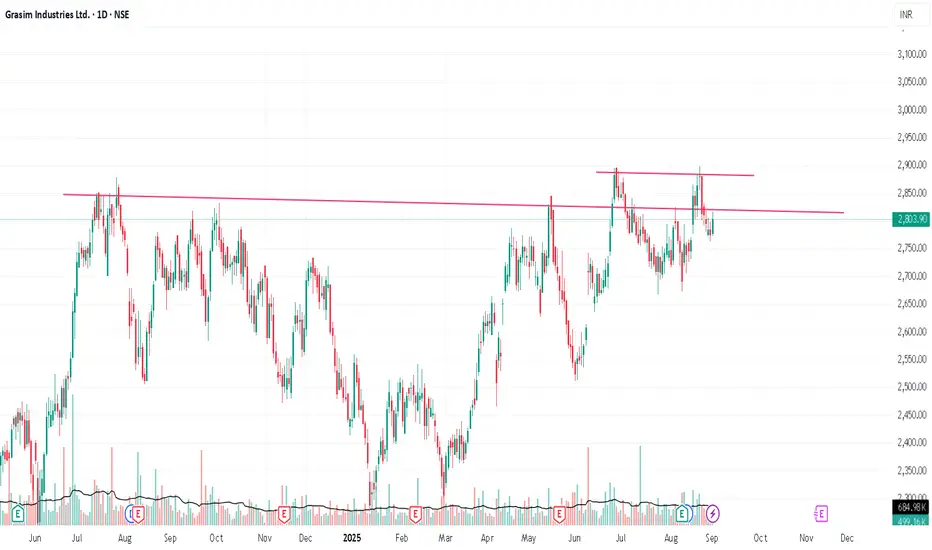
Flexing at All Time HighGrasim broke a cup & handle pattern and came down, again trying to break another trendline at top of the cup & handle pattern. if it breaks and sustain above the latest breakout with good volume, it'll move up for sure.
***This is only for educational purposes***
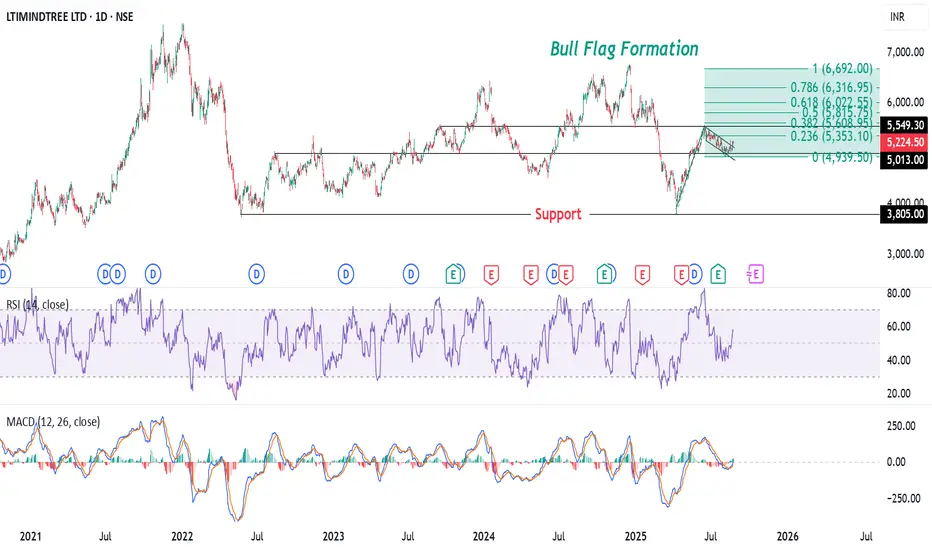
LTIMINDTREE Forms Bull Flag: Signs of a Potential Upside Move?The chart of LTIMINDTREE LTD shows a Bull Flag formation, a bullish continuation pattern that typically appears after a strong upward move. The flagpole is represented by the sharp price rally, from 3,800, followed by a downward-sloping consolidation channel forming the flag.
This pattern suggests a potential breakout to the upside, supported by the Fibonacci extension levels projecting targets up to the .618 fib ext. level at ₹6,022. The RSI is near 56.89, indicating moderate strength, while the MACD shows a possible bullish crossover, further reinforcing the bullish outlook. The key support level is around ₹5,000, and a breakout above the flag could signal a resumption of the uptrend.
Disclaimer: The information provided in this analysis is for educational and informational purposes only and should not be considered as financial or investment advice.
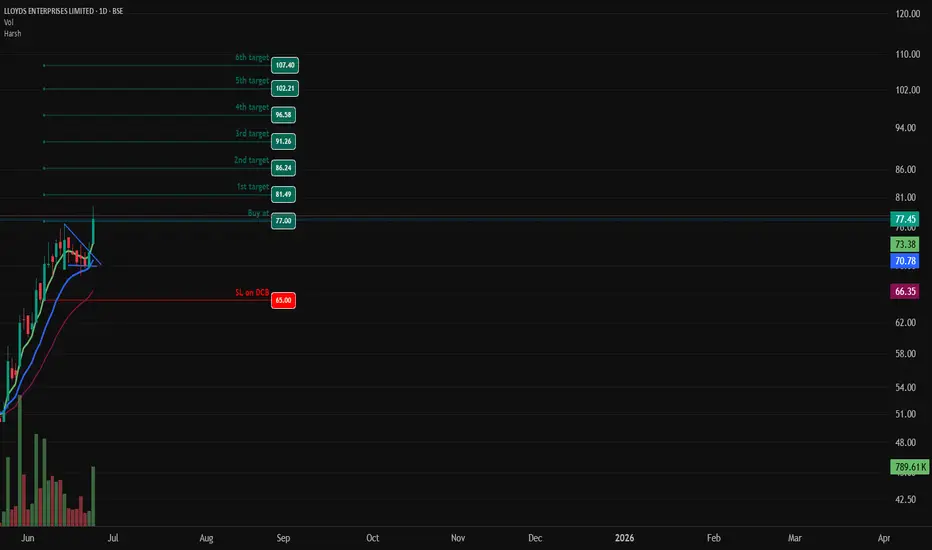
LLOYDS ENTERPRISES - Bullish Flag & Pole Breakout (Daily T/F)Trade Setup
📌 Stock: LLOYDS ENTERPRISES ( NSE:LLOYDSENT )
📌 Trend: Strong Bullish Momentum
📌 Risk-Reward Ratio: 1:3 (Favorable)
🎯 Entry Zone: ₹77.00 (Breakout Confirmation)
🛑 Stop Loss: ₹65.00(Daily Closing Basis) (-15% Risk)
🎯 Target Levels:
₹81.49
₹86.24
₹91.26
₹96.58
₹102.21
₹107.40 (Final Target)
Technical Rationale
✅ Bullish Flag & Pole Breakout - Classic bullish pattern confirming uptrend continuation
✅ Strong Momentum - Daily RSI > 60, Weekly RSI >60 Monthly rsi >60
✅ Volume Confirmation - Breakout volume 789.61K vs previous day's 197.17K (Nearly 4 times surge)
✅ Multi-Timeframe Alignment - Daily and weekly charts showing strength
Key Observations
• The breakout comes with significantly higher volume, validating strength
• Well-defined pattern with clear price & volume breakout
• Conservative stop loss at recent swing low
Trade Management Strategy
• Consider partial profit booking at each target level
• Move stop loss to breakeven after Target 1 is achieved
• Trail stop loss to protect profits as price progresses
Disclaimer ⚠️
This analysis is strictly for educational purposes and should not be construed as financial advice. Trading in equities involves substantial risk of capital loss. Past performance is not indicative of future results. Always conduct your own research, consider your risk appetite, and consult a financial advisor before making any investment decisions. The author assumes no responsibility for any trading outcomes based on this information.
What do you think? Are you watching NSE:LLOYDSENT for this breakout opportunity? Share your views in the comments!
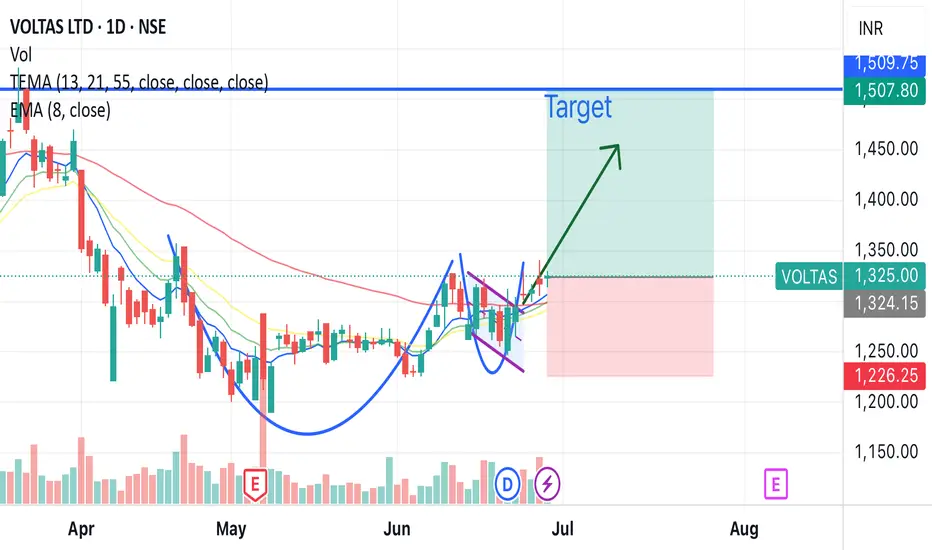
Voltas breakout soon cup and handle patternVoltas will soon be flying, cup and handle breakout pattern, pattern is very prominent, high chances of breakout in short term 15% profit.
Also reaching golden crossover
Buying range - 1310 - 1330
Target - 1507 (15%)
Hold duration - 1-2 month
Voltas belongs to Tata groups and have good fundamentals.
ETH Technicals Hint at Breakout — All Eyes on the 2588 Level📊 Cycle Structure:
HWC (Higher Wave Cycle): Bullish 🔼
MWC (Middle Wave Cycle): Ranging 🔁
LWC (Lower Wave Cycle): Bullish 🔼
The overall market structure leans bullish. With both HWC and LWC pointing upward, the directional pressure favors long setups.
❗️If you're looking for a short position, this analysis isn't for you.
🔍 Price Action Structure & Entry Scenario:
A strong resistance zone at 2588 has already been tested four times.
A fifth touch often increases the probability of a breakout — especially in a bullish-biased environment.
A 1H ascending trendline sits right below the resistance, acting as dynamic support.
📌 My Strategy: Pre-Breakout Entry
My approach focuses on entering before a confirmed breakout — riding the early wave toward resistance.
This includes watching for compression, weak selling volume, and bullish candlestick structures.
⚠️ This method is inherently riskier, and the chance of getting stopped out is higher, so solid risk management is essential.
👥 Based on trading style, here’s how different traders might approach this:
🔁 Reactive traders can wait to see how price reacts at the trendline.
🔓 Breakout traders should wait for a confirmed 15min or 1H close above 2588.
🐳 Those expecting a sharp whale-driven move may consider placing a Buy Stop Order above resistance.
🎯 Entry Levels & Risk Management:
Aggressive Entry: Pre-breakout trigger near 2588 (riskier).
Conservative Entry: Wait for a confirmed breakout candle above 2588.
Stop-loss idea: Below the 1H trendline, acting as a dynamic support.
📉 Invalidation Level:
My bullish outlook holds as long as we’re above 2387.
If price closes below that, I’ll re-evaluate for a possible short — but until then, the focus remains on the long side.
💬 Want me to analyze a specific coin?
Drop it in the comments — I’ll review and pick one for the next post.
⚠️ Without proper risk management, you're just a ticking time bomb.
— PXA 📊

XAU/USD 4H Analysis: Bullish Momentum Towards $2,780📊 XAU/USD 4H Chart Analysis – Bullish Momentum 🚀💰
📌 Key Observations:
🔹 Current Price: $2,754.16 (+0.19%)
🔹 Support Zone: $2,740 - $2,750 (Previous resistance turned support ✅)
🔹 Resistance Zone: $2,780 (Next potential target 🎯)
🔹 200 EMA: $2,687.43 (Price is above = Bullish signal 📈)
🔹 Breakout Confirmation: Price has broken past a key level and might retest before moving higher 🔄📊
📉 Potential Scenarios:
✅ Bullish Case: If price holds above $2,750, we could see a rally towards $2,780+ 🚀
❌ Bearish Case: If price drops below $2,740, we might see a correction back to $2,720 ⚠️
🔥 Conclusion:
Gold is showing strong bullish momentum and may continue its uptrend towards $2,780+ if it sustains above the breakout level! Keep an eye on support at $2,750 for confirmation. 👀💎
Tell me in Comments Would you like further indicators or a different timeframe analysis? ⏳📊

BEML- Breakout updateBEML CMP: 4360.25; RSI: 67.40;
BEML has completed primary level ABC correction pattern. Now clear breakout above 4280 level was observed as script is sustaining above breakout level from last 3 consecutive trading sessions, representing strength in script and bottoming out signs.
Thus, fresh position in BEML can be initiated. Chart structure is strong and must be accumulated for a swing trade as per below suggested levels.
Accumulation Zone: 4300-4400
Stop Loss: 4280
Target: 4604-5052-6234
✅ FOR MORE TRADING IDEAS LIKE THIS, PLEASE LIKE, SHARE, AND FOLLOW MY IDEA STREAM ✅

Axis Bank Increased Volume and Strong support Axis Bank Seems to stay Strong at the Current level of 1070 for the past 5 Sessions , which seems to be intercepting point for Pivot, Fibonocchi and Trendline Support , Short term move upto 1150 can be expected on Stable market Condition . Repositioning Pivot around 1120 for upcoming Week may make it possible .
Setup : NSE:AXISBANK
Buy Near 1070
Book Near 1150
SL below 1030

Perfect Time for a Long Entry.Natco Pharma has clearly turned it's way now, after a fall of more than 20% from it's ATH, is has shown some good reversal confirmations, first being it has take rejection form Fibonacci 0.5 level as well as From it's Important Support Zone, Second being formation of two Bullish Chart Pattern i.e. Inverted Head & Shoulders and Falling Wedge pattern and it has given breakout of these pattern too. There are higher probabilities of it going towards a New ATH.

Clear Breakout of Falling WadgeClear Breakout of Falling Wadge, With good Volumes And Bullish Momentum. Enter on a pullback to 740-735 levels and keep a swing target of 825-850.
