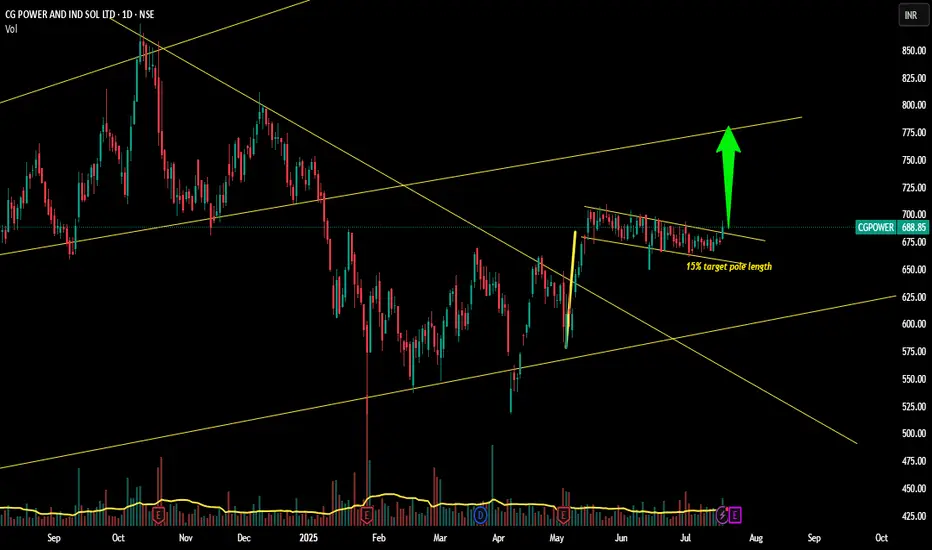
CGPOWER Bullish flag Breakout!!!!Yes!!!
Chart looks good for a good upmove
Weekly chart shows a GOOD BREAKOUT(shown below)
Daily chart shows a Bullish flag and pole and BREAKOUT WITH VOLUME TODAY !!!!
SL can be taken as 666....(bit wider) or the low of todays candle...
Targets-715,730,752
Just my view...not a tip nor advice!!!
Thank you!!!!
Longsetup
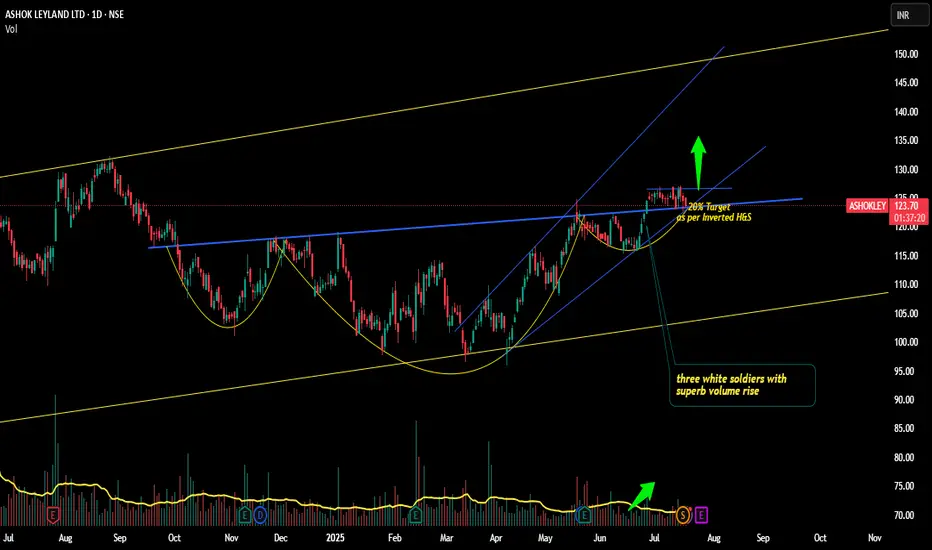
Ashokleyland Truck and Bus loaded with BULLS ?!!Yes!!!!
Chart patterns suggest me the above titled opinion of mine.
Reasons-
1. It's moving in a Ascending channel pattern from MARCH 2020 TILL NOW
2. 3 Upside candles(3 white soldiers) in monthly timeframe(shown below) with good rise in volumes
3. In weekly time frame, Bullish Marubozu candle Breakout seen with good volumes (shown below)
4. Coming to daily time frame, Inverted h&s pattern looks visible and Breakout has happened and now retesting.(there also 3 white soldiers visible)
5. As per pattern , target is about 20% from current levels.(soon to 150 level. )
6. We can enter now with sl as daily close below 120.4, targets -130,138,144 levels
Ashokleyland looks way good for the long term investment (buy and forget) too!! !
This is just my opinion...not a tip nor advice!!!!
Happy trading!!!!
Thank you!!!!
BTCUSDT – Breakout confirmed, bullish momentum continuesBTCUSDT has officially broken above a long-standing resistance channel, confirming a breakout and establishing a base around the nearest Fair Value Gap. The price action maintains a clear uptrend structure with consecutive higher lows and higher highs, supported by consistent buying pressure after minor pullbacks.
In terms of news, the U.S. decision to temporarily delay stricter regulations on spot Bitcoin ETFs, along with stable interest rate signals from the Fed, has boosted market sentiment. Capital continues to flow into crypto, especially as altcoins show limited recovery, making BTC the preferred asset.
As long as BTCUSDT holds above the nearest support zone, the pair is likely to advance toward the next psychological resistance. Any pullbacks could offer a buy-on-dip opportunity in line with the current trend.

Gold rebounds – Is the next bullish wave starting? XAUUSD is holding firmly above its ascending trendline, with each pullback quickly absorbed around the support zone near 3,333. The current price structure suggests a continued move higher, as long as the trendline remains intact.
On the news front, U.S. PPI data came in at 0.2% — exactly in line with expectations — offering no major surprises. With the dollar failing to gain strength, gold remains supported. In this context, XAUUSD is likely to continue its climb toward the next resistance zone near 3,447, which has previously triggered strong price reactions.

XAUUSD – Facing Strong Resistance, Pullback Risk IncreasesGold is approaching a major resistance zone that previously halted its upward momentum. Bullish momentum is fading, while the RSI shows signs of mild divergence. Market expectations around Federal Reserve policy, along with key data like CPI, unemployment rates, and geopolitical developments, are putting pressure on the precious metals market.
Without a strong catalyst from upcoming news, gold may enter a short-term pullback phase before establishing its next major trend.

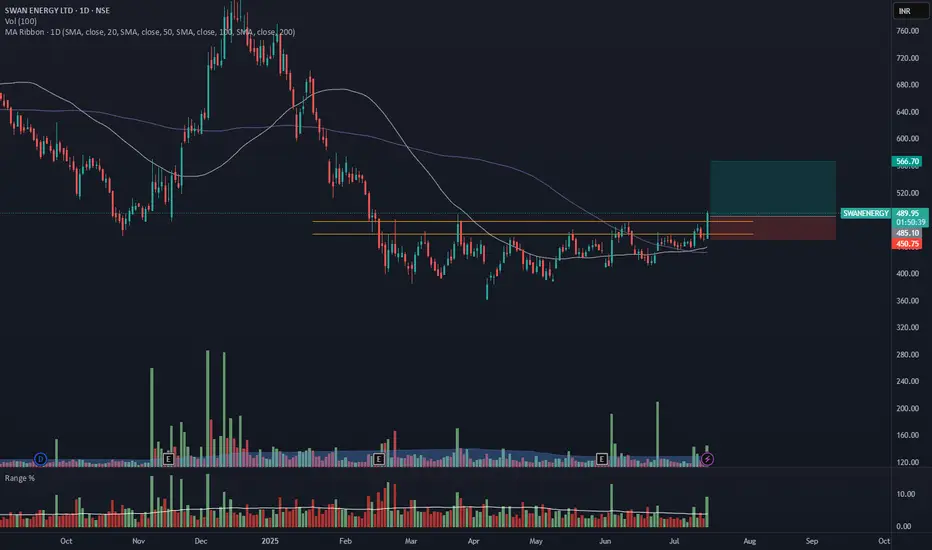
SWANENERGY - Daily Timeframe Breakout (Resistance Zone Break)SWAN ENERGY has shown a breakout above a key horizontal resistance level on the daily chart, accompanied by a nearly 2.5 times volume surge near the breakout zone, as seen earlier, supported by strong momentum.
🔍 Breakout Context:
- Price might break above the ~₹484 horizontal resistance, which had held for over 6 months.
The breakout zone has been supported by 2.5X volume and a range 3X of average near the resistance zone.
- The price is also trading above both the 50- and 100-day SMAs, indicating strong trend continuation.
- This aligns with a bullish continuation setup.
📉 Trade Plan:
- CMP: ₹485.2
- Entry: Near ₹484
- Target: ₹566 (~16.5% upside from CMP)
- Stop-Loss: ₹450
- Risk-Reward Ratio: ~ 1 : 2.3
📌 Note:
- Wait for the closing of this candle, enter the trade near 3:20 PM, or get confirmation on 75min/1Hr TF.
- Avoid chasing the extended move unless confident in intraday momentum.
⚠️ Disclaimer: This post is for educational purposes only and not financial advice. Always do your research or consult a financial advisor before trading.
BTCUSDT: Strong Uptrend, Targeting New HighsBTCUSDT is in a very strong uptrend, consistently setting new highs driven by overwhelming buying pressure and green Fair Value Gaps (FVGs).
Currently at $125,144, Bitcoin could reach $134,128 around July 21, 2025. This rally is fueled by ETF approvals, the Halving effect, a favorable macroeconomic environment (safe-haven, inflation hedge), and the expanding crypto ecosystem.
The preferred strategy is to buy on dips or breakout of resistance, always managing risk tightly.

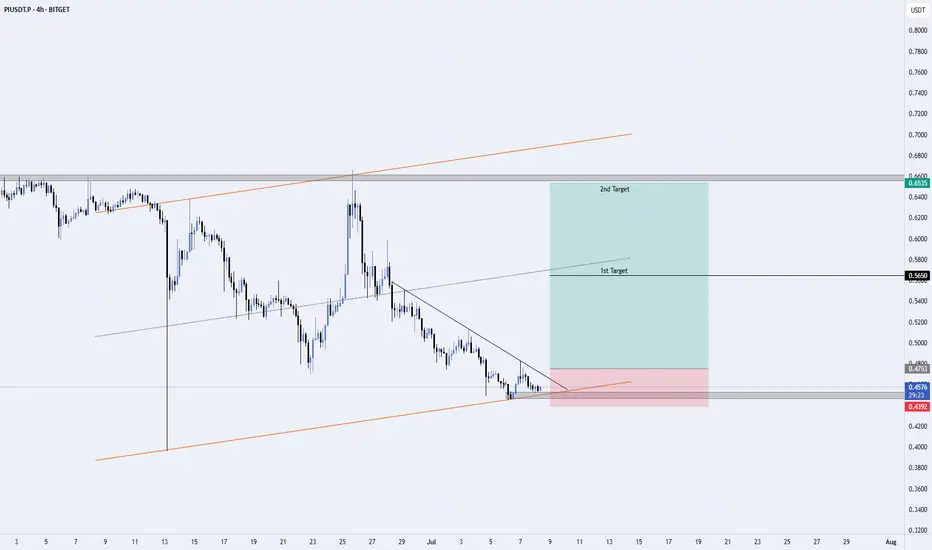
PIUSDT – Potential Long Setup from Ascending Channel Support (4HI’m watching PIUSDT closely as it approaches a significant confluence of technical levels on the 4-hour chart:
🔹 Key Highlights:
Ascending Channel Support: Price is testing the lower boundary of the channel (orange trendline).
Descending Trendline Resistance: Creating a wedge structure—breakout potential if momentum builds.
Bullish Structure: Clear rejection wicks and consolidation near support suggest accumulation.
✅ Trade Plan:
Entry Trigger: Confirmed breakout and close above the descending trendline.
Targets:
🥇 1st Target: 0.5650 (local resistance)
🥈 2nd Target: 0.6550 (major horizontal resistance)
Stop Loss: Below 0.4392 (breakdown invalidates the setup)
⚠️ Risk Management:
Always use proper position sizing and a disciplined stop loss. This setup is shared for educational purposes—do your own research before entering any trades.
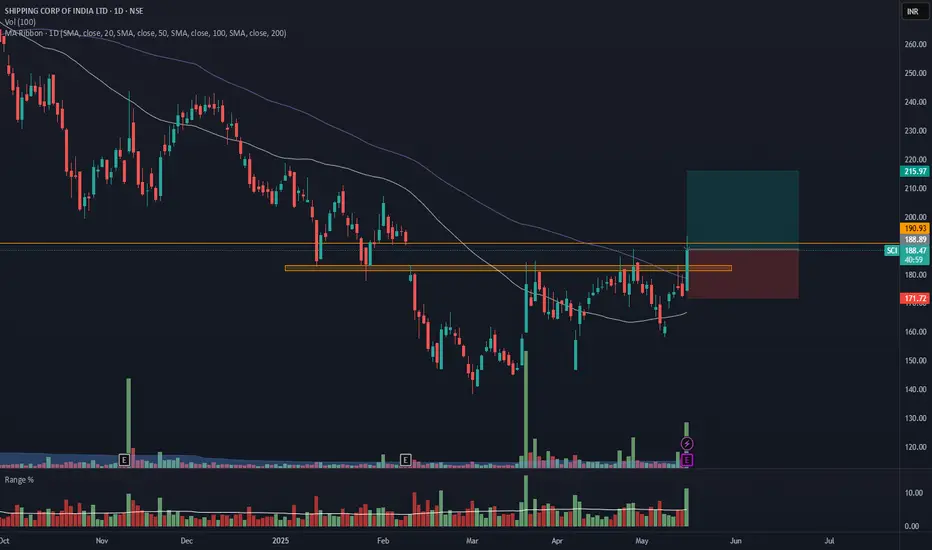
SHIPIING CONTAINERS INDIA - SCI - Breakout from DTFShipping Containers India has resistance weakening on the Daily charts and has given a breakout with good volume.
The target of this pattern signals an upside potential of 15% from the current price level in the medium term.
The stock is trading above its 50- and 100-day exponential moving averages (EMAs). The range is more than 2X, and the Volume is also 3.5X the average.
There is an old support level acting as resistance, which is why the stock won't go over 191. To be safe, wait for the closing price. If it is above 191, it's good.
CMP- Rs. 188
Target Price- Rs216 ( 15% upside)
SL - 171
Disclaimer: This is not a buy/sell recommendation. For educational purpose only. Kindly consult your financial advisor before entering a trade.
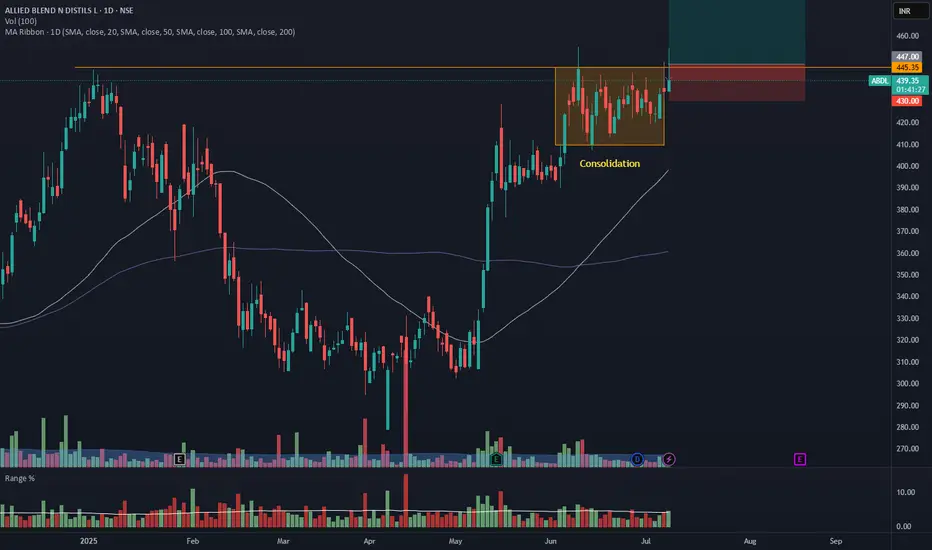
ABDL - Daily Timeframe Breakout Idea (Resistance Zone Break)Allied Blenders and Distillers Ltd. has shown a breakout above a key horizontal resistance level on the daily chart, accompanied by a nearly 2 times volume surge near the breakout zone, as seen earlier, supported by strong momentum.
🔍 Breakout Context:
- Price might break above the ~₹446 horizontal resistance, which had held for over 6 months.
The breakout zone has been supported by 2X volume and a range 1.5X of average near the resistance zone.
- The price is also trading above both the 50- and 100-day SMAs, indicating strong trend continuation.
- This aligns with a bullish continuation setup.
📉 Trade Plan:
- CMP: ₹439.15
- Entry: Near ₹446
- Target: ₹481 (~7.5% upside from CMP)
- Stop-Loss: ₹430
- Risk-Reward Ratio: ~ 1 : 2
📌 Note:
- Look for a confirmation candle to enter the trade.
- Avoid chasing the extended move unless confident in intraday momentum.
⚠️ Disclaimer: This post is for educational purposes only and not financial advice. Always do your research or consult a financial advisor before trading.
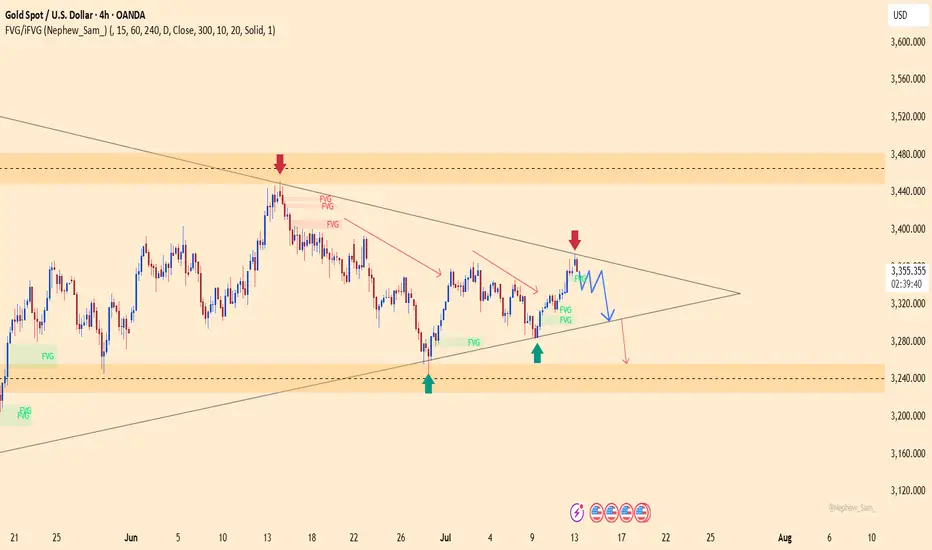
XAUUSD at risk of dropping – is gold going to fall further?XAUUSD is currently trading around 3,355, close to the resistance at 3,375. After a strong rally, gold is facing difficulty at this level and is likely to experience a correction. A symmetrical triangle pattern is forming, and if gold fails to break through the resistance, the price could drop to 3,301 or 3,255.
In terms of news, the USD and U.S. bond yields are holding steady, with stable U.S. employment data and no clear signals from the Fed on interest rate cuts. Additionally, the World Gold Council warns of a potential correction in gold if global political tensions ease or if USD and bond yields continue to rise.
Sellers are starting to take control, and if the support at 3,320 is broken, gold could fall further. Keep a close eye on the market!
EURUSD: are the bulls taking control?EURUSD is currently trading around 1.1691 and maintaining a bullish structure with consistently higher lows. On the H4 chart, a symmetrical triangle is forming, and price may break out toward the 1.1823 target if it can overcome the resistance trendline.
On the news front, the US dollar has weakened as the Fed has yet to provide a clear signal on rate cuts. Meanwhile, Eurozone economic sentiment is improving, supported by a slight uptick in manufacturing and services data. This reinforces the euro's recovery and keeps upward pressure on EURUSD.
If the 1.1660 support zone holds firm, the upcoming breakout could trigger a strong bullish move. Buyers are waiting for confirmation — are you in the game?

XAUUSD Analysis – Bearish Pressure ReturnsGold is facing renewed bearish pressure, as the H4 chart shows a failed attempt to break above the resistance FVG zone around $3,339. The overall structure remains bearish, with a likely move toward the $3,264 support zone in the coming sessions.
On the news front, recent U.S. CPI data came in stronger than expected, supporting the USD. Additionally, hawkish comments from Fed officials like Musalem, along with FOMC minutes showing no rush to cut rates, have stalled gold’s upward momentum. Meanwhile, the 10-year Treasury yield remains elevated, reducing the appeal of non-yielding assets like gold.
If XAUUSD fails to hold above the $3,300 zone, a move down toward $3,265 is highly probable in the short term.

EURUSD – Failed Breakout, Bearish Momentum Takes OverEURUSD attempted to break out of the upper edge of a consolidation triangle but was swiftly rejected around the 1.17450 region, forming a classic “failed breakout” — a pattern that often precedes strong reversals. The pair is now pulling back and appears to be heading toward the 1.16800 support zone.
On the news front, the market is under pressure from rising expectations that the Federal Reserve will maintain higher interest rates for longer, following stronger-than-expected U.S. job data. This has driven a notable recovery in the U.S. dollar, putting downward pressure on the euro. In this context, EURUSD risks a deeper correction if the 1.1700 support fails to hold. Keep a close eye on price action — this pullback could be the start of a new bearish leg.

USDJPY – Is the Downtrend Taking Shape?On the H4 chart, USDJPY shows signs of weakening as it repeatedly fails to break above the long-term descending trendline. Despite a recent recovery toward the 147.000 level, buying momentum appears to be fading. The price structure suggests the possibility of a false breakout before a reversal toward the 144.300 support zone—an area with multiple unfilled FVGs.
From a news perspective, traders are awaiting today’s upcoming U.S. CPI report. If inflation data comes in hotter than expected, the USD may gain short-term strength. However, a weaker CPI reading could trigger a quick reversal in USDJPY, confirming the bearish setup. The 147.000 level remains the critical zone to watch for any potential rejection or breakout.

HUUUUL!Best BUY at 0.5 retracement - 2393
1st Target - 2438
HUL has given weekly and daily breakout. Wait for the retracement and then go LONG.

EURUSD – Rebounding from supportEURUSD is forming a small rounded bottom after testing the support zone around 1.1670. If this level holds and price breaks above the nearby FVG area, the pair may continue its recovery toward the 1.1820 target, as shown in the projected path.
Fundamentally, the euro is supported by stronger-than-expected Eurozone retail sales and rising inflation expectations ahead of this week’s CPI data (scheduled for July 10–11). Meanwhile, the USD is under pressure due to uncertainty over U.S.–EU trade policy and a lack of clarity from U.S. trade decisions, which favors a EURUSD rebound.
As long as EURUSD holds above 1.1670, the bullish outlook remains valid. However, a break below this zone could send the pair back toward the 1.1600 area.

XAUUSD – Gold Maintains Bullish Momentum Amid Trade TensionsGold continues to respect its long-term ascending trendline that started in September 2024. After a corrective move from the $3,450 resistance zone, price has just retested the trendline near $3,060 and bounced strongly — a clear sign that buyers still control the bullish structure.
Fundamentally, gold is supported by two major factors:
The U.S.–14-nation trade conflict, with a tariff deadline set for August 1st, is fueling risk-off sentiment and driving safe-haven demand — pushing gold above $3,300.
The global de-dollarization trend and over $38 billion flowing into gold ETFs in H1 2025 are strengthening gold’s role as a USD alternative.
Looking ahead: If XAUUSD holds above the $3,060 support zone, it may head toward $3,211 and possibly $3,350. The bullish outlook remains intact as long as the trendline is respected.

EURUSD – Rebounding from Trendline, Targeting 1.18500EURUSD has bounced off the ascending trendline and key support zone around 1.16900. The price action suggests a potential continuation of the uptrend, with the next target near the 1.18500 resistance zone.
The current structure is forming higher lows, indicating bullish momentum. As long as the price holds above 1.16900, the bullish scenario remains valid.
From a fundamental perspective, the euro is supported by expectations that the ECB will keep interest rates steady, while the USD faces pressure if the upcoming FOMC minutes strike a less hawkish tone. This creates a favorable backdrop for the EURUSD uptrend.

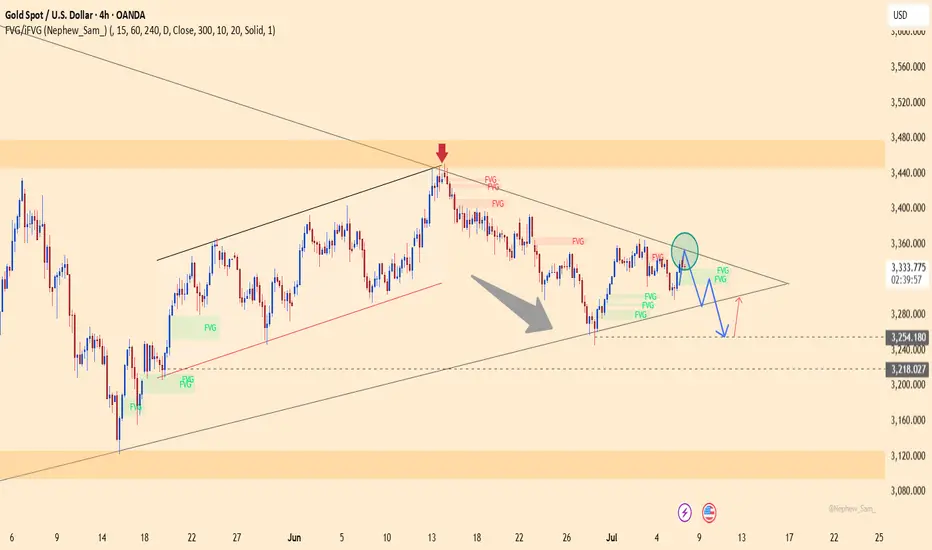
XAUUSD – Downtrend broken, bullish momentum returnsXAUUSD has broken above the descending trendline and is currently retesting the breakout zone around $3,330. If this area holds, price may continue to rise toward $3,352 and potentially $3,380.
Current price action suggests a bullish continuation pattern is forming. The bullish outlook would be invalidated if price drops below $3,255.
From a fundamental perspective, gold is supported by HSBC’s upward revision of its 2025 forecast, strong central bank demand, and rising geopolitical tensions – all reinforcing a medium-term bullish outlook.

$BTC Potential Longing OpportunityWe’ve successfully opened our previous long position at $105,398.80.
What’s next?
I’m currently eyeing the $106,335.70 – $106,716.90 range as a potential zone for the next long entry. Price may retest this area before continuing its move to the upside.
This is not financial advice. Always trade at your own risk.

Hindalco Long~ Price near resistance area of 705-715
~ BO of this area in green is what we await for.
~ Symmetrical triangle pattern BO with good volumes.
~ VCP formed and BO at 663, with 13W 3T 23/4
~ Price > 30WEMA
~ RS near 0
~ CCI > 100
~ RSI > 50
~ MACD +ve
Target 1 - 772, Target 2 - 988
SL - 618
Entry can be done post BO
This is for educational purpose only. Do your own research before investing.
