EURUSD – Rebounding from supportEURUSD is forming a small rounded bottom after testing the support zone around 1.1670. If this level holds and price breaks above the nearby FVG area, the pair may continue its recovery toward the 1.1820 target, as shown in the projected path.
Fundamentally, the euro is supported by stronger-than-expected Eurozone retail sales and rising inflation expectations ahead of this week’s CPI data (scheduled for July 10–11). Meanwhile, the USD is under pressure due to uncertainty over U.S.–EU trade policy and a lack of clarity from U.S. trade decisions, which favors a EURUSD rebound.
As long as EURUSD holds above 1.1670, the bullish outlook remains valid. However, a break below this zone could send the pair back toward the 1.1600 area.
Longsetup

XAUUSD – Gold Maintains Bullish Momentum Amid Trade TensionsGold continues to respect its long-term ascending trendline that started in September 2024. After a corrective move from the $3,450 resistance zone, price has just retested the trendline near $3,060 and bounced strongly — a clear sign that buyers still control the bullish structure.
Fundamentally, gold is supported by two major factors:
The U.S.–14-nation trade conflict, with a tariff deadline set for August 1st, is fueling risk-off sentiment and driving safe-haven demand — pushing gold above $3,300.
The global de-dollarization trend and over $38 billion flowing into gold ETFs in H1 2025 are strengthening gold’s role as a USD alternative.
Looking ahead: If XAUUSD holds above the $3,060 support zone, it may head toward $3,211 and possibly $3,350. The bullish outlook remains intact as long as the trendline is respected.

EURUSD – Rebounding from Trendline, Targeting 1.18500EURUSD has bounced off the ascending trendline and key support zone around 1.16900. The price action suggests a potential continuation of the uptrend, with the next target near the 1.18500 resistance zone.
The current structure is forming higher lows, indicating bullish momentum. As long as the price holds above 1.16900, the bullish scenario remains valid.
From a fundamental perspective, the euro is supported by expectations that the ECB will keep interest rates steady, while the USD faces pressure if the upcoming FOMC minutes strike a less hawkish tone. This creates a favorable backdrop for the EURUSD uptrend.

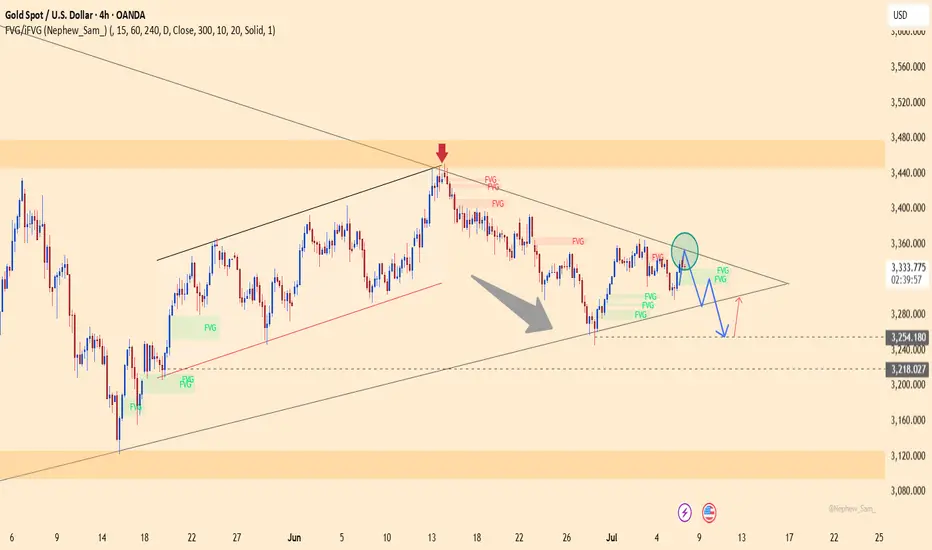
XAUUSD – Downtrend broken, bullish momentum returnsXAUUSD has broken above the descending trendline and is currently retesting the breakout zone around $3,330. If this area holds, price may continue to rise toward $3,352 and potentially $3,380.
Current price action suggests a bullish continuation pattern is forming. The bullish outlook would be invalidated if price drops below $3,255.
From a fundamental perspective, gold is supported by HSBC’s upward revision of its 2025 forecast, strong central bank demand, and rising geopolitical tensions – all reinforcing a medium-term bullish outlook.

$BTC Potential Longing OpportunityWe’ve successfully opened our previous long position at $105,398.80.
What’s next?
I’m currently eyeing the $106,335.70 – $106,716.90 range as a potential zone for the next long entry. Price may retest this area before continuing its move to the upside.
This is not financial advice. Always trade at your own risk.

Hindalco Long~ Price near resistance area of 705-715
~ BO of this area in green is what we await for.
~ Symmetrical triangle pattern BO with good volumes.
~ VCP formed and BO at 663, with 13W 3T 23/4
~ Price > 30WEMA
~ RS near 0
~ CCI > 100
~ RSI > 50
~ MACD +ve
Target 1 - 772, Target 2 - 988
SL - 618
Entry can be done post BO
This is for educational purpose only. Do your own research before investing.

BTCUSDT – Uptrend intactBitcoin continues to trade within a clear upward trend channel, with multiple Fair Value Gaps acting as strong support zones. After rebounding from the 104,960 area, price successfully retested the ascending trendline and returned to the previous accumulation zone.
Currently, BTC is consolidating near short-term resistance, but bullish momentum remains dominant. As long as price holds above 104,960, a breakout toward the extended resistance zone at 116,971 remains a likely scenario.
Trend: Bullish
Support: 104,960
Resistance: 116,971
Strategy: Favor buying on dips as long as price holds above the trendline and FVG. Nearest target around 116,971.

Kriti Industries Long📢 Kriti Industries – Bullish Alert
Kriti Industries has delivered a decisive breakout from a well-defined consolidation range, backed by rising volume and strong price structure—indicating the start of a fresh uptrend.
🔍 Price Action & Volume Signals:
✅ Tight consolidation resolved with a strong bullish candle—clear sign of accumulation.
✅ Volume expansion on breakout day shows participation by smart money.
✅ Forming a higher high–higher low structure, indicating trend reversal.
✅ No supply pressure at breakout zone—suggests strength and buyer dominance.
✅ Clean breakout above previous swing high confirms shift in momentum.

XAUUSD: Bullish Momentum Continues to BuildGold is currently trading within an ascending triangle pattern on the H1 chart, with support around the 3,322 zone and resistance near 3,359 USD. Recent price action shows strong bounces from the support line, along with a series of bullish Fair Value Gaps — indicating clear buying strength.
Fundamental factors supporting the upside:
– Weak U.S. job data lowers expectations for prolonged high interest rates from the Fed.
– The U.S. dollar is weakening due to inflation pressure and fiscal uncertainty.
– Rising geopolitical tensions and increased U.S. spending are boosting safe-haven demand for gold.
Strategy: Look for buy opportunities on a retest of the 3,322–3,326 zone. Target the 3,359 USD level, with potential for further upside if the triangle breaks to the top. Watch out for invalidation if price falls below support.

USDJPY: Weak Rebound, High Downside RiskUSDJPY remains under bearish pressure as price continues to be rejected at the descending trendline resistance. The 145.000–145.100 zone acts as a strong resistance area where price has repeatedly reversed.
The recent upward move appears to be a weak pullback, lacking the momentum to break the previous bearish structure. If price continues to be rejected at this zone, a likely correction towards the 142.100 support area is expected.

XAUUSD: Poised for a Breakout to Higher LevelsThe H1 chart shows gold moving sideways within a symmetrical triangle, with higher lows and narrowing range — a classic sign of consolidation before a potential breakout.
The lower boundary of the triangle is acting as dynamic support around the 3,334–3,336 zone. Buyers appear to be in control, pushing price up from previous Fair Value Gap zones. If price holds above 3,334 and breaks through the upper triangle resistance, the next short-term target is around 3,371.
Strategy: Favor a mild upside breakout scenario. Consider long entries if price breaks above 3,350 with volume confirmation, targeting 3,371 for take-profit.

EURUSD: Sideways Consolidation Before Directional BreakEURUSD is currently moving within a clear sideways range between 1.16400 and 1.18400, positioned just above the ascending channel line. Recent price action shows consolidation, with lower highs forming near 1.18400 while support holds firmly.
If price breaks below the range, a retest of the channel support around 1.16400 is likely. On the other hand, a bounce from current support may lead to another attempt toward the upper resistance. Traders should wait for a clear breakout signal before entering in the new trend direction.

XAUUSD: Breakout Confirms Bullish ReversalGold has successfully broken out of the descending channel after consolidating around the $3,276 area, signaling a strong return of bullish momentum. The breakout occurred precisely at a confluence of multiple Fair Value Gaps, propelling price toward the $3,357 resistance zone.
Despite a slight rebound in the US dollar, growing concerns over the US fiscal deficit and proposed tax reforms are driving investors back into gold as a safe haven. Meanwhile, US bond yields remain low, and the dollar lacks the strength to suppress gold demand.
As long as price holds above $3,320, any pullback can be seen as a buying opportunity in this newly confirmed uptrend. The next target sits around $3,357, with potential for a move toward previous highs.

Bitcoin: Ready to Break Psychological Resistance?BTC is maintaining its bullish structure with strong rebounds from the trendline since April. The price is now approaching the psychological resistance zone at 119,000 – a level that has been rejected three times before.
If support at 104,700 holds and the resistance is broken, BTC could target the 125,000 area. On the other hand, losing this support could interrupt the bullish momentum.
Trade Setup:
Buy around 104,700–106,000
TP: 119,000
SL: below 103,000
Note:
The upcoming NFP report on July 5 may trigger sharp moves if strong data boosts the USD.
Do you expect a breakout or another rejection?

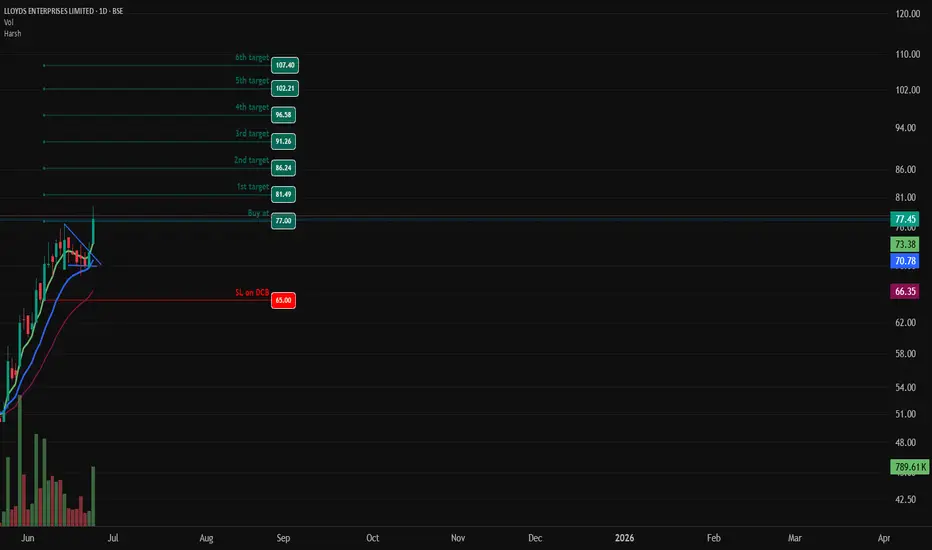
LLOYDS ENTERPRISES - Bullish Flag & Pole Breakout (Daily T/F)Trade Setup
📌 Stock: LLOYDS ENTERPRISES ( NSE:LLOYDSENT )
📌 Trend: Strong Bullish Momentum
📌 Risk-Reward Ratio: 1:3 (Favorable)
🎯 Entry Zone: ₹77.00 (Breakout Confirmation)
🛑 Stop Loss: ₹65.00(Daily Closing Basis) (-15% Risk)
🎯 Target Levels:
₹81.49
₹86.24
₹91.26
₹96.58
₹102.21
₹107.40 (Final Target)
Technical Rationale
✅ Bullish Flag & Pole Breakout - Classic bullish pattern confirming uptrend continuation
✅ Strong Momentum - Daily RSI > 60, Weekly RSI >60 Monthly rsi >60
✅ Volume Confirmation - Breakout volume 789.61K vs previous day's 197.17K (Nearly 4 times surge)
✅ Multi-Timeframe Alignment - Daily and weekly charts showing strength
Key Observations
• The breakout comes with significantly higher volume, validating strength
• Well-defined pattern with clear price & volume breakout
• Conservative stop loss at recent swing low
Trade Management Strategy
• Consider partial profit booking at each target level
• Move stop loss to breakeven after Target 1 is achieved
• Trail stop loss to protect profits as price progresses
Disclaimer ⚠️
This analysis is strictly for educational purposes and should not be construed as financial advice. Trading in equities involves substantial risk of capital loss. Past performance is not indicative of future results. Always conduct your own research, consider your risk appetite, and consult a financial advisor before making any investment decisions. The author assumes no responsibility for any trading outcomes based on this information.
What do you think? Are you watching NSE:LLOYDSENT for this breakout opportunity? Share your views in the comments!
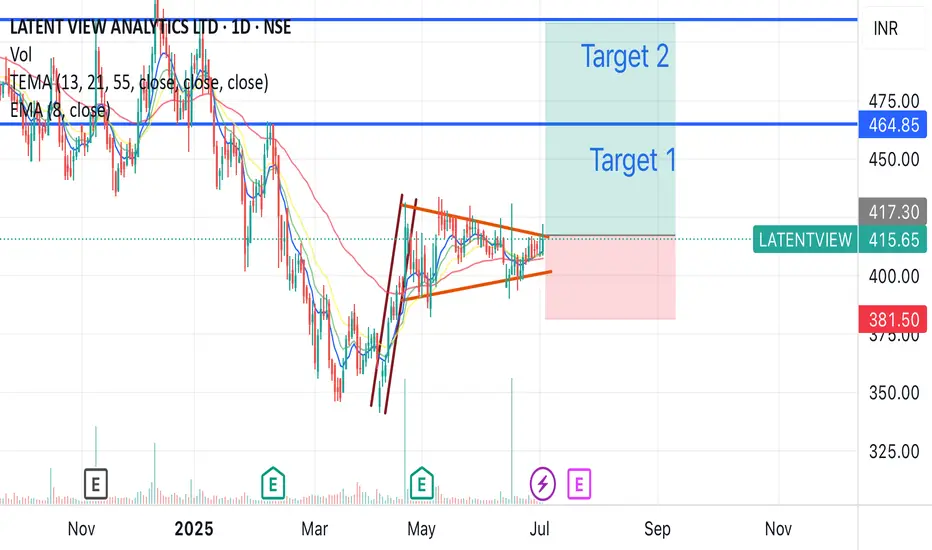
Latent view possible breakout after long consolidationLatent view might give a possible breakout as it is showing a long consolidation with flag and pole pattern, high volume was also seen a week back.
Also 55 Ema is below 8, 13, and 21 ema, which shows potential up movement
Buy around 415-420
Target - 508
Duration - 2-3 months
XAUUSD jumps 4,873 pips – Is the bullish momentum back?Yesterday, gold surged by 4,873 pips, equivalent to a $48.73 gain, signaling strong buying pressure after a technical correction. Price rebounded from Support 1 near $3,264 — a key support zone in previous sessions. The current price structure suggests a high probability of breaking above the $3,347 resistance and continuing toward the $3,389 target. Notably, the filled green FVG zone confirms the recovery and reinforces confidence in the bullish outlook.
On the news front, the de-escalation of the Iran–Israel conflict caused a brief drop in gold earlier. However, the US dollar remains at its weakest level in three years, and rising concerns over a potential budget deficit from the $3.3–3.9 trillion US tax reform package continue to support gold as a safe-haven asset.
Trade strategy: Look for long opportunities if price holds above $3,264 and clearly breaks through $3,347. The next upside target lies around the $3,389 resistance zone.

BTCUSDT – Targeting 125,000 if Resistance BreaksBTCUSDT is holding a strong uptrend, with price respecting the ascending trendline and consistently filling fair value gaps. The pair is approaching key resistance around 110,000 and may form a breakout–retest pattern, potentially unlocking a move toward 125,000.
On the news front, institutional inflows are returning, spot ETFs continue to attract capital, and the Fed is keeping rates steady — all supporting bullish momentum. As long as price holds above 101,200, the upside scenario remains in play.

CHOLAFIN- Breakout from DTFCHOLAFIN has resistance weakening on the Daily charts and has given a breakout with good volume.
The target of this pattern signals an upside potential of ~10% from the current price level in the medium term.
The stock is trading above its 50- and 100-day simple moving averages (SMAs). The range is more than >1X, and the Volume is also >1X the average.
CMP- Rs. 1628
Est. Entry price ~ 1670
Target Price- Rs1813 ( ~10% upside)
SL -1610
Note- The candle closed isn't very promising, so we have to wait for a stronger move. The promising move should be able to close above 1670.
Disclaimer: This is not a buy/sell recommendation. For educational purpose only. Kindly consult your financial advisor before entering a trade.

XAUUSD – Bearish Momentum Builds Amid Risk-On MoodGold continues to trade within a clearly defined descending channel, forming lower highs and leaving several Fair Value Gaps unfilled. After rebounding from the 3,238 USD support, price is now approaching key resistance near 3,297 USD — aligning with the main descending trendline.
If price fails to break above this resistance, a drop back toward the 3,238 USD support is likely, with a deeper target around 3,200 USD at the lower boundary of the channel.
Fundamentals currently support the bearish bias: improving US–China trade relations and rare earth agreements have triggered “risk-on” sentiment, pulling capital away from gold. Meanwhile, strong USD momentum is driven by robust Core PCE data and the Fed’s hawkish stance, showing no rush to cut rates.
Strategy outlook: Watch for price reaction at 3,297 USD. If bearish rejection occurs, short setups toward 3,238 USD and below could be considered.

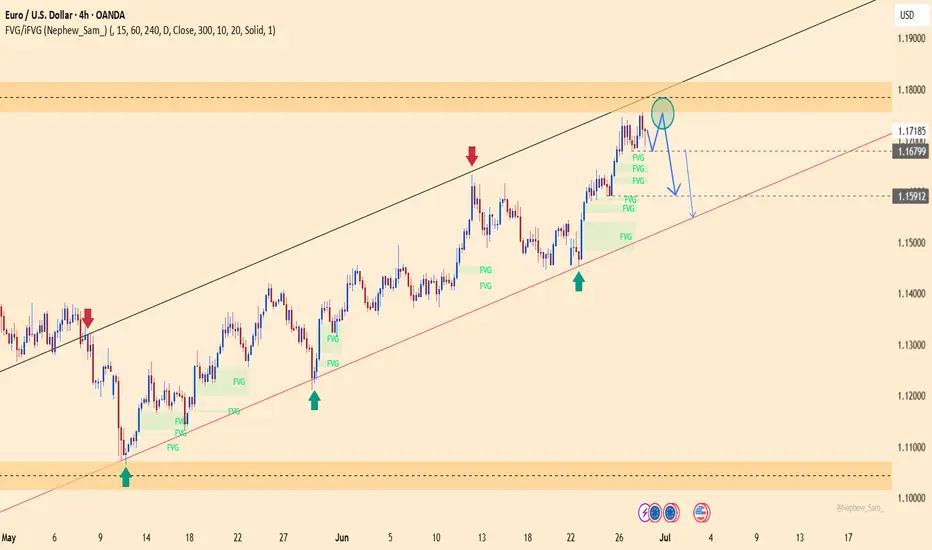
EURUSD – Bearish Pressure Resumes After Rejection at 1.17500EURUSD has rejected the 1.17500 resistance zone and is now forming lower highs on the H4 chart, signaling weakening bullish momentum within the ascending channel.
Stronger-than-expected Core PCE data from the US reinforces the Fed’s cautious stance, keeping the USD strong. Meanwhile, political rumors about Trump potentially replacing Powell have triggered market volatility but still support the dollar in the short term.
As long as price fails to break above 1.17500, EURUSD is likely to decline toward the 1.15900 zone. A bullish scenario would only be validated if price closes above 1.1760.
XAUUSD – Bearish Pressure Intensifies, New Lows in SightGold remains firmly within a well-defined descending channel, consistently forming lower highs and lower lows. After a breakout of the minor channel, price appears to be pulling back toward the 3,300 zone before potentially resuming its downtrend.
The temporary ceasefire between Iran and Israel and the US–China rare earth trade deal have dampened safe-haven demand, with capital rotating back into equities. At the same time, stable core PCE data supports the USD, adding further pressure on gold.
If price fails to hold above the 3,260 area, the next target lies near 3,218.
