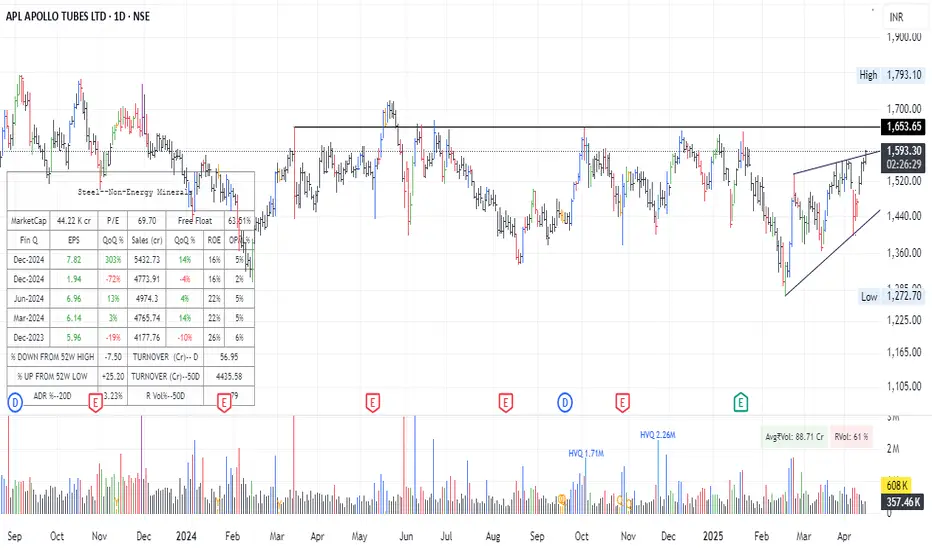
Apl Apollo Tube - ReRating Candidate !!??Stock peaked in Sep 2023.. Has been Range bound since almost 2 yrs now.. Interestingly had the best quarter ever last qtr.. Margins are stable and constant through many months.. If margins expand we are looking at a re-rating candidate.. Over all looking very interesting..
Longsetup
HCLTECH-INTRADAY-LONGStock is forming Ascending tringle in 1hr chart. Good opportunity to go long if it opens flat.
Ignore if it opens below 1405, if gap up wait for retest at 1426.
Please don't forget click on follow button so you won't miss any upcoming ideas.
Any confusion, feel free to drop msg. Happy to help :)
This is only for educational purpose, please manage your risk accordingly.

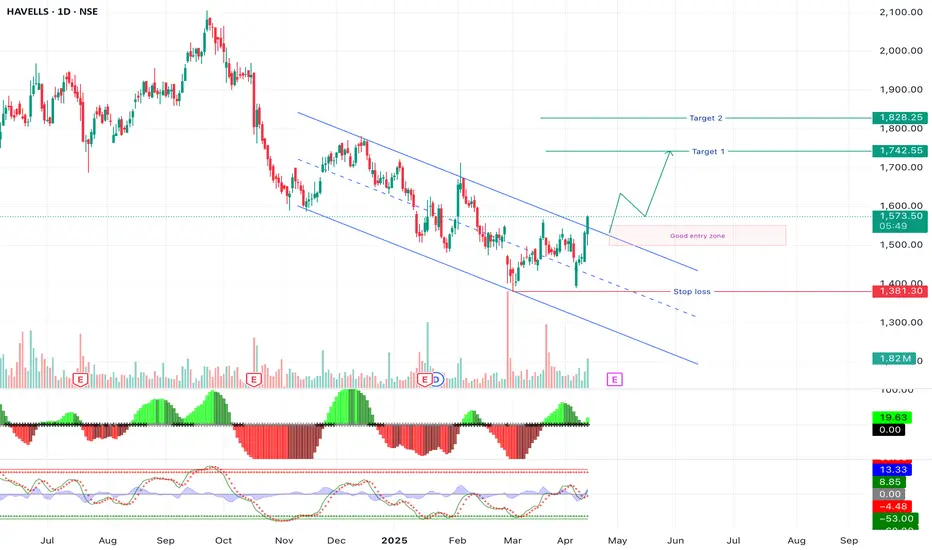
Havells Long l Swing Moving out of channel
Volume greater than average volume
Making higher high, change of character
Can wait for some reversal for better risk rewards
Targets and SL as given in the chart
ULTRACEMCO-4hr/1day Long tradeThe stock has corrected within the recent fall and fully recovered. Almost trading near ATH.
Current high has tested multiple times.
On next trading session it has to open above 11400 good opportunity for long, if gap down avoid.
Any confusion, feel free to drop msg. Happy to help :)
This is only for educational purpose, please manage your risk accordingly.

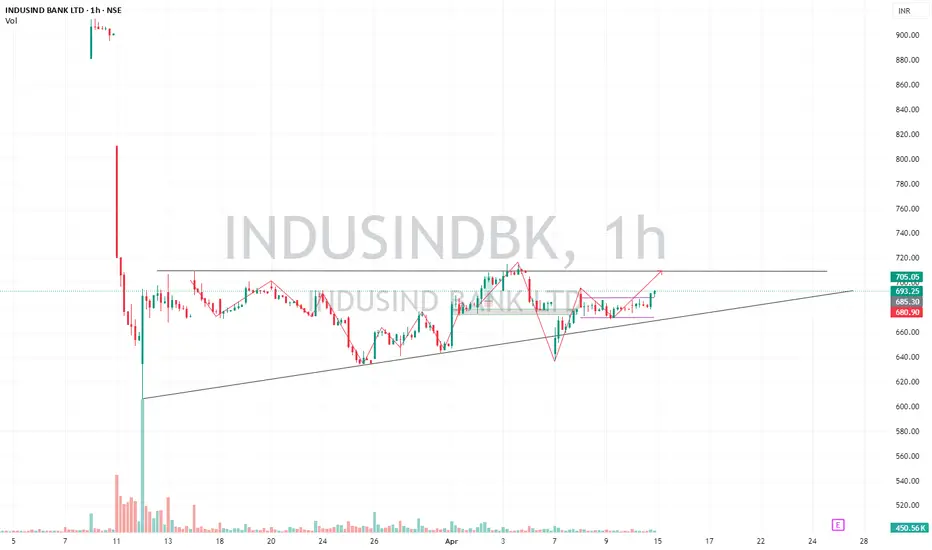
INDUSINDBK-Intraday/short term positional After the big fall, stock is consolidating from last month.
It has formed Ascending tringle pattern. From past 2 days i.e. 8th and 9th April 2025. It is trading in range. which states that buyers are accumulating.
It has potential to move if it opens between 692-700. It may go sideways for one more day it is a good opportunity for Long Intraday/short term positional trade.
If it opens 666, avoid.
Any confusion, feel free to drop msg. Happy to help :)
This is only for educational purpose, please manage your risk accordingly.
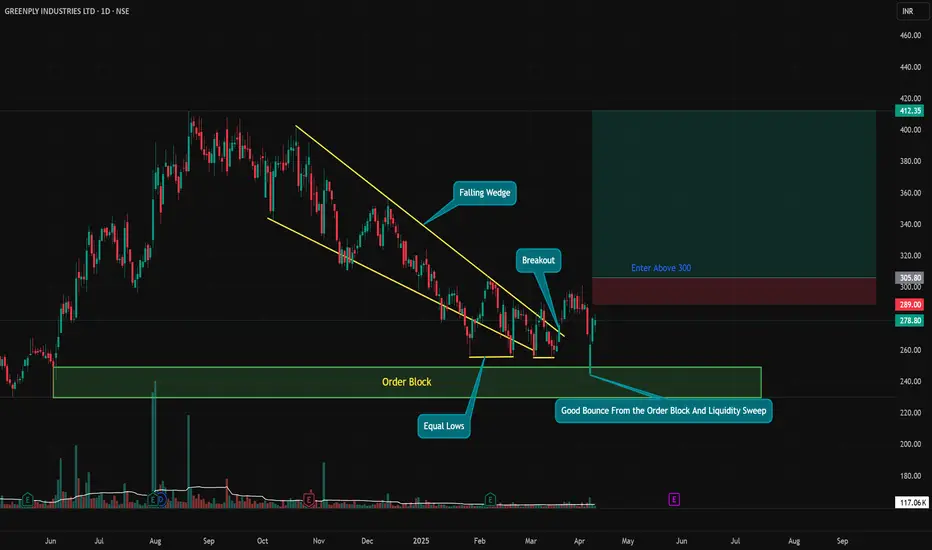
GREENPLY – Ready for a Major Reversal?Falling Wedge + Smart Money Confluence!
Conviction Level: High | Setup Type: Reversal + Breakout Play | Strategy: Price Action + Smart Money Concepts
After months of a controlled downtrend, GREENPLY has just completed a Falling Wedge – a classic reversal pattern. But that’s just the start.
Here’s why this setup stands out:
🔰 Price tapped into a Higher Timeframe Order Block – the same zone that acted as a strong demand area in the past.
🟢 Liquidity Sweep below Equal Lows – a textbook smart money move to trap sellers and trigger institutional buy orders.
💥 Breakout with Strong Bullish Candles – confirming buyers stepping in with confidence.
📊 Analyst Ratings show strong buy sentiment, supporting the technical bias.
🎯 Clean Entry Plan: Above ₹300, with ample risk-to-reward up to the ₹410+ zone.
This isn't just a chart play — this is a confluence of price action, liquidity engineering, and smart money footprint. If the breakout sustains, this could very well be the start of a major trend reversal.
🧠 Patience is key. Let price confirm the move above 300 before entering. Risk management remains the king.
Maha Apex - Very Low-Risk setupThe stock price has come to its half in the last 6 months.
This time comes to a crucial low level at multiple support, as seen on the chart.
If it reverses from these levels, it can be a good trade setup with a small risk and big rewards.
The projected targets may be 130/160 or even more.
One has to keep the position size in accordance with the risk management.
All these illustrations are only for learning and sharing purposes, not a buy or sell recommendation.
All the best for your trading journey.

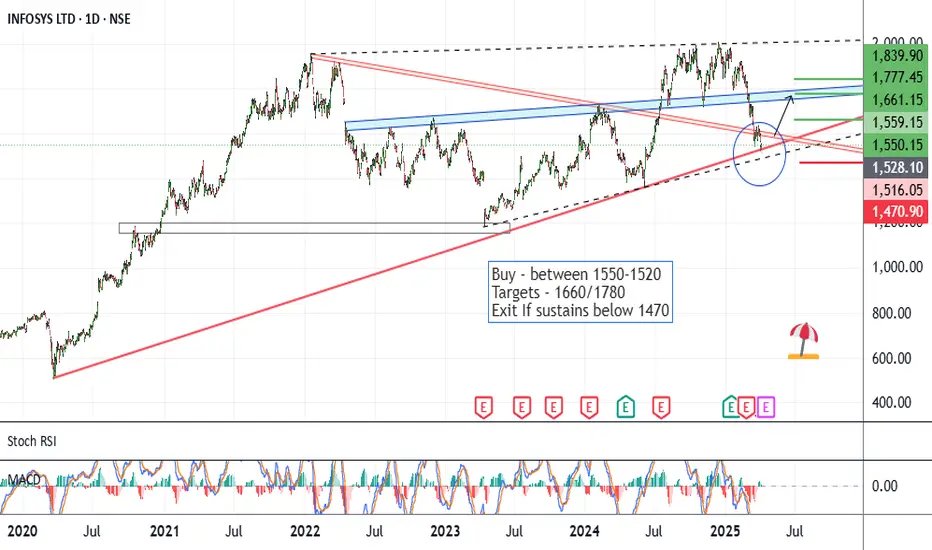
Infy - Long SetupCMP 1550 on 03.04.25
The chart marks all the important levels. The stock price has corrected by around 25% in recent weeks. According to the above setup, it seems to be on the supports.
If it reverses from these levels, it may go into a bullish phase ahead. Possible targets may be 1660/1780/1840.
The setup will lose significance if the price sustains below 1470.
One should keep the position size according to risk management.
All these illustrations are only for learning and sharing purposes, not a trading recommendation.
All the best.
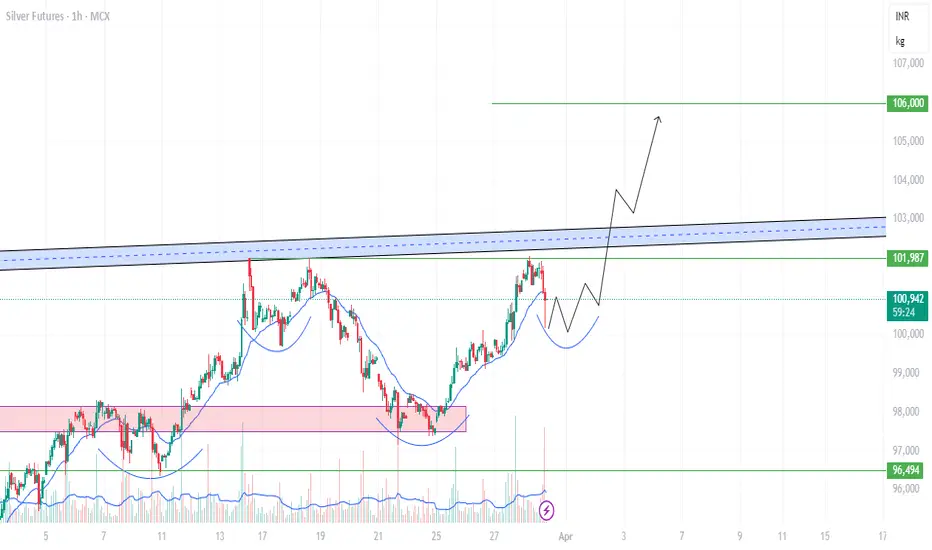
Inverse Head and Shoulder pattern In Silver ? New high Soon?chart shows an Inverse Head and Shoulders pattern in Silver Futures on the 1-hour timeframe.
The neckline (resistance) is marked by the blue zone, which, if broken with strong volume, could confirm a bullish breakout. The projected price movement (black arrow) suggests a potential rally toward ₹106,000.
A confirmation would come if the price breaks above the ₹101,987 - ₹103,000 resistance zone with volume.
Place SL below the right shoulder (~₹100,000) for a safe trade.
WABAG | Reversal Swing CandidateStock has corrected and now looked like formed base. Probably reversing from here.
Forming higher high Higher low
RSI is strong
Taking support on ema at daily level
Fundamentals are good.
Good for swing and long term.
SL and target for swing as given chart.

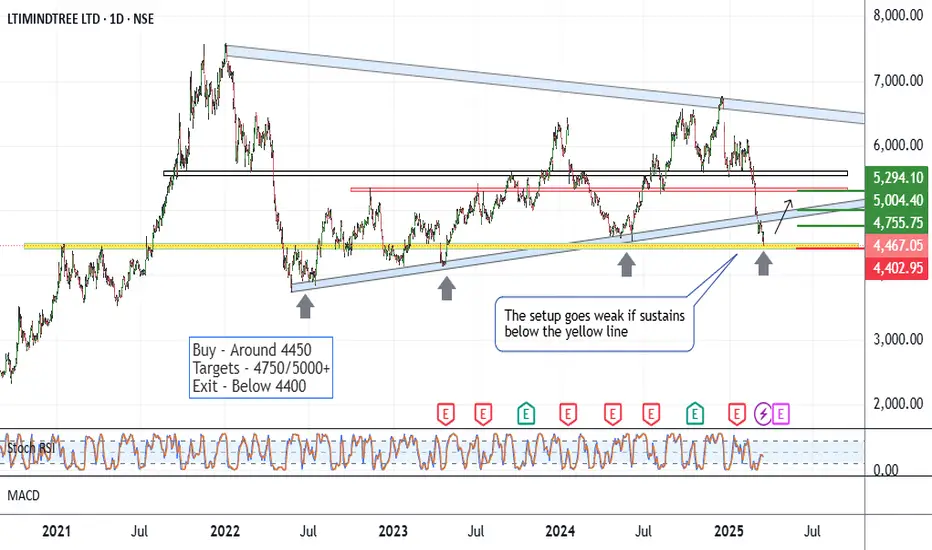
LTIM - Low Risk IdeaCMP 4467 on 16.03.25
The chart shows all the critical levels. The price has corrected around 30% in recent weeks. At this moment, it is on support, as seen in the chart.
Considering a possible reversal from the current levels gives an idea of buying with a small risk.
Possible targets may be 4750/5000 and even more, depending on the index movement ahead.
The setup goes weak if the price sustains below 4400 for a couple of days. In given conditions, the strategy should include Hedging tools for better coverage.
All these illustrations are only for learning and sharing purposes, not a buy or sell advice in any case. I am not a registered analyst.
Before entering a trade, be ready to take a loss on what you have decided.
All the best.
A very good buying opportunity in pi network coin.PI coin is in a very good demand zone in daily time frame. Legout of the demand zone is very good. We can target 2.8 level in pi which is a supply zone. Trade has good risk to reward ratio of 1:4. Follow risk management

Pcbl Chemical – Supply Turned Demand, Higher Lows & Breakout Set📊 Stock: PCBL CHEMICAL LTD (NSE) – 1W Chart
📈 Bullish Structure Developing!
Supply turned into demand! Initially, the stock faced a strong supply zone, leading to a correction and consolidation.
Breakout & Sustained Move – After breaking out, the stock sustained above the breakout level for a long period, confirming demand at this zone.
Higher Lows Formation – A classic bullish structure is developing, indicating accumulation.
CT Base Breakout Approaching – The stock is breaking out of a contraction phase, which could lead to further upside.
Volume is a concern, but price action remains strong. A volume pickup could fuel a stronger move! 🚀
💬 What’s your take on this setup? Are you tracking PCBL? Drop your thoughts below! ⬇️

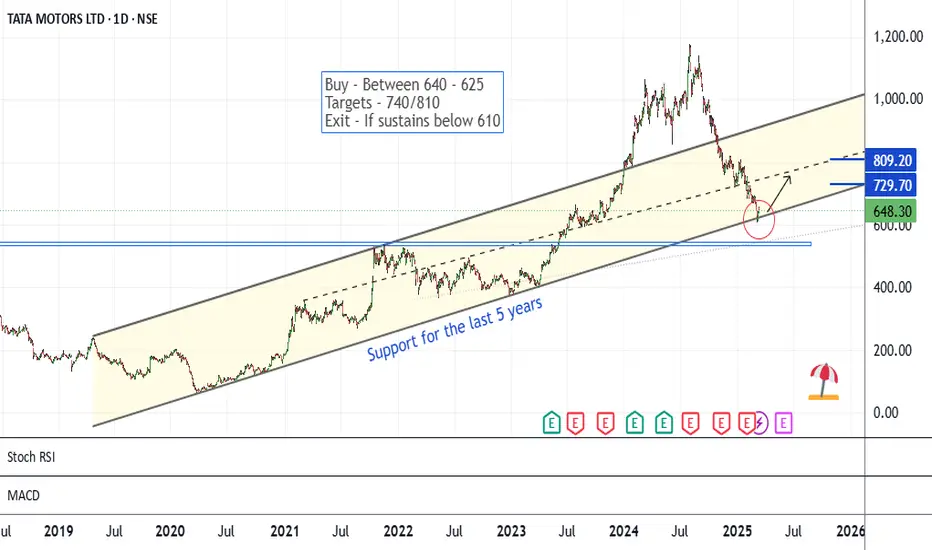
Tata Motors - Simple Long SetupThe chart is self-explanatory. The price has been travelling in a higher high-higher low pattern for the last 5 years. This time comes to the lower levels.
In the recent 5-6 sessions, it has shown a bounce back.
If momentum continues, a bullish move may be seen ahead.
The risk-reward ratio is quite good for positional trading at these levels.
If it sustains below 610 levels on a closing basis for 2-3 days, the setup will lose significance.
All these illustrations are only for learning and sharing purposes; it is not a buy or sell recommendation.
All the best.
Bulls are coming back | Which type of setups to trade ?I make educational content videos for swing / positional trading

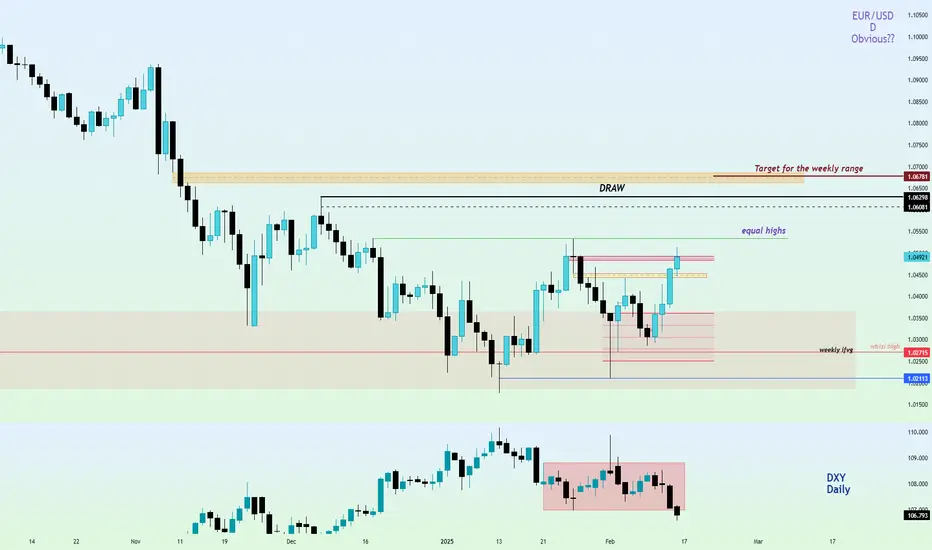
Fibre/EURUSD ready to move higher...Hello traders!
There is so much on the Daily chart of Fibre that points to obvious bullishness of the market that I could not place all of it on the chart. But I have marked what seemed crucial to be seen.
Market has taken smooth lows of 15th, 16th, 17th, & 20th January, 2025 and strongly rejected from 1.02113 . Also, observe how 20th January's daily candle shifted the market structure . We're inside a Bullish breaker on the daily, supported by a daily ifvg (check how the market has respected the consequent encroachment of that gap perfectly).
Things don't end here. DXY has broken the range to the downside with lower draws. Market symmetry is currently missing but Fibre should follow DXY soon.
The draw and the targets for the weekly range have been marked on the chart. Equal highs is the low hanging fruit.
Narrative is paramount when it comes to applying ICT concepts. That takes a lot of practice and time. Having said that, let's discuss when this idea will be marked as failed. 3 PDAs. If 3 PDAs fail on the daily timeframe, I'll not engage the market and wait for more feedback from the market.
Have a wonderful and learning-oriented week.
GLGT.
BTC LONG SETUPBTC will fill FVG at 85,500 before it pumps to the 98K zone.
Also, the Friday White House Crypto Summit on Friday is even slightly positive.
Buckle up for LONG!

Gold: Buyers pause above $2,900 amid risk aversion concernsGold is maintaining its bullish momentum for the second consecutive day above $2,900 on Wednesday morning, as buyers take a breather ahead of the crucial ADP employment report in the US. This data could provide fresh insights into the Federal Reserve’s next interest rate move. Meanwhile, risk aversion sentiment fueled by concerns over a trade war may help limit gold’s downside potential.
At the same time, XAU/USD has held above the $2,900 level but retreated slightly from the intraday high of $2,927.91. The daily chart shows that gold has been on an upward trajectory for the second consecutive session, though another strong rally remains uncertain. In the short term, gold appears to be correcting overbought conditions.
Key Levels to Watch
Support levels: $2,894, $2,876
Resistance levels: $2,927, $2,941, $2,956

Max Financial - Low Risk SetupCMP 1032 on 20.02.25
It is clear from the chart that the stock price has been rising in a parallel channel in recent sessions. Right now it is at the bottom of the channel.
If gives a bounceback, may go into a bullish phase again.
The risk-reward ratio seems good at the moment.
The setup remains active when the price sustains inside the parallel channel.
Plz keep the position size according to the risk management.
All the above illustration is my own view. Shared only for learning purposes. It is not a trading recommendation in any form.
All the best.

USDJPY running for buystops... Hello traders!
One of the models I use got triggered on the 1h timeframe once the breaker failed. Expected draw and everything else mentioned on the chart pretty clearly.
I expect the market to reach the buystops resting at 150.739 , and expect the market to tap into the daily ifvg and the daily sibi .
For the daily -ifvg to act as proper inversion, I don't expect teh market to trade above the CE of the gap and hence the expected target of 150.810 .
Not financial advice.
GLGT.

BEML - Confluence of Supports Suggests a Potential Reversal!The weekly chart of BEML indicates a potential reversal as the stock approaches a critical confluence of support levels. After a significant correction from its all-time high, the price is now testing key technical levels that could act as a strong base for a bullish reversal.
Key Observations:
1. 200-Week EMA Support:
- The price is currently hovering near the 200-week EMA, which has historically acted as a strong dynamic support zone in trending markets.
2. Fibonacci Retracement:
- The stock is approaching the 0.618 Fibonacci retracement level, which is widely regarded as a golden ratio for potential reversals during corrections.
3. Potential Bullish Reversal:
- If the stock holds above this critical support zone, it could initiate a reversal toward higher levels.
---
Let me know your thoughts in the comments! #BEML #TechnicalAnalysis #SwingTrading"
---
Disclaimer:
This analysis is for informational and educational purposes only and does not constitute financial advice. Trading involves risk, and past performance is not indicative of future results. Always conduct your own research and consult with a qualified financial advisor before making any investment decisions.

Bajaj Finance - Breakout Confirmed! Heading Toward ₹11,850?Bajaj Finance (BAJFINANCE) has broken out of its multi-year consolidation range with strong momentum. The ascending trendline and breakout suggest a bullish continuation toward ₹11,850. Watch for pullbacks to enter long positions.
Key Observations:
1. Ascending Trendline Support:
- The stock has consistently respected the ascending trendline since 2021, with multiple bounces (marked by green arrows), indicating strong bullish momentum.
2. Breakout Above Resistance:
- After consolidating between for nearly two years, the price has finally broken above the resistance zone, confirming a bullish breakout.
3. Upside Potential:
- Based on the height of the previous consolidation range, the breakout target is projected at ₹11,850.
5. Strong Base Support:
- The ₹6,500–₹7,000 zone remains a strong support area in case of any pullbacks.
---
Disclaimer:
This analysis is for informational and educational purposes only and does not constitute financial advice. Trading involves risk, and past performance is not indicative of future results. Always conduct your own research and consult with a qualified financial advisor before making any investment decisions.*

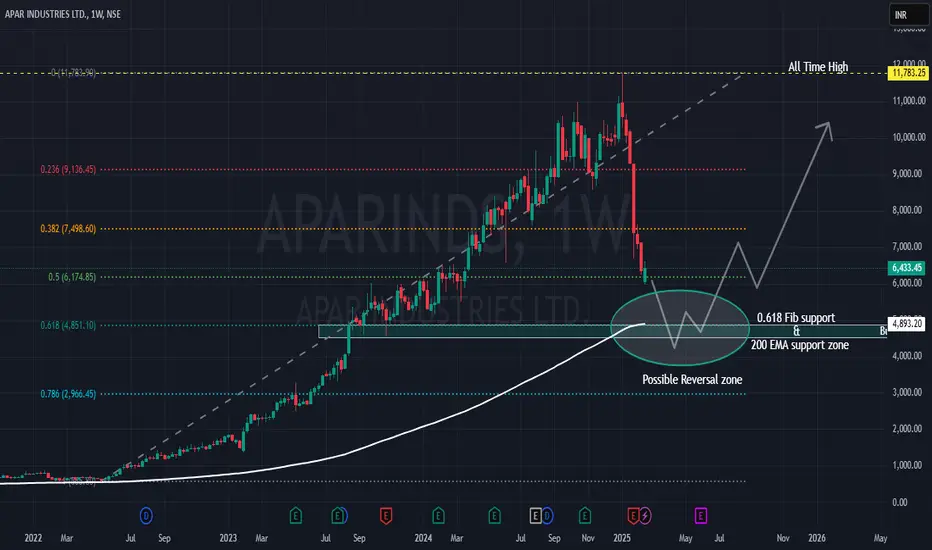
APARINDS - Fibonacci & EMA Confluence: A Reversal Opportunity?The weekly chart of *APAR Industries (APARINDS) suggests a potential reversal setup as the price approaches a critical confluence of support zones. After a strong upward rally, the stock is undergoing a healthy correction, which could provide an opportunity for long-term investors or swing traders.
Key Observations:
1. Fibonacci Retracement Support:
- The price is nearing the 0.618 Fibonacci retracement level, a key level often respected in trending markets.
2. 200-Week EMA Support:
- The 200-week EMA aligns closely with the Fibonacci level, adding further strength to this zone as potential support.
3. Reversal Zone Highlighted:
- The green rectangle zone marks the support zone suggesting a high probability of reversal.
So, APAR Industries (APARINDS) is approaching a critical support zone defined by the confluence of the 0.618 Fibonacci retracement and the 200-week EMA. This area has historically acted as strong support and could provide an excellent opportunity for long trades if bullish signals emerge. Let me know your thoughts in the comments! #APARINDS #TechnicalAnalysis #SwingTrading"
---
Disclaimer:
This analysis is for informational and educational purposes only and does not constitute financial advice. Trading and investing involve significant risk of loss. Always conduct your own research and consult with a qualified financial advisor before making any investment decisions.