DRAGONFLY LTDDRAGONFLY INC, as per chart view it formed FALLING WEDGE PATTERN and made breakout with entry level $6.88 with EMA crossover. We can expect the Final target to $13.
Longsetup

Gold Futures – Bounce from 4203 Support Could Extend Toward 4270Hi Everyone
Gold futures have already tested the 4203 support level and are now pushing upward. This bounce increases the probability of continuation toward the 4270 resistance zone in the next coming hours.

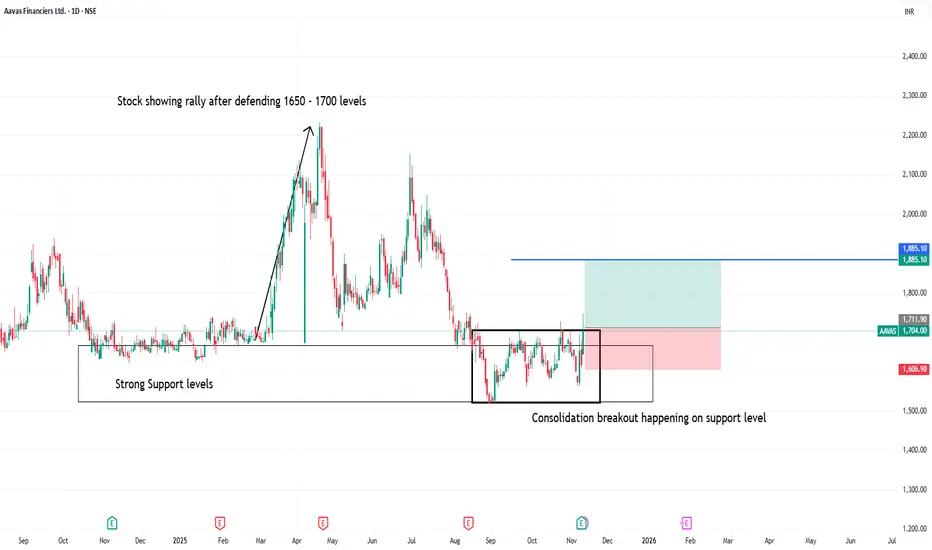
Consolidation breakout happening on support level in aavas fin1. Stock has been showing strength on 1700 levels buyers accumulating and taking further as shown on previous support
2. On same levels now consolidation has happened and soon stock may give nice breakout with great R:R
3. Usually range in consolidation will be its target after breakout
for ex:
if range is of 100 points in consolidation then target will be of 100 points
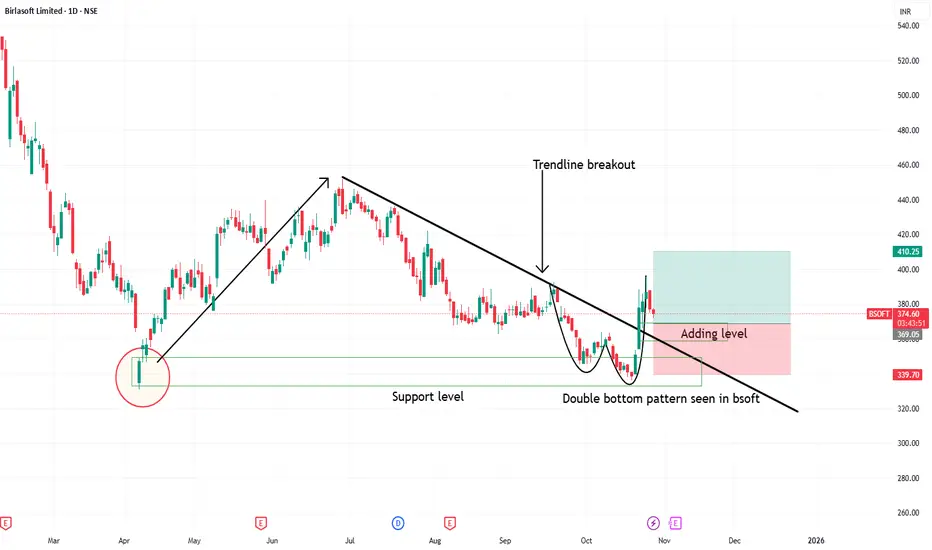
Double bottom in BSOFT1. Double bottom seen on support level
2. Trendline breakout seen with double bottom
3. Good fundamental stock can see upside movement in upcoming weeks
2170 a Good Longterm Buy for COLPAL?Colgate-Palmolive (India) has been under pressure due to consecutive quarters of subdued earnings, resulting in loss of upward momentum and a gradual slide within a well-defined descending parallel channel. However, technical indicators now point toward a potential trend reversal.
The stock is breaking out of this bearish channel and has repeatedly defended the crucial ₹2170 support zone, a level it briefly breached on 13th August 2025 but failed to sustain below.
Currently trading around the 0.618 Fibonacci retracement of its entire previous upmove, COLPAL appears to be forming a significant base. With the next earnings due on 22nd January 2026 acting as a potential catalyst, long-term investors may consider this correction as a compelling accumulation opportunity in a structurally strong FMCG heavyweight.
While near term earnings volatility cannot be ruled out, the confluence of strong structural support at ₹2170, channel breakout, and golden-ratio retracement makes COLPAL one of the more promising defensive long-term ideas in the current market.
Traders should watch for a sustained move above the channel resistance (≈ ₹2300 – ₹2350) for confirmation, but patient investors can initiate long positions near ₹2170 – ₹2200, keeping the August 2025 low as a logical stop loss, betting on mean reversion in a high quality consumer staple name.

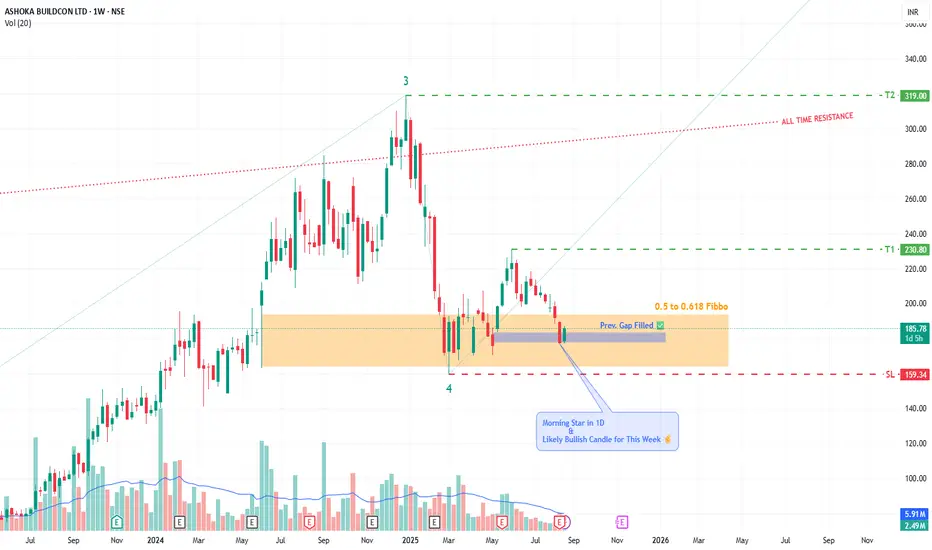
VIEW ON ASHOKA BUILDCON BY KRS CHARTSDate - 21st August 2025 / 10:35 AM
Why ASHOKA ?
1. All-time Bullish Stock technically making HHs & HLs.
2. Further, Price is already in Fibbo Golden Reversal Zone for quite a few times and showing bullish traits again.
3. I was eagerly waiting for to retrace down little bit for 1D previous gap-up needed to be filled it & it's Done!
4. 1D it is showing Morning Star Candle sticks Cluster s with more green Candles and this week likely to be closing with bullish candle stick.
5. Wave Theory wise we are in 4th Wave last upside 5th is loading.
All in All, this is good level to look ASHOKA as a good opportunity 👍✅
Targets and SL are Marked in Chart.
XRPUSDT – 4H | Channel Rejection + Re-Test | High RR Long SetupXRP is respecting a long-term descending channel, and the recent price action shows a strong bullish reaction from the lower boundary of the channel. After sweeping liquidity at the lows, price has broken back above the inner trendline and is now retesting it as support.
🔍 Key Technical Points
Price bounced from the channel bottom, showing buyer strength.
Clear break and retest of the minor descending trendline.
Price holding above the retest zone (grey demand area).
Targeting the upper channel resistance + higher-timeframe supply zone.
Attractive Risk-to-Reward setup if the retest holds.
📈 Long Setup
Entry: Around 2.20 – 2.22
SL: Below 2.06 (structure invalidation)
TP: 2.65 – 2.70 zone
R:R: ~4.5R (High reward potential)
📌 Why I Like This Setup
This setup aligns with:
Trendline confluence
Demand zone reaction
Clear momentum shift
Liquidity grab at the lows
Room to move higher towards channel top
If bulls hold the retest, XRP could push toward the 2.65–2.70 target area.
⚠️ Disclaimer
This is only my personal analysis and not financial advice. Always trade with proper risk management.

TRIANGLE BREAKOUT IN POLYMED!!DISCLAIMER : This idea is NOT a trade recommendation, but only my observation. Please take trades based on your own analysis
Following points to be noted:
1. Price broken out of a descending triangle.
2. Price has also taken support from a higher TF demand zone.
3. Triangle breakouts from such oversold zones have a higher probability of success.
4. Targets are the pattern height of the consolidation structure itself.
The following trade can be initiated:
Entry - CMP, Tgt- 2400, SL - 1790, RR - 1:2.2

Perfect Short & Long Swing Example | ABLBL 1. Short-Term Swing Trade (Short Swing)
✔ Reason:
The stock repeatedly bounces between support and trendline resistance, creating a tight swing range.
Key Points Visible in Chart:
Strong support around ₹122–124
Clear falling trendline around ₹132–135
Price touched bottom → bounced → heading toward trendline
MACD shows early green ticks
RSI recovering from oversold
Short Swing Meaning:
Buy near support
Sell near trendline resistance
Example from Chart:
Entry: ₹124–126
Target: ₹132–135
Profit window: 5–7%, achievable in 3–10 days
This is what you highlighted as “short swing” — quick bounce trade.
2. Long Swing Trade (Bigger Move / Trend Breakout)
✔ Reason:
The stock is inside a large wedge/channel, and the price is at the lower trendline, signalling potential bigger trend reversal.
Key Points:
Long-term trendline pointing upward
Multiple swing lows forming higher bottoms
Potential breakout above the falling blue trendline
If breakout happens → rally toward ₹150–155 becomes likely
Strong bullish structure visible
Long Swing Meaning:
Buy near major trendline support
Hold until it reaches upper trendline
Example from Chart:
Entry: ₹124–128
Target: ₹150–155
Potential gain: 18–22%
Time: 3–8 weeks
This is what you marked as “long swing.”
Note:
This analysis is for educational purposes only. It is not a buy/sell recommendation. Always do your own research and manage risk before trading.

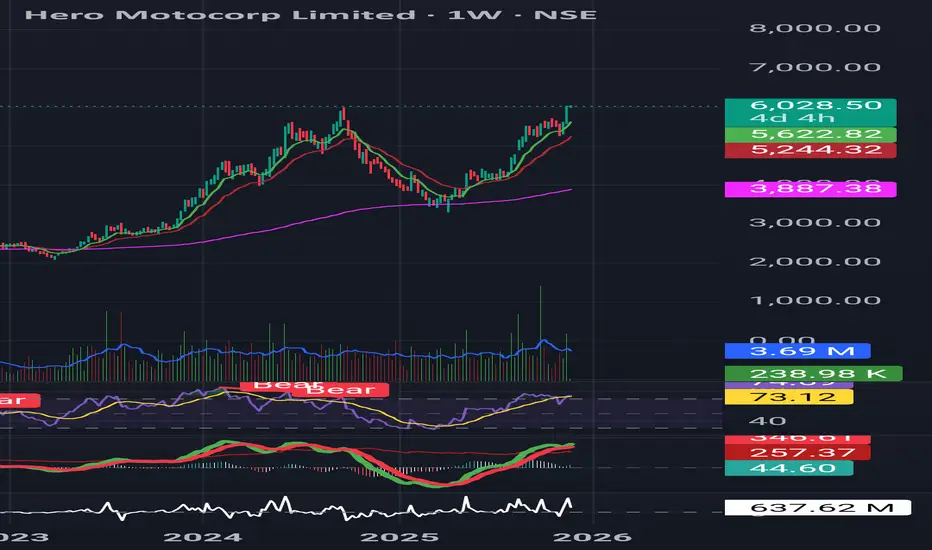
Hero MotoCorp — Saucer Continuation Pattern DevelopingHero MotoCorp is forming a saucer continuation structure on both daily and weekly charts.
Price is retesting the breakout zone around ₹6040 with low volume and small-bodied candles — a healthy momentum pause.
What’s strong:
• Trend intact (9/21/200 EMA rising)
• MACD bullish
• RSI holding strong despite flattening
• EFI above zero → buying pressure intact
• Weekly timeframe supports the same setup
Trade Plan:
• Entry: Close above ₹6040 with 2× volume
• SL: ₹5918 (ATR-based)
• Targets: ₹6442 → ₹6744
Trend remains bullish as long as price holds above 9/21 EMA.
BHEL: Long Setup OnThe stock of Bharat Heavy Electricals Limited (BHEL) recently tested a significant resistance level near ₹265 and has since begun a retracement phase. Current price action suggests a pullback toward a demand zone around ₹278 , which may act as a short-term support area.
The initial resistance at ₹265 served as a barrier to further upside, prompting the current retracement. The previous resistance level may now function as a support zone, a common occurrence when price breaks above and then retests prior resistance.
If the stock resumes its upward trajectory after consolidating near the demand zone, the next major resistance is projected around ₹321 , based on historical price action and chart structure.
The area near ₹278 is being monitored as a potential demand zone, where buying interest could emerge to support the price.
Immediate Support: ₹265
Demand Zone: Around ₹278
Next Resistance: ₹321
Disclaimer: This analysis is provided for educational and informational purposes only. It does not constitute investment advice or a recommendation to buy, sell, or hold any financial instrument. Market conditions can change rapidly; traders should conduct their own research or consult a licensed financial advisor before making any decisions.

Consolidation happening in BBTC (Bombay burmah trading)1. is having consolidation pattern between 1750 - 2100 levels
2. One can watch for breakout above 2100 with good Risk : Reward
3. stock has give strong results attracting buyers and accumulation seen at 1850 levels
with strong buyer coming taking stock to 2050 levels in single day
4. stock may test its all time high if breaches 2400 levels

PGEL LONGAfter a good PGEL has been consolidating for 5 Months now. It may now come out of consolidation. Check the chart for the breakout level.
Entry- 580-586
Target- 640, 660, 680
SL- 550.
Disclaimer- This is just for educational purpose only.
JAI SHREE RAM.

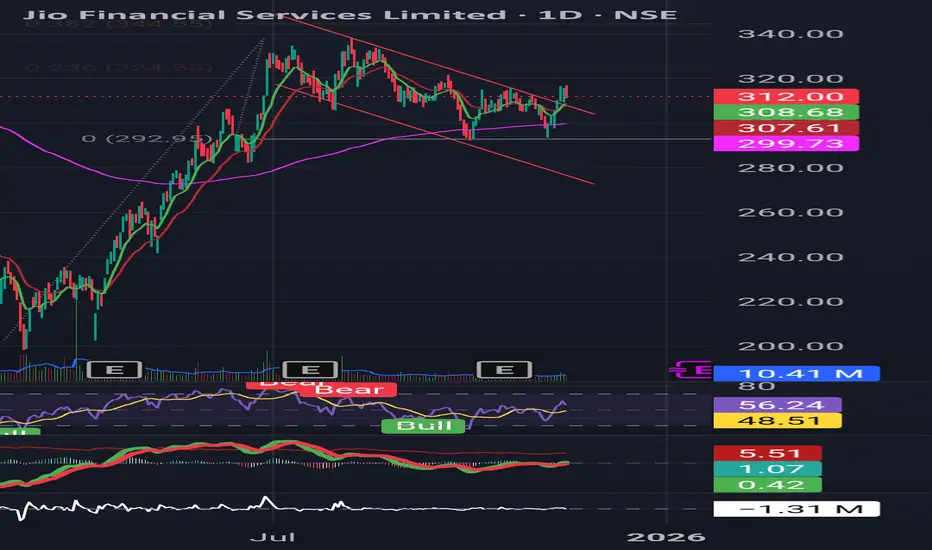
Jio Financial – Breakout Base Forming | Momentum Rebuilding
Structure
Price forming a clean ascending triangle with horizontal resistance near ₹285–289.
Higher lows forming consistently → accumulation behaviour visible.
Trend & Momentum
Trading above 21 EMA and 200 EMA, trend supportive.
RSI holding above 55, bull-range intact.
MACD flattening & attempting a positive crossover.
Volume
Contraction during consolidation → typical pre-breakout behaviour.
Key Levels
Breakout Trigger: Close above ₹289
Supports: ₹270 → ₹263
Invalidation: Close below ₹263
Bias
Bullish above breakout zone
Monitoring for volume expansion and strong close.
“Nifty Auto: Flagging Before the Next Leg?”Nifty Auto – Flagging After a Major Reversal
Big inverted Head & Shoulders completed on Nifty Auto with breakout above ~24,200.
Post-breakout, index is forming a bullish flag between ~26,300 (support) and ~27,500 (resistance).
Price action: trading above 9 & 21 EMAs, both starting to slope up again.
RSI: holding above 60 → bull range intact.
MACD: trying to turn positive → early signs of fresh momentum.
Trigger:
Bullish: Close above 27,500 can open the door to new highs in Auto.
Risk: Breakdown below 26,300–26,400 would weaken the pattern and short-term bias.
RRG lens (vs Nifty Auto benchmark):
Sector tail moving Improving → Leading → Auto regaining relative strength.
Leaders:
M&M – strong RS & momentum in Leading quadrant.
Ashok Leyland – still in Leading, though momentum needs monitoring.
Early improving: Motherson – turning up from Lagging, watch for follow-through.
Laggard: Hero Moto – remains in Lagging; not a leadership candidate yet.

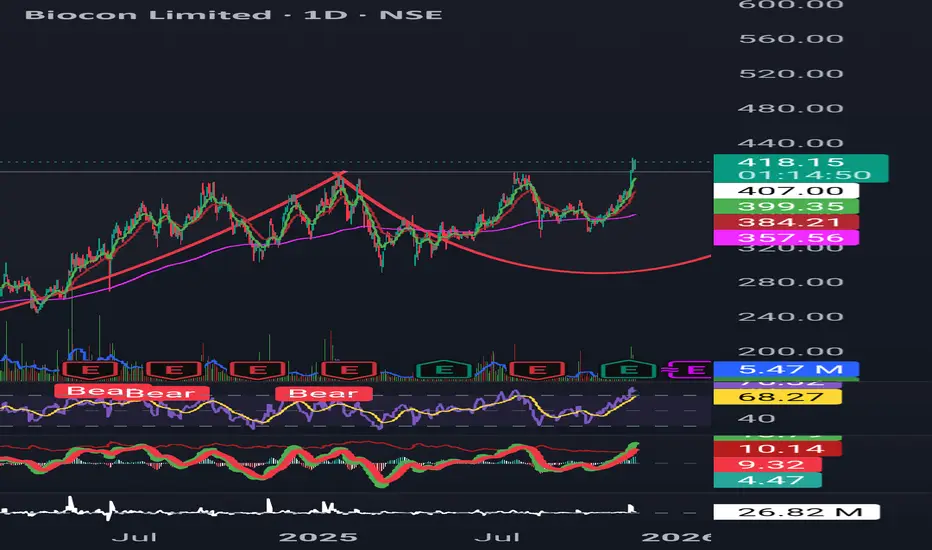
Biocon breaks out of 4-year consolidationStructure: Breakout from a long-term 4-year consolidation base
Volume: Strong expansion indicating institutional participation
Momentum:
RSI > 70 and holding → bullish trend zone
MACD positive and rising → trend confirmation
Trend:
9 EMA > 21 EMA > 200 EMA → multi-timeframe trend alignment
Sector Strength:
Pharma sector outperforming (Sun Pharma, JB Chem, Lupin, Biocon)
Broad-based buying visible across sector
Bias: Bullish as long as price sustains above breakout levels
Invalidation: Close back below breakout zone or loss of EMA/MACD trend
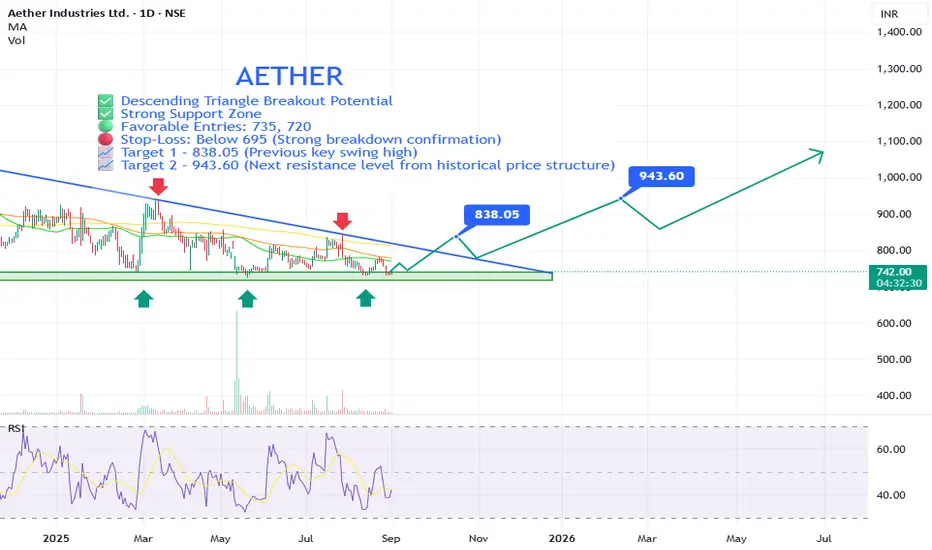
AETHER Bullish Reversal Setup with Strong Risk-Reward PotentialAether Industries Ltd is showing signs of a potential trend reversal from a well-established support zone, supported by a descending triangle breakout pattern and improving technical indicators. This setup suggests a strong risk-reward opportunity for swing traders and positional investors.
⚡ Key Technical Points:
🔵 Descending Triangle Breakout Potential: The price is nearing a breakout from a long-term descending triangle. A breakout above the trendline (~₹778–₹790) could trigger a strong uptrend.
🟢 Strong Support Zone: ₹700–₹720 has held as solid support multiple times (as marked by green arrows), indicating strong demand at these levels.
🟩 Bullish Divergence on RSI: Relative Strength Index (RSI) is showing higher lows while price remains flat or lower, indicating bullish divergence—a sign of potential reversal.
🟢 Favorable Entries: 735, 720
🔴 Stop-Loss: Below 695 (Strong breakdown confirmation)
📈 Target 1 – 838.05 (Previous key swing high)
📈 Target 2 – 943.60 (Next resistance level from historical price structure)
✅ Why This Is a Technically Strong Setup:
✅ Multiple Support Bounces: 700–720 zone has been tested at least 4 times in the last year, showing strength.
✅ Volume-Based Reactions: While volume is low now, past spikes at support zones suggest institutional interest.
✅ Clear Risk Management: Stop-loss is tight (~6–7%) with targets offering 1.5–3x risk-reward potential.
✅ Potential Trend Reversal: Break above descending trendline and moving averages could signal a shift to bullish structure.
✅ Long Base Formation: The stock has been consolidating for over a year—long base formations often lead to explosive moves.
📢 Disclaimer: This is not financial advice. Always do your own research or consult with a professional before making investment decisions.
EUR/USD – Growth Opportunity After Positive DataThe EUR/USD pair is currently trading around 1.1612, up by 0.2% ahead of the September industrial production data from the Eurozone. This data is expected to show a 0.7% recovery for the month, following a sharp 1.2% decline the previous month. This is a positive signal for the Euro and could create a strong growth opportunity for EUR/USD.
Technical Analysis: The chart shows that EUR/USD is attempting to break the 1.16500 level, which indicates a test towards 1.16800 in the short term. If the pair continues to maintain this trend, it may break through strong resistance and target 1.17000. However, this may require additional support factors, such as weak data from the U.S. or more positive macroeconomic signals for the Euro.
Conclusion: With the factors from industrial production data and technical signals , I believe EUR/USD has the potential to continue increasing in the short term, but further confirmation from economic data is needed for a stronger breakout. If the price holds above 1.160 and breaks resistance, 1.170 will be the next realistic target.

XAUUSD – When the Market Starts to “Smell” a Bullish MoveLooking at the current price action, it’s quite clear that gold is entering a new bullish phase supported by both fundamental catalysts and smart money flow . With the U.S. government preparing to reopen and key economic data returning, investors are increasing their bets on the possibility that the Fed may cut interest rates next month . In a climate where political and economic uncertainty is still lingering, gold naturally becomes a preferred safe-haven asset.
On the chart, XAUUSD is maintaining a clean and steady uptrend , consistently bouncing from the trendline and forming higher highs and higher lows. These precise retests show that buyers are firmly in control . Price is now moving towards the 4,300 zone, where some short-term volatility may appear before heading further into the 4,380 resistance.
As long as gold holds above the trendline support , the market can continue its bullish momentum in the coming sessions. Every pullback at this stage acts like a fresh boost , giving buyers more strength to push the market higher.

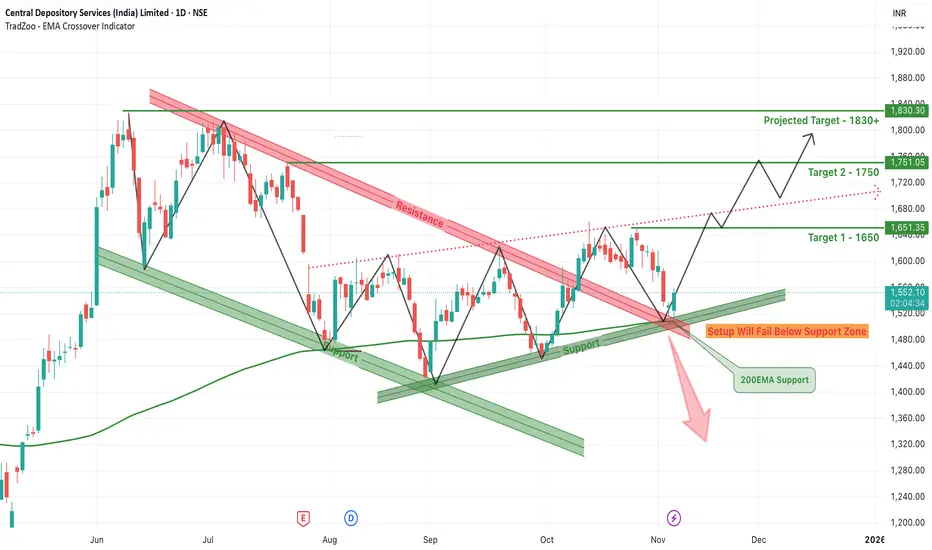
CDSL Breakout from Falling Wedge – Can It Rally to 1830+?CDSL has recently broken out from a classic falling wedge pattern, a bullish technical setup that often signals a trend reversal or continuation of the broader uptrend. After months of being compressed between a descending resistance and a well-established support line, the stock has now pierced through the upper resistance zone with notable bullish momentum.
The wedge had formed over several months, creating lower highs and relatively equal or slightly rising lows. The pattern was further supported by a confluence with the 200 EMA, which acted as a critical dynamic support near the breakout zone. This alignment of technical indicators added strength to the breakout confirmation seen recently.
With this breakout, CDSL has now opened doors for higher targets. The immediate Target 1 is set at ₹1650, which also aligns with a recent horizontal resistance zone. Once this is breached, the next move could extend toward Target 2 at ₹1750, a level where previous price action has shown hesitation. If momentum continues to build and the broader market supports the move, the final projected target of ₹1830+ becomes achievable in the short to medium term.
However, it’s crucial to note that the support zone below ₹1480 is acting as a critical invalidation point for this bullish setup. Any strong breakdown below this zone, especially with volume, would fail the bullish structure and may push the stock back into consolidation or a deeper correction. Traders must also watch the red dotted trendline, which represents a former resistance turned possible retest zone.
Overall, the technical landscape is now favoring the bulls, especially after the breakout confirmation and support from the 200 EMA. Traders and investors should monitor price action near the projected levels and manage risk accordingly, while riding the momentum above the wedge resistance.
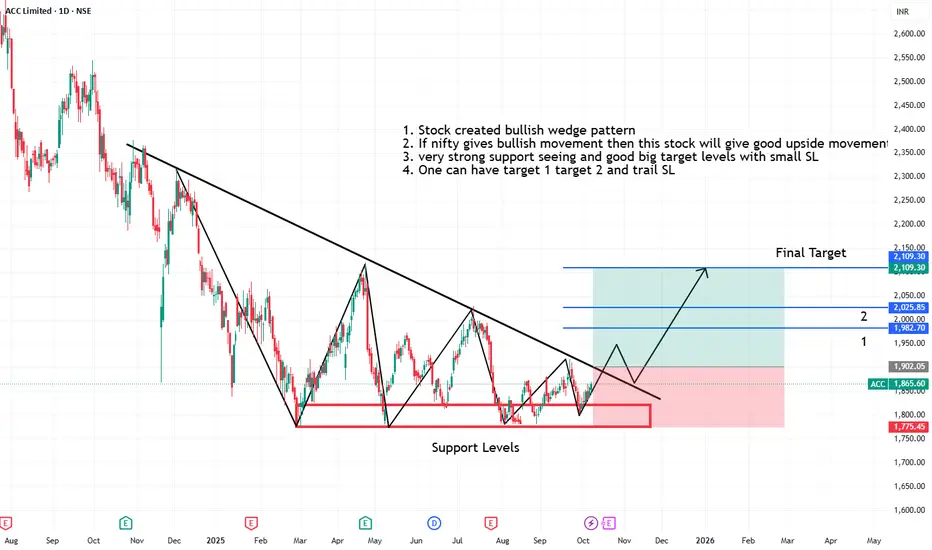
Acc creating bullish wedge pattern on strong support levels1. Stock created bullish wedge pattern
2. If nifty gives bullish movement then this stock will give good upside movements
3. very strong support seeing and good big target levels with small SL
4. One can have target 1 target 2 and trail SL
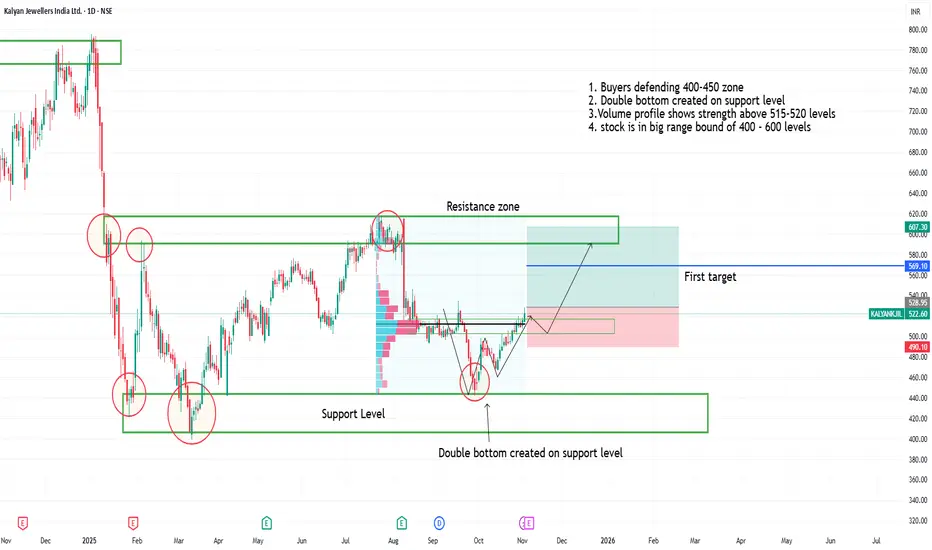
Double bottom in kalyan jwellers on support level1. Buyers defending 400-450 zone
2. Double bottom created on support level
3.Volume profile shows strength above 515-520 levels
4. stock is in big range bound of 400 - 600 levels
5. One can watch for upside movement
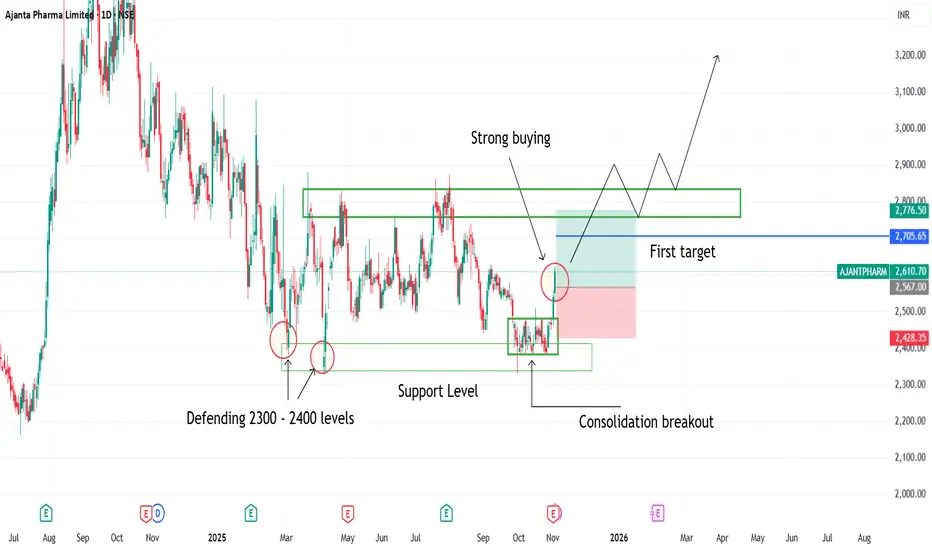
Consolidation breakout seen in ajanta pharma1. Consolidation breakout seen in ajanta pharma
2. Buyers defending 2300 2400 levels
3. Strong Bullish candles indicating strong buyers strength
4. Consolidation breakout has been happened on support levels