Good Support Spotted In Lux Industries LtdLux Industries Ltd is trading near Long-Term Support and Law Of Polarity (LOP). It can undergo any pattern in coming time say triangle, double bottom, wedge or v shape recovery.
Highest volume activity near this zone, RSI is around a small support.
One can have a first mover advantage investing around current level. Stock might see max downside till 1150 in case of market volatility or on some bad news.
Longsetup

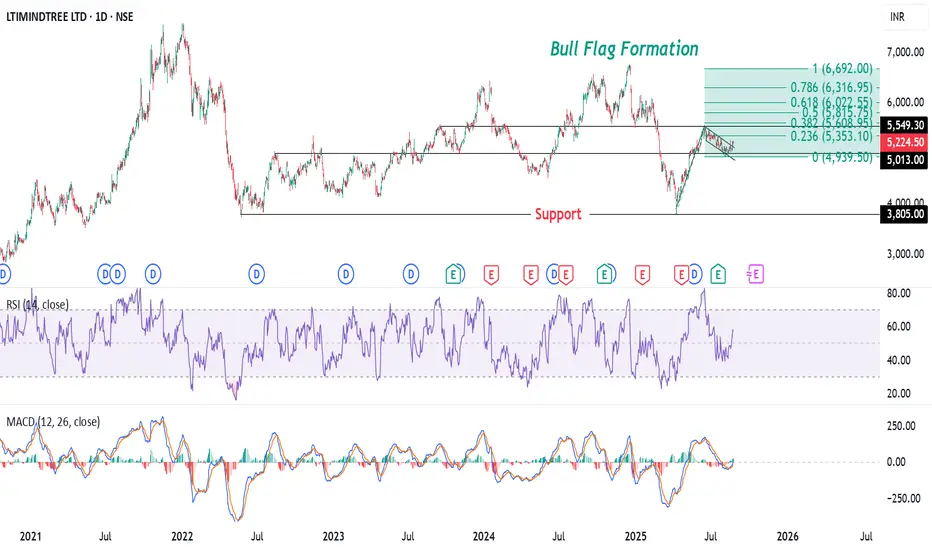
LTIMINDTREE Forms Bull Flag: Signs of a Potential Upside Move?The chart of LTIMINDTREE LTD shows a Bull Flag formation, a bullish continuation pattern that typically appears after a strong upward move. The flagpole is represented by the sharp price rally, from 3,800, followed by a downward-sloping consolidation channel forming the flag.
This pattern suggests a potential breakout to the upside, supported by the Fibonacci extension levels projecting targets up to the .618 fib ext. level at ₹6,022. The RSI is near 56.89, indicating moderate strength, while the MACD shows a possible bullish crossover, further reinforcing the bullish outlook. The key support level is around ₹5,000, and a breakout above the flag could signal a resumption of the uptrend.
Disclaimer: The information provided in this analysis is for educational and informational purposes only and should not be considered as financial or investment advice.
Bajaj Finance - Seems to be on SupportCMP 853 on 12.08.25
In the last 15-20 days, the stock price has come down to 853 from 970. Present level may act as support again, as can be seen on the chart.
If it bounces back, it will form a Double bottom pattern.
Stochastic RSI is showing a reversal sign too.
Targets may be 885/915+.
If it sustains below 840-835 levels, the setup will go weak.
The risk-reward ratio is good at this point.
This illustration is for educational and sharing purposes; this should not be taken as a buying or selling recommendation.
All the best.

XAUUSD: Downtrend Under Pressure from Strong USDCurrently, XAUUSD is trading around 3,328.400, with resistance at 3,369.000 and support at 3,313.000. The price is forming a downtrend within a price channel, and if it breaks the support at 3,313.000, it could push the price lower towards the 3,300.000 target. The EMA indicators show that the downward momentum continues, and if the price fails to break through the resistance at 3,369.000, the downtrend will remain in place.
Market Context:
Recent news has caused XAUUSD to drop, mainly due to the recovery of the USD after positive economic signals. Higher-than-expected unemployment claims data strengthened the USD, putting downward pressure on XAUUSD.

Gold Strongly Rebounds: Heading Towards New Targets! The gold market is showing signs of a strong recovery, with several factors supporting an upward trend in the near future.
News supporting the rise of XAUUSD:
FOMC Minutes: A dovish stance from the FOMC weakens the USD, creating favorable conditions for gold to continue rising.
Initial Jobless Claims: Data showing higher-than-expected claims indicates a weaker economy, prompting the Fed to maintain its accommodative policy, which supports gold.
PMI: Weaker PMI data signals a slowdown in production, continuing to weaken the USD and supporting gold's upward trend.
Technical Analysis:
The XAUUSD chart shows gold making a strong recovery from the support at 3,334 USD, with resistance near 3,370 USD. If gold holds above the support level, the likelihood of further gains is very high. The current pattern indicates a sustainable bullish structure with higher highs and lows.
With the alignment of both fundamental and technical factors, XAUUSD is likely to continue rising towards higher targets. The resistance at 3,370 USD is the next level to watch.

BTC Consolidating, Ready to Blast Towards 130K?BTC/USDT is still holding within its uptrend channel , with strong support around 112.3K and key resistance at 123K–125K. After hitting an all-time high near 124.5K, the price pulled back to 112–115K for consolidation, building a base for the next rally.
On the news side, the market is getting strong support as the US officially allows Bitcoin in 401(k) retirement plans and has set up a Strategic Bitcoin Reserve . At the same time, spot Bitcoin ETFs continue to attract massive inflows, pushing total assets above $150 billion in just 18 months. This shows rising institutional confidence, despite short-term corrections.
The preferred scenario now is to look for buy opportunities around 112–115K , targeting a rebound to 123–125K, and if that breaks, the next destination could be 130–135K.
On the flip side, a defensive strategy should be considered if BTC falls below 110K, as this is a crucial level for maintaining the medium-term uptrend.

Gold breaks downtrend channel, next target lower!Gold is currently trading within a clear downtrend channel, marked by lower highs and lower lows. After multiple rejections at the upper boundary of the channel, gold has begun its downward trend towards key support levels.
From a technical standpoint, the recent pullback and structural breakdown indicate that the market may continue its bearish trend. Last week's PPI data showed a 0.9% increase , exceeding expectations, which has strengthened the USD and added pressure on gold. This news reduces expectations for aggressive Fed rate cuts , further strengthening the dollar and diminishing gold's appeal as a safe-haven asset.
Looking at the chart, we can identify key support levels to monitor. The first target is around 3,311.000, with the potential to continue falling to 3,287.800 if price breaks below the near-term support at 3,310.000.
Key Levels:
Resistance: 3,355.700 (Upper boundary of the downtrend channel)
Support: 3,311.000, 3,287.800
Next Target (TP1): 3,311.000
Next Target (TP2): 3,287.800
My Advice:
With the bearish structure on the chart and the pressure from the PPI data, the outlook for gold remains to the downside. I recommend looking for short opportunities near 3,355.700, with stops above resistance and targets at 3,311.000 and 3,287.800.

Kaynes Technology is at a crucial breakout zone:
Setup: Price consolidating within a symmetrical triangle, now testing the upper trendline.
Indicators:
RSI ~58, just entering bullish zone, but not overbought.
MACD turning positive → momentum aligning with trend.
EMAs: 20 & 50 EMA aligned upward; price holding above 6,000.
Levels:
Targets: ₹6846 , ₹7,203, ₹7711
Stoploss: ₹6190
👉 Outlook: Break and sustain above ₹6,500 can trigger fresh momentum towards ₹7,000+. Support at ₹6190 is critical.

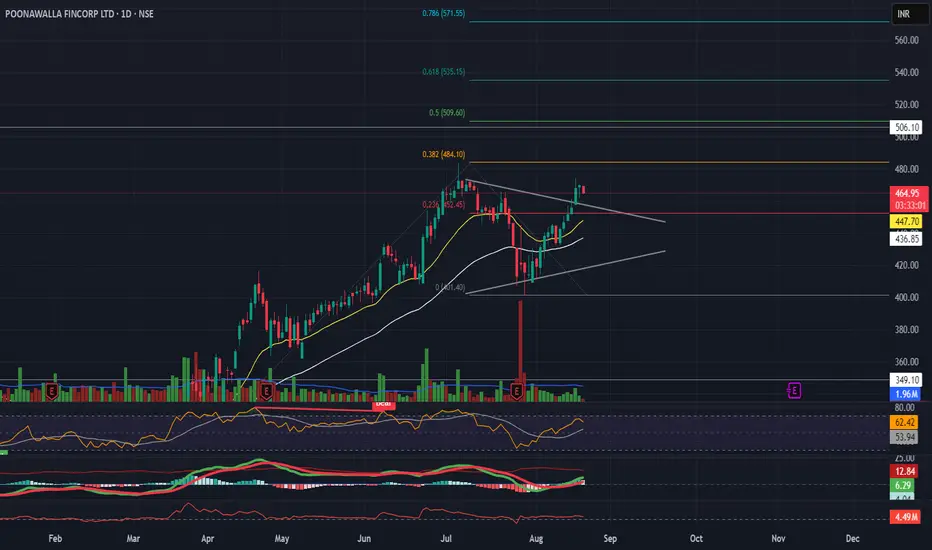
Poonawalla Fincorp showing a symmetrical triangle breakout:
Setup: Clear breakout above trendline resistance on daily chart.
Indicators:
RSI at 62 → momentum strong, near overbought but not overheated.
MACD bullish crossover with positive histogram.
EMAs: 20 & 50 EMA slope positive; price sustaining above both.
Levels:
Stoploss: ₹445
Targets: ₹509 immediate, then ₹535
👉 Outlook: Strong bullish bias. Sustaining above ₹473 opens path towards ₹500–506 zone. Support at ₹445.
Effective and Widely Used Trading StrategiesTrend Following Strategy
Definition: Trading according to the market trend, buying when the trend is up and selling when the trend is down.
How to Implement: Use technical analysis tools like Moving Averages (MA), RSI, and MACD to identify the market trend. One simple strategy is to trade long when the price is above the moving average (MA), and trade short when the price is below the MA.
Why it Works: The Forex market often has strong trends, which increases the chances of success.
Reversal Trading Strategy
Definition: Finding trading opportunities when the price shows signs of reversing after a strong trend.
How to Implement: Use indicators like RSI, Stochastic Oscillator, or reversal candlestick patterns (such as Doji, Engulfing) to identify reversal points. When the indicators show overbought or oversold conditions, you can place a sell order (if overbought) or a buy order (if oversold).
Why it Works: The market can reverse sharply after a long trend, offering high-profit opportunities when entering at the right reversal point.
News Trading Strategy
Definition: Trading based on major news events, such as interest rate announcements, GDP reports, or employment data.
How to Implement: You need to monitor economic events such as interest rate announcements, GDP reports, employment data (Non-Farm Payrolls), and inflation indices (CPI) to make trading decisions. Usually, before and after important news, the price will experience significant volatility.
Why it Works: News can cause strong market movements, creating high potential profit opportunities if you predict correctly.
Would you like to learn more about any specific strategy? Please leave a comment below to discuss with us.

EURUSD: Support About to Break, Bearish Trend Continues!EURUSD is currently trading in a clear downward channel. After failing to break the resistance at 1.17200, the price reversed and is now testing support at 1.16000. If this support is broken, the price may continue to decline towards 1.16297 and 1.15500.
The current market structure shows that selling pressure is dominant. If 1.16000 is broken, the bearish trend will continue. Traders should prepare to enter a sell position if this support level is broken, with targets towards lower support levels.

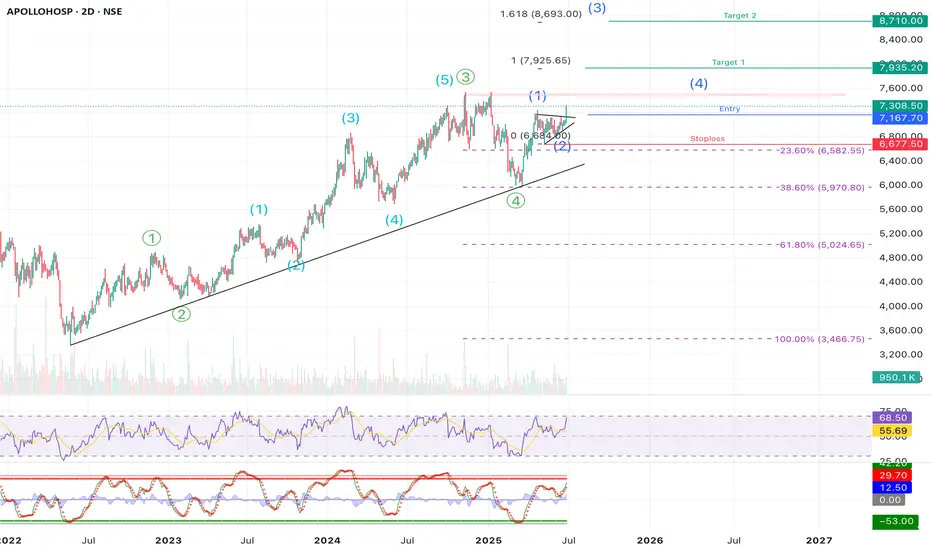
APOLLOHOSP | Swing | Breakout APOLLO HOSPITAL – Elliott Wave Structure + Breakout Opportunity Ahead
Apollo Hospitals is showing a textbook Elliott Wave formation, and we might just be at the beginning of a fresh impulsive rally. If you’re a swing trader or positional investor, this setup is worth keeping a close eye on.
⸻
🧩 Elliott Wave Count Analysis
• The stock is in a larger degree 5-wave move (marked in green). Within that 1-4 completed and wave 5 in progress.
• Within that, we can also see a new 5-wave impulsive structure developing (in blue), and it seems like we just completed Wave (2) of this new leg.
• This means — Wave (3) could be starting now, which is usually the strongest and fastest wave.
⸻
📈 Trade Setup
• Entry Zone: Around ₹7,165–₹7,215
• Stoploss: ₹6,677 (just below recent swing low and invalidation of the current wave count, Around 7-8% )
• Target 1: ₹7,925 (around 10%+ )
• Target 2: ₹8,710 (around 25%)
• Extended Target (Wave 3 Fibonacci Extension): ₹9,167
The targets are based on Fibonacci extension levels from Wave (1) to Wave (2), which typically project the length of Wave (3).
⸻
🔍 Supporting Technicals
✅ Trendline Support
• Price has been respecting a long-term rising trendline since early 2022 — a strong sign of continued bullish momentum.
✅ RSI & Stochastics Turning Up
• RSI is rising but not overbought — suggesting more room for upside.
• Stochastic oscillator is also showing a bullish crossover, confirming early momentum for the next wave up.
⸻
⚠️ Risk Management Note
If price drops below ₹6,677 and breaks the trendline, that would invalidate this Elliott wave count. It’s wise to exit or reduce exposure in that case. This is key to avoid being caught in a deeper corrective phase.
⸻
📝 Summary:
Apollo Hospitals appears to be starting a fresh Wave (3) after completing a healthy correction. With a clean Elliott Wave structure, trendline support, and supportive indicators, the setup looks strong. Risk is clearly defined and the reward potential is high — a good case for a swing position.
⸻
💬 Are you tracking this Wave 3 setup too? Let’s hear your thoughts in the comments below!
Disclaimer:
This analysis is shared for educational and informational purposes only. It is not investment advice or a recommendation. Please consult a SEBI-registered financial advisor before making any investment decisions. The author is not responsible for any losses arising from trading or investing based on this analysis.
XAUUSD: Support Broken? Bearish Trend Continues!XAUUSD is currently trading in a clear downward channel on the H4 timeframe . After failing to break the resistance at 3,360 , the price reversed and is now testing the important support level at 3,320 . This support level has been tested multiple times in the past weeks. If this support is broken, the bearish trend could continue, with the next targets at 3,300 and 3,280.
The market structure remains weak, with lower highs and lower lows , confirming that the selling pressure is dominant. If the price fails to hold the 3,320 support level, the likelihood of further declines towards lower support levels is very high. It’s crucial to closely monitor price action at these support levels.
Stay tuned to market developments and prepare your trading strategy accordingly, as everything is shifting towards a stronger bearish move !

BTCUSDT: Continued Growth in the Short TermBTCUSDT is currently trading within a stable price range, with a clear uptrend channel forming. After bouncing off the strong support at 116,000 USD, BTCUSDT is likely to continue its bullish momentum, with the first target set at 123,000 USD.
The latest news from the cryptocurrency market shows a growing confidence in Bitcoin, driven by positive signals from major financial institutions. Recent price corrections have created good buying opportunities for investors. The global economic situation, particularly the weakening of the USD and increasing institutional adoption of Bitcoin, is driving BTC's value higher.
Trading Strategy:
Buy: Enter a buy position when the price approaches the 116,000 USD support level again or breaks above 117,000 USD.
Stop-loss: Set a stop-loss below the 116,000 USD support level to protect in case of a reversal.
With the current market structure and supportive factors from both news and technical analysis, the bullish trend of BTCUSDT is highly likely to continue in the near term.

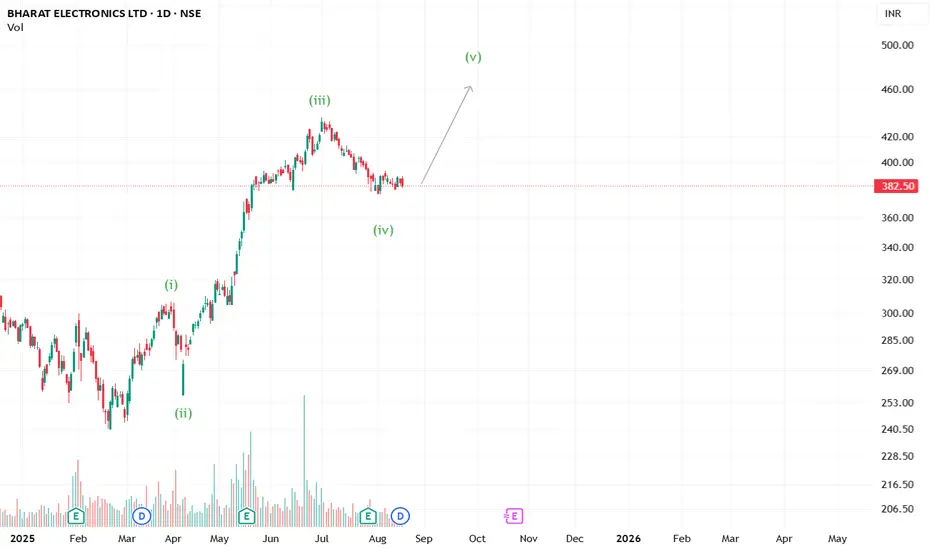
BEL Poised for Final Wave Up Surge after Forming a BaseElliott Wave structure suggests Bharat Electronics has completed its Wave (iv) correction, forming a base for a potential Wave (v) upside move toward fresh highs.
EURUSD: Bearish OutlookFrom the chart, EURUSD is currently trading in an ascending price channel, but signs of a pullback have emerged from the 1.17300 level, suggesting a potential continuation of the decline in the short term. Recent economic data, particularly the PPI index from the U.S., has put significant pressure on the EUR, strengthening the USD and weakening the Euro. This may continue to maintain bearish pressure on EURUSD.
Technically, the key support level to watch is 1.16264. If this level breaks, EURUSD could continue to decline towards lower support levels such as 1.16000. Bearish signals from technical indicators also support this pullback.
Trading Strategy:
Sell: Wait for a break below 1.16264 to enter a short position, with the next target at 1.16000.
Stop-loss: Set a stop-loss above the resistance at 1.17300 to protect the account in case of a reversal.

XAUUSD Continues Bearish Trend, Testing Key SupportGold is currently trading around 3,335 USD, closing near an important support zone, as highlighted in the chart. The precious metal continues its bearish trend, pressured by the 0.9% increase in the U.S. Producer Price Index (PPI) for July. This indicates persistent inflationary pressure, reinforcing the Fed's stance on maintaining high interest rates, which weakens gold's appeal.
Technical Levels:
The current price is approaching a key support zone between 3,328 USD – 3,273 USD, where a potential bounce could occur if price action confirms a reversal.
The trend remains bearish as long as the price stays below the 3,370 USD resistance, consistent with the pattern of lower highs and lower lows.
A break below the 3,328 USD support could trigger further downside, with the next target at 3,273 USD.
Conclusion:
With the PPI data adding pressure, and the price nearing a crucial support zone, the outlook remains bearish for gold. Traders should monitor price action at the support levels for potential sell opportunities.

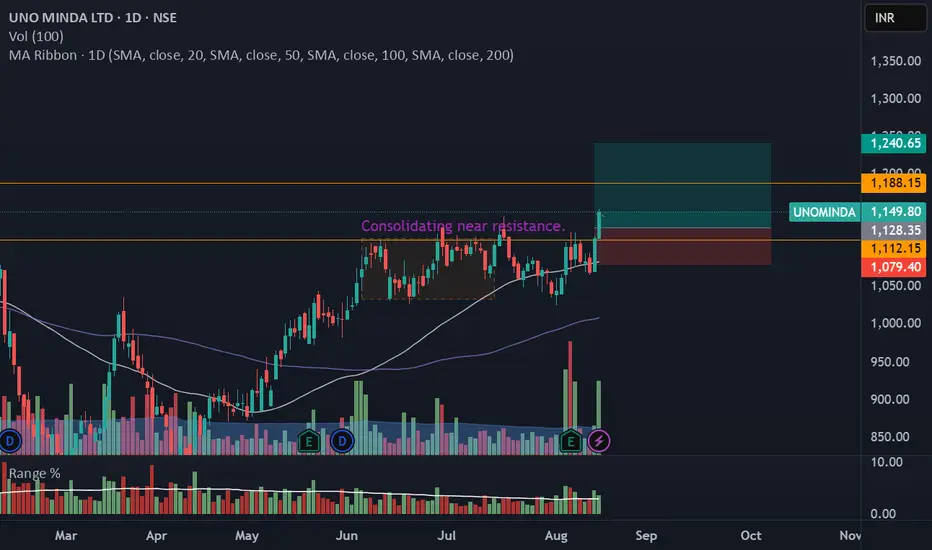
UNOMINDA – Daily Timeframe Breakout Idea (Resistance Zone Break)UNO MINDA LTD. has shown a breakout above a key horizontal resistance level on the daily chart, accompanied by a nearly 1.5 times volume surge near the breakout, as seen earlier, supported by strong momentum.
🔍 Breakout Context:
- Price broke above the ~₹1110 and 1120 horizontal resistance, which had held for over 6 months.
- Breakout supported by more than average volume and just above average range near the resistance zone.
- The price is also trading above both the 50- and 100-day SMAs, indicating strong trend continuation.
- This aligns with a bullish continuation setup.
📉 Trade Plan:
- CMP: ₹1149
- Entry: Near ₹1128
- Target: ₹1240 (~10% upside from CMP)
- Stop-Loss: ₹1079 (Closing Candle)
- Risk-Reward Ratio: ~1 : 2.2
XAUUSD – Gold under pressure after US retail sales and UoM dataHello traders, today let’s take a look at the XAUUSD chart following the latest news and clear technical signals.
On the H4 timeframe, price is moving within a descending wedge pattern, with multiple rejections at the trendline resistance (red arrows). The 3,346 – 3,373 USD area is acting as the main resistance, while the nearest support is around 3,310 USD. The current market structure leans bearish, with lower highs forming and buying momentum fading.
From a news perspective, Core Retail Sales m/m came in at 0.3% (below the 0.5% forecast), indicating weaker consumer spending. However, UoM Consumer Sentiment rose to 61.9 and inflation expectations surged to 4.5%, leading the market to believe the Fed will keep interest rates higher for longer — strengthening the USD and putting pressure on gold.
If price continues to be rejected around 3,346 – 3,373 USD, XAUUSD is likely to break below 3,310 USD and move toward the deeper support area near 3,285 USD.
A suggested strategy is to prioritize SELL setups if price retests 3,346 – 3,373 USD with strong rejection signals, place stop-loss above 3,380 USD, and target profits around 3,310 and 3,285 USD.
Do you think gold will break 3,310 USD in this move, or will it make one more pullback before heading lower?

BTCUSDT – Continuing the Uptrend, Targeting 124,000 USDBTCUSDT continues its strong uptrend, with price moving within a stable ascending channel. The nearest support is at 116,900 USD, where the price has bounced and maintained its upward momentum. Recent fundamental factors, including rising demand and positive market sentiment towards Bitcoin, are driving this growth. The next target for BTCUSDT is the resistance zone at 124,000 USD. If this level is broken, BTC could move towards 135,000 USD.
Trading Strategy: Buy when the price tests support at 116,900 USD and wait for confirmation of continued upward movement. The target is 124,000 USD, and beyond that, 135,000 USD. Place a stop-loss below 116,000 USD. As long as the price remains above 116,900 USD, the uptrend remains intact.

EURUSD – Continuing the Uptrend, New Targets AheadEURUSD is experiencing a strong recovery after testing the 1.16600 support level. The chart shows price moving within an ascending channel, continuing to form higher highs and higher lows, with the near-term target at 1.18000 and further at 1.18600. Buying pressure has returned as the price failed to break below the 1.16600 support, driving the uptrend momentum.
In terms of news, although U.S. Core Retail Sales came in weaker than expected (0.3% vs 0.5%), indicating slower consumer spending, this provides an opportunity for EURUSD to rise. However, the overall sentiment remains tilted toward a weaker USD, which supports the uptrend for EURUSD.
If price continues to hold above 1.16600 and breaks through 1.18000, EURUSD could continue its upward momentum towards higher levels. However, if the price breaks the 1.16600 support, the uptrend will be at risk.

XAUUSD consolidates, awaiting a reboundFollowing last night’s US PPI data coming in higher than expected (0.2% vs. 0.0%), XAUUSD faced strong selling pressure as markets priced in expectations that the Fed will keep interest rates higher for longer. This boosted the US Dollar and Treasury yields, pushing gold down to around 3,346 USD.
Technically, price is still moving within a wide sideways range between 3,284 and 3,450 USD, but the short-term trend remains capped by a descending trendline from recent highs. The 3,346 USD zone is acting as a trendline touchpoint, potentially leading to a sideways accumulation around 3,312 – 3,346 before a mild rebound.
If the 3,284 USD support holds, the probability of a technical bounce toward 3,346 – 3,379 USD is high, especially as buyers may use the range’s lower boundary to accumulate positions. Conversely, a break below 3,284 USD could trigger stronger selling pressure toward 3,254 USD.

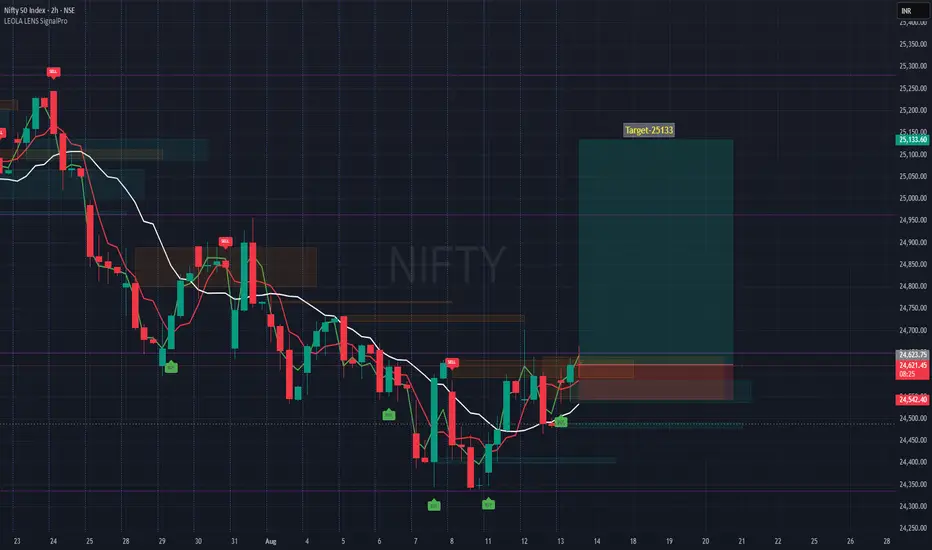
NIFTY Eyes Long on 25133- Bullish Breakout WatchTimeframe: 2-hour (H2)
Entry Zone: Around current breakout level of 24,619
Target: 25,133 – aligns with a prior reaction high and measured move projection from recent swing range.
Stop-Loss: 24,542 – just below the most recent higher low, protecting the setup if momentum fails.
Reasoning:
Price has been forming higher lows since August 7, indicating gradual strength building.
Moving averages have turned upward, confirming short-term trend change.
Previous sell-side liquidity zones have been cleared, reducing overhead resistance until the 25,133 area.
Volume profile shows a gap zone between 24,650 and 25,100, often filled quickly in trending conditions.
Risk Management:
This is a swing-style setup within an ongoing uptrend on the lower timeframe but still needs confirmation from follow-through buying.
Disclaimer:
This chart is for educational discussion only and does not constitute financial advice or a recommendation to trade. Markets carry risk, and decisions should be based on your own analysis and risk tolerance.