Strong USD, Gold "Holding Its Breath" at Key ResistanceYesterday, gold prices continued to trade within a tight range of 3,340–3,355 USD , reflecting the tug-of-war between buyers and sellers. Selling pressure is still present but not strong enough to break the key support level.
On the news front: Both the U.S. Core PPI m/m and PPI m/m are forecast to rise 0.2% (vs. 0.0% previously), while unemployment claims are expected to dip from 226K to 225K . This signals inflationary pressure from the production side and a resilient labor market , which could prompt the Fed to maintain a tight monetary policy. A stronger USD puts short-term downward pressure on gold.
From the chart: Gold is moving within a sideway range of 3,340 – 3,363 USD after being rejected at the 3,363 USD resistance zone. The price structure shows consolidation with minor technical pullbacks. The 3,312 USD support remains intact; if it holds, buyers may step back in.
Suggested strategy:
Look for buy opportunities around 3,312 – 3,320 USD if support holds, with a target at 3,363 USD. Place stop-loss below 3,305 USD to limit risk.
Question: Do you think gold has enough momentum to break 3,363 USD and start a new bullish leg this week?
Longsetup

XAUUSD Drops $55, Bearish Trend Continues!Yesterday, XAUUSD plummeted from $3,398 to $3,342 , losing more than $55 in just one trading session. This sharp decline pushed XAUUSD below a crucial support level , signaling significant weakness .
This drop confirms that gold is under strong selling pressure , with the market struggling to maintain upward momentum .
Additionally, the m/m CPI came in at 0.3% , higher than the expected 0.2% . This indicates inflation is rising faster than anticipated, increasing expectations that the Fed will continue raising interest rates.
This outcome could strengthen the USD , which typically leads to a drop in gold prices. This factor further supports the bearish outlook for XAUUSD.
The price is now approaching a near resistance level at $3,362 , a key point that may limit further upside potential. The near support is located at $3,310, and this will be tested if the price breaks through the resistance at $3,362.
Conclusion: With the combination of strong bearish price action, a stronger USD driven by CPI data, and technical structure supporting the downtrend, XAUUSD appears to be in a strong bearish trend. Risk management should be a priority as the price could test new lows near $3,310, and if this level breaks, the bearish trend could accelerate.

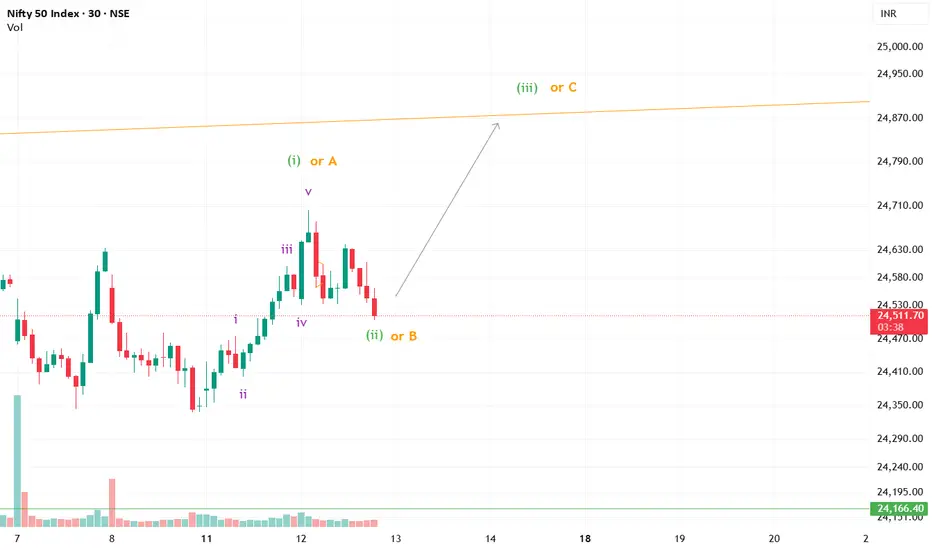
Nifty Elliott Wave Setup Points to Next Bullish LegNifty may be completing Wave (ii) or B, with a strong Wave (iii) or C rally likely ahead.
AXIS BANK | Swing Long Setup 📌 AXIS BANK – Wave 2 Completion & Potential Bullish Wave 3 Ahead 🚀
Axis Bank appears to have completed its corrective Wave 2 and may now be gearing up for the next impulsive rally — Wave 3, which is often the strongest in Elliott Wave theory.
---
🧩 Elliott Wave Structure
Wave 1: Strong rally from the lows earlier in 2025, showing clear bullish intent.
Wave 2: Completed as a complex W–X–Y correction , ending around the 50% Fibonacci retracement zone (₹1,079), which is a common reversal area in Elliott Wave patterns.
The substructure inside Wave 2 (marked as a–b–c, w–x–y) shows corrective nature, indicating that the broader uptrend remains intact.
---
📈 Current Outlook & Key Levels
Current Price**: ₹1,073 (hovering near 50% retracement level).
Support Zones:
₹1,051 (38.2% Fib) – minor support.
₹1,005 (23.6% Fib) – strong support and Wave 2 invalidation watch.
Immediate Resistance: ₹1,128 (61.8% Fib).
Breakout Trigger : A sustained close above ₹1,182 will confirm strength and open the path for higher targets.
---
🎯 Upside Targets (Based on Fib Extensions of Wave 1)
Target 1: ₹1,238 (100% projection).
Target 2: ₹1,321 (127.2% extension) – strong Wave 3 projection zone.
---
🔍 Indicators & Market Context
✅ Price has respected the 50% Fibonacci retracement, showing early signs of buyers stepping in.
✅ Moving averages are starting to flatten, and a bullish crossover could be on the way once price pushes above ₹1,128.
✅ Volume remains moderate; a spike in buying volume on breakout would add confidence to the bullish scenario.
---
⚠️ Risk Management
> If price drops below ₹1,005 (Wave 2 low), the bullish Elliott count would be invalidated, and deeper correction may follow. In such a case, it's better to step aside and wait for a fresh setup.
---
📝 Summary
> Axis Bank seems to have finished its Wave 2 correction and is preparing for a possible Wave 3 rally. A breakout above ₹1,182 could start the next bullish leg towards ₹1,238 and ₹1,321. Until then, watch the key supports at ₹1,051 and ₹1,005.
---
**Disclaimer:**
This analysis is for educational purposes only and is not financial advice. Please consult a SEBI-registered financial advisor before making any investment decisions.
#AxisBank #ElliottWave #SwingTrading #Wave3 #PriceAction #TradingViewIndia #TechnicalAnalysis
---

EUR/USD – Bullish Momentum Still DominatesIn July, the USD rose sharply by around 3.2% thanks to strong GDP data and tax-cut expectations, but this momentum is now fading quickly. Weak employment figures and concerns over the independence of the BLS, following Trump’s dismissal of its head, have undermined confidence in the USD. Goldman Sachs, Citi, and Barclays remain bearish, projecting that EUR/USD could reach the 1.20 area in the medium term.
EUR/USD has maintained an upward trendline since early August, rebounding strongly from 1.1450–1.1500, breaking through FVG, and consolidating above 1.1627. The HH–HL structure confirms the bullish trend. Above 1.1630, price could target 1.1750; a breakout above 1.1750 would open the way to 1.1780–1.1800 (top of the long-term channel).
Trading Plan:
Main Trend: Bullish
Potential Buy Zone: 1.1630 – 1.1650 (upon confirmation signal)
Short-term Targets: 1.1750 → 1.1780
Medium-term Targets: 1.1900 and potentially 1.2000
Sop-loss: Below 1.1600

Gold is about to break out – Big buying opportunity!The chart shows that gold is trading in a clearly defined uptrend channel , with successive higher highs and higher lows, strengthening the solid bullish trend . Price action indicates strong support around 3,300 USD , and if it remains above 3,360 USD , the potential for gold to continue towards the target of 3,450 USD is highly likely. 3,450 USD is a key resistance level; if broken, gold could continue rising strongly to 3,480 USD , reinforcing the market's upward momentum.
News supporting the bullish trend:
The rumor that the U.S. would impose a 39% tax on gold imports from Switzerland triggered a strong buying wave, pushing gold above 3,400 USD . Although the rumor was later denied, the strong reaction still supports market sentiment and maintains the upward momentum.
Additionally, expectations that the Federal Reserve will reduce interest rates in the near future are easing the pressure on gold, a non-yielding asset, making it an attractive investment option in a low-interest-rate environment.
Forecast and trading strategy:
Main Scenario (Bullish Trend): As long as gold stays above 3,360 USD, the upward trend will continue. The next target is 3,450 USD, with the possibility of extending to 3,480 USD if this level is broken.
Entry conditions: Confirmation signals from price action, such as breaking resistance or a bullish candlestick pattern, will be strong entry points. Watch for the breakout of 3,400 USD as a potential buying opportunity.
Risk management: Place a stop-loss below the key support level at 3,360 USD to protect your capital in case the market unexpectedly reverses.

XAUUSD – the bullish wave is not over yetHello fellow traders,
Gold continues to maintain its impressive upward momentum after reaching a new high at 3,440 USD/oz.
On the technical side , XAUUSD remains within its long-term ascending channel, currently trading around 3,397 USD and holding firm above the key support at 3,278 USD.
On the news front , the rally is fueled by the US imposing a 39% tariff on Swiss gold bars, ongoing geopolitical tensions coupled with stagflation risks, and expectations that the Fed will soon cut interest rates. The Indian market has also hit record highs due to a weaker Rupee, while the widening spread between spot and futures prices reflects tightened supply conditions.
Reference strategy: As long as price holds above 3,278 USD, the preferred scenario is short-term consolidation followed by a breakout above 3,534 USD, aiming for higher levels near the upper boundary of the channel.
What do you think—does XAUUSD have enough momentum to break above 3,440 USD in this move?

BTCUSDT – 1H Chart Analysis📊 BTCUSDT – 1H Chart Analysis
Current Structure
• Market has been in a downtrend with a sequence of Lower Highs (LH) and Lower Lows (LL).
• Price recently broke above the descending trendline and is now testing it for support.
• Key horizontal levels marked in white and red provide both breakout and rejection opportunities.
⸻
📈 Bullish Scenario (Breakout Confirmation)
• Trigger: If price holds above 116,000 – 116,200 and closes 1H above trendline.
• Entry Zone: 116,500 – 116,800 (post retest confirmation)
• Targets:
• TP1: 117,340 (immediate resistance)
• TP2: 118,165 (strong supply zone)
• Extended: 119,810 – 122,800 (major liquidity zone)
• Stop Loss: Below 115,980 (trendline break + support fail)
⸻
📉 Bearish Scenario (Rejection & Breakdown)
• Trigger: If price fails to hold above the trendline and breaks below 115,980.
• Entry Zone: 115,800 – 115,500 (after breakdown retest)
• Targets:
• TP1: 115,238 (previous demand)
• TP2: 114,656 (strong support)
• Extended: 112,000 – 111,984 (major demand)
• Stop Loss: Above 116,700 (fakeout invalidation)
⸻
💡 Summary:
• Bulls need a clean hold above the trendline to reverse the downtrend structure.
• Bears regain control if support breaks and price returns inside the descending channel.
• Watch volume closely — a breakout with weak volume may lead to a fakeout.
BTCUSDT – pressure building before the breakoutMarket context:
US trade policy eases restrictions for certain major tech companies → risk appetite improves.
Expectations of a more dovish Fed → capital flows return to the crypto market.
Sentiment & flows:
Short-term Bitcoin holdings increase by around 20 billion USD → trading activity is heating up, but profit-taking pressure is also building.
Investors are closely watching the 116,000 USDT level before adding aggressive long positions.
8H technicals:
Support: 112,600 USDT – a zone that has repeatedly triggered rebounds, maintaining the bullish structure.
Resistance: 116,000 USDT – the “gate” that could open the way to 123,000 USDT.
Bullish scenario remains favored if price closes above 116,000 USDT with confirming volume.
Key takeaway:
The market feels like it’s “winding the spring” – tight consolidation before a potential breakout.
A break below 112,600 USDT would invalidate the short-term bullish view and increase the risk of a deeper pullback.

EURUSD – recovery aiming to test resistance zoneThe euro is benefiting from the weakening pressure on the US dollar as the market expects the Fed to loosen its monetary policy, combined with positive signals of trade cooperation between the US and Europe. This risk-on sentiment is supporting the short-term uptrend of EUR/USD.
The price is moving within a short-term bullish structure and is approaching the resistance zone around 1.1770 , after rebounding strongly from the support area near 1.1630 . Recent pullbacks have been shallow and quickly absorbed, indicating that buyers still hold the upper hand.
Base scenario: EUR/USD may consolidate in a tight range before breaking above 1.1770, opening room for further upside. As long as the 1.1630 support holds, any pullback can be seen as an opportunity to add long positions in line with the prevailing trend.

XAUUSD – consolidating within range, awaiting breakout momentumGold is currently receiving strong support from news that the PBOC has been buying gold for nine consecutive months , bringing reserves close to 74 million troy ounces . This is a strategic move aimed at strengthening financial security and r educing reliance on the US dollar , which has created a positive sentiment in the market.
On the H4 chart, XAUUSD remains range-bound between 3,344 and 3,408 , with strong rebounds from the lower support zone. The price structure suggests that selling pressure is weakening , while buying momentum is building a base.
The preferred scenario is that the price will continue consolidating in a narrow range , then retest 3,344 before rising toward the 3,408 resistance and potentially higher if a breakout occurs. As long as support holds firm , the mild uptrend is likely to continue.

Bitcoin targets $133,000 with institutional capital inflowsBitcoin is currently trading in an upward channel, forming higher highs and higher lows, indicating a strong bullish trend.
Capital inflows from major financial institutions like JPMorgan and Citigroup are increasing into BTC, combined with expectations that the Fed will cut interest rates in September, providing positive momentum for the price. The Trump administration's cryptocurrency policies and Syz Capital reopening its BTC Alpha fund with 2,000 BTC have driven strong participation from institutional investors.
Technically, BTC has bounced off the support at $112,816 and could continue toward the resistance at $119,249. A break above this level could set the next target at $133,000 by the end of 2025. Investors should carefully monitor signals and manage risk accordingly.

EUR/USD – Uptrend Strengthens as USD WeakensMacro backdrop is favoring the euro:
Weaker U.S. labor market (only 73,000 new jobs) is boosting expectations of a Fed rate cut in September.
Political pressure on the Fed raises concerns about its independence → USD loses credibility.
EU–US trade deal eases tensions and supports confidence in the euro.
Technical Outlook
On the H4 chart, price has broken the downtrend line from July , forming a classic higher low structure – a hallmark of an uptrend.
Price is moving within a short-term ascending channel , targeting the 1.1780 resistance zone.
RSI has broken above 70, indicating strong buying momentum but also signaling a potential short-term pullback.
Suggested Trading Strategy
Prefer to Buy on dips toward the 1.1570–1.1600 support zone.
Near-term target: 1.1780
Stop loss: Below 1.1520

XAUUSD – Gold stays hot, bullish trend still intactGold continues to be in the spotlight as a combination of macroeconomic factors and technical structure supports further upside momentum.
Market Overview:
- Analysts have revised gold price forecasts upward to the $3,500–$3,600/oz range, driven by a weaker USD and concerns over slowing US growth.
- Labour market data from the US is showing weakness, with rising jobless claims – increasing expectations that the Fed may cut rates in September.
- Geopolitical tensions and global trade uncertainties are boosting gold's appeal as a safe haven asset.
- Strong investor interest: Trading volumes in gold futures have risen significantly, indicating heavy participation from big money.
Technical Analysis:
- Price is clearly moving within an ascending channel, reflecting a stable medium-term uptrend.
- Gold is currently testing the short-term resistance around $3,408 , with potential for a minor correction toward support near $3,350 , which aligns with the lower boundary of the channel.
- As long as price remains inside the ascending channel, the bullish bias remains valid.
Trading Strategy
Look for long entries near the $3,350 support zone on a pullback.
Short-term target: $3,408 – Mid-term target: $3,500+
Stop-loss: Below $3,320
In summary , gold is receiving strong support from both fundamentals and technicals. Buying the dips remains the preferred strategy in the current setup.

BTCUSDT – Institutional Money Returns, Signs of a Strong ReboundBitcoin is showing positive recovery signals as major capital flows are re-entering the market. Notably, Syz Capital has successfully raised $200 million to invest in BTC – a strong indicator of growing long-term confidence from institutional investors.
On the H8 chart, BTC remains in a downtrend channel but is forming an accumulation pattern around the 111,000 USDT support area. Previous FVG zones have been filled, suggesting buying pressure is absorbing supply well. Volume is also slightly increasing at the lows – indicating selling pressure is weakening.
If BTC holds above 111,000, a move toward 117,500 is likely, with potential to reach 120,000 if it breaks above the descending channel. This would confirm a clearer medium-term uptrend.

EURUSD – Bottoming out, poised for breakoutAfter a sharp decline since late July, EURUSD is consolidating around the key support zone of 1.1520–1.1580. On the H4 chart, price remains within a descending channel but is beginning to form a compression pattern — often a precursor to a strong breakout. Bullish momentum is building as price rebounds from the 1.1480 low and holds a modest upward bias.
On the macro front, the USD is weakening as markets increasingly expect the Fed to cut interest rates in September, especially after a string of weak labor data. In contrast, the EUR is supported by stable inflation and the ECB’s persistent hawkish stance. If the current support zone holds, EURUSD could break out of the descending channel and target the resistance levels at 1.1680 and 1.1770.

Gold Explodes: Will the Uptrend Continue?News Background:
Recent weak U.S. job data has fueled expectations that the Fed will cut interest rates in September, weakening the USD and bond yields, making gold more attractive. Additionally, trade tensions between the U.S. and India have increased uncertainty, driving capital flows into gold.
Technical Chart:
Resistance: 3,450 USD is a key resistance level. If broken, the price could continue to rise towards 3,500 USD.
Support: 3,360 USD is the nearest support level. A drop below this could lead to a pullback to 3,320 USD.
RSI: Currently at 64.11, close to overbought territory, but not yet too high, suggesting the uptrend could still continue.
Outlook:
Bullish scenario: If 3,450 USD is broken, the price could reach 3,500 USD.
Bearish scenario: If 3,360 USD cannot hold, a pullback to 3,320 USD is possible.

Asian Paints | Cup & Handle Breakout Building Momentum
Description:
Asian Paints is forming a classic cup and handle on the daily chart, supported by a rounded bottom structure on the weekly. Price is attempting to breakout above ₹2500, with positive EFI and upward momentum.
📌 Breakout Level: ₹2500
📉 Stoploss: ₹2449 (ATR-based)
🎯 Targets: ₹2749 → ₹2886 → ₹3108 (Fibonacci extension)
🧭 Macro Context:
- Stable inflation and INR
- Improving margin outlook for the sector
- Paint stocks showing strength post consolidation
Strong price-action setup supported by fundamentals and structure.

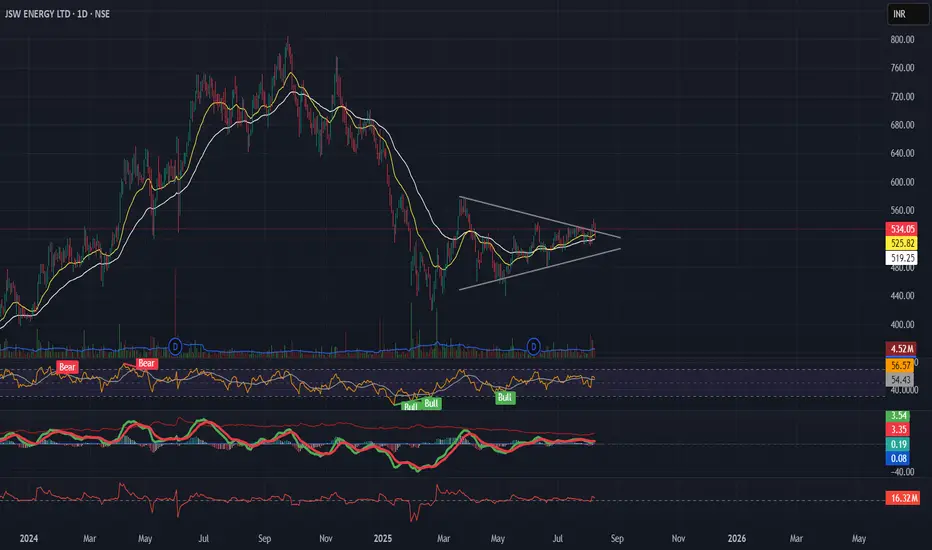
JSWENERGY | Symmetrical Triangle Breakout in Progress?Description:
JSW Energy is forming a symmetrical triangle on the daily chart after a downtrend — resembling a potential bearish pennant, but price structure, sloping EMAs, rising momentum, and positive EFI hint at bullish strength.
📌 Breakout Level: ₹534
📉 Stoploss: ₹519 (ATR-based)
🎯 Targets: ₹563 → ₹597 → ₹694 (as per Fib projections)
🧭 Macro Context:
- Infra & Energy sectors improving
- Govt push for renewables
- Dollar weakening, risk-on tone aiding sentiment
Structure, volume, and macro are aligned — tracking this breakout closely.
UltraTech Cement | Pullback Opportunity after Breakout?Description:
- After breaking out of a consolidation zone, UltraTech Cement is showing a controlled throwback towards prior resistance, now acting as support.
- Weekly structure remains intact with sloping EMAs and positive momentum.
- Daily & Hourly charts show minor weakness but no structural breakdown.
- EFI suggests lower TF selling pressure, while weekly remains stable.
📌 Entry Zone: ₹12,037
📉 Stoploss: ₹11,850 (ATR-based)
🎯 Targets: ₹12,937 → ₹13,139 → ₹13,427
Cement sector is gaining strength in the broader infra rally — watching for confirmation on bounce from support.

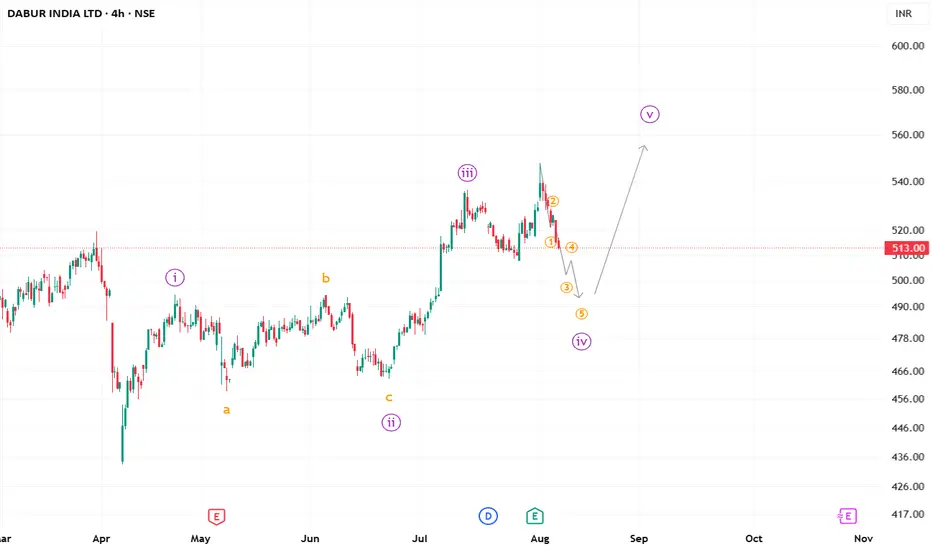
#Dabur ending correction soon?Dabur can be a good pick if you are looking for some medium-term investment in sometime, as the ongoing correction looks to be in the last stage of it impulse.
We may then possible see it soaring higher.
P.S. Always trade on price confirmation.
**This is an educational market outlook, not investment advice. Please consult a SEBI-registered advisor before taking any investment decisions.**
Is gold back on track?Gold is making a strong recovery from the 3,365 USD support zone and is now hovering around 3,380 USD. After a brief correction, the price has bounced back and is heading toward the key resistance area at 3,396 USD. A breakout above this level would likely open the door for a further move toward the 3,428 USD target.
The bullish sentiment is supported by weaker-than-expected U.S. employment data, which has raised expectations that the Federal Reserve (Fed) may cut interest rates sooner. This is boosting demand for gold as a safe-haven asset.
The short-term trend now leans bullish, as long as the price holds above the 3,365 support. A confirmed breakout above 3,396 could be the signal for the next leg higher.

EURUSD – bearish trend remains dominantEURUSD is trading within a clearly defined descending channel. After a slight rebound from the 1.14800 support zone, the price is now retesting the resistance area around 1.16000 – a zone filled with multiple previous Fair Value Gaps (FVGs). If the price fails to break above this level, the bearish trend is likely to continue with a potential move down toward 1.14000.
Latest news:
Weaker-than-expected US job data initially pressured the USD, but growing expectations that the Fed will maintain its tightening stance are helping the dollar recover – putting downward pressure on the euro.
Summary:
If EURUSD fails to break above 1.16000, a continuation of the downtrend toward 1.14000 is likely in the coming days.
