BTCUSDT – Bullish trend remains intactBitcoin is still trading within a long-term ascending channel. After a mild pullback to the FVG zone around 112,100 USDT, the price rebounded and is now consolidating above the ascending trendline support. If this level holds, BTC is likely to continue toward the upper channel target at 122,500 USDT.
Recent news supporting the uptrend:
Fidelity and BlackRock have continued accumulating Bitcoin-related ETF shares.
Weak US jobs data has fueled expectations of a Fed rate cut, drawing capital back into crypto.
Ethereum's upcoming hard fork upgrade is boosting overall market sentiment.
With both technical structure and fundamentals aligned, BTC remains bullish as long as it stays above 112,100.
Longsetup

EURUSD remains in a downtrendEUR/USD continues to move within a descending channel, with the 1.1600 area acting as strong resistance. Recent price action suggests the current rebound may be just a retest before the downtrend resumes. The next bearish target is around the 1.1390 support zone.
On the news front, although a strong U.S. PMI puts slight pressure on EUR, the USD faces mixed forces:
Weak NFP data increases expectations of a Fed rate cut.
The new US–EU trade deal imposing a 15% tariff has sharply weakened the euro.
Eurozone PMI improved but remains below 50, indicating a still-fragile recovery.

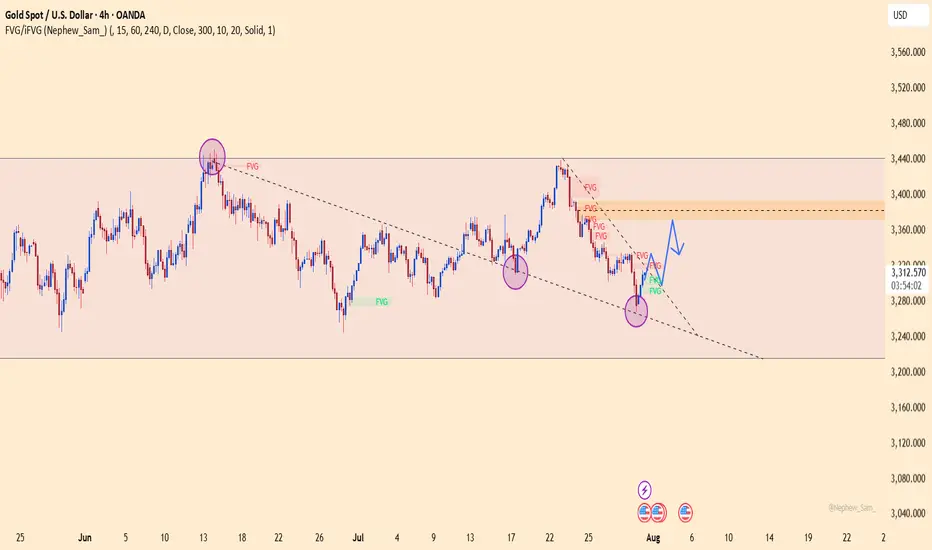
XAUUSD awaits breakout at confluence zoneGold is consolidating around 3,361 USD after a strong rebound from the key support zone at 3,284 USD — previously a major swing low in the existing bullish structure. Recent price action on the H4 timeframe is forming a potential Cup and Handle pattern, indicating that buying pressure remains present after each retracement.
The 3,351 USD resistance area now acts as a confluence zone, where the descending trendline from July intersects with a key horizontal level. Price behavior at this zone will likely determine the next directional move. A successful breakout would confirm the bullish continuation structure, with room to revisit the previous highs.
Current technical signals suggest that buyers are gradually regaining control, as higher lows emerge and upward momentum builds from the major support area.

maintain uptrend, buy gold 3350Plan XAU day: 04 August 2025
Related Information:!!!
Gold prices (XAU/USD) retain a subdued tone during the first half of the European session on Monday, although the absence of sustained selling pressure keeps the metal within reach of the one-week high recorded earlier in the day. The US Dollar (USD) begins the new week with a modest recovery, partially retracing Friday’s decline triggered by softer-than-expected US employment data, supported in part by a rebound in US Treasury yields. This recovery exerts downward pressure on demand for the precious metal.
Nevertheless, the USD's upside remains limited amid increasing expectations that the Federal Reserve (Fed) will resume interest rate cuts as early as September. This anticipation continues to provide support for the non-yielding yellow metal. In addition, a broadly cautious market mood—driven by persistent trade uncertainties and heightened geopolitical tensions—reinforces the appeal of Gold as a safe-haven asset and advises restraint among bearish market participants
personal opinion:!!!
Accumulated price zone around 3350 - 3364, buying power maintained. Gold buying point following the uptrend line today
Important price zone to consider : !!!
Support zone point: 3350 zone
Sustainable trading to beat the market

Reliance (RIL) Long Trade SetupReliance looks very promising on the daily chart. The stop loss is very close and the target is very far off. Though it has not given a buy signal yet, but I am still jumping on to it because once the buy signal is confirmed, everybody will jump in, the algos will jump in and the buy price then would not be as good as now. Use your discretion if following this.

XAUUSD – Gold accelerates: Is the 3,600 target within reach?Gold has made an impressive rally of nearly 720 pips, surging from the recent bottom near 3,260 up to 3,365, following a deeply disappointing U.S. jobs report. Non-Farm Payrolls came in at just 106K, far below expectations, while the unemployment rate climbed to 4.2% — a clear sign that the U.S. economy is slowing down. In this context, the expectation that the Fed will pause rate hikes has become more solid, paving the way for gold to break higher.
Technical analysis on the D1 timeframe shows that XAUUSD remains in a well-established ascending channel that has persisted since late 2024. The recent bounce from the 3,260 support zone was strong, with yesterday's bullish candle confirming that buyers are regaining control.
As long as price holds above the 3,260 support area, the next target lies at the psychological resistance around 3,500, and beyond that — the ambitious 3,600 mark.

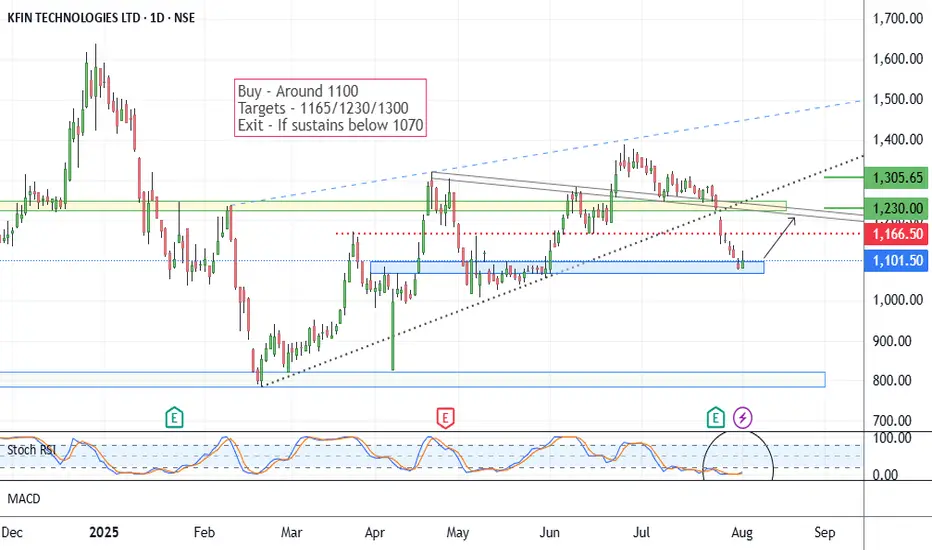
Kfintech - Positional Long SetupIn the last month of July, the stock price fell from 1380 to 1100. Presently seems on a support area. As you may see on the chart. This setup is based on a reversal possibility from the support range around 1080.
Stochastic RSI shows a reversal sign.
Possible targets may be 1165/1230 and 1305.
If it sustains below 1070-1050 levels, the setup will go weak. Below 1070, the exit plan should be considered.
One has to keep the position size according to the risk management.
All these illustrations are my personal view, only for learning and observation purposes; this is not buying or selling advice.
All the best.
BTCUSDT – Bitcoin consolidates amid silent institutional buying Bitcoin is fluctuating between 114K and 116K USDT within a long-term ascending channel, supported by a wave of positive news. Weaker-than-expected U.S. labor data has fueled hopes that the Fed may pause its rate hikes — boosting sentiment for risk assets like BTC.
At the same time, major regulatory developments such as the SEC’s “Project Crypto” and the GENIUS Act by the CFTC are laying the groundwork for legalizing the crypto market. Notably, over 30,000 BTC were accumulated by MicroStrategy and institutional funds within just 48 hours — signaling strong capital inflows.
On the daily chart, BTC is forming an inverse cup-and-handle pattern, with 107,280 acting as key support. If the price holds and breaks above 120,872 USDT, a rally toward 130K may follow. However, if inflows weaken, a short-term pullback toward 112K could occur before the next upward move.

EURUSD – Euro tumbles under strong dollar pressureAfter a brief uptick following the US–EU trade agreement, EUR/USD quickly sank under a wave of strong US economic data. While import tariffs on EU goods were reduced to 15%, the US dollar gained more as capital kept flowing into the US thanks to a Q2 GDP growth above 3%, steady PCE, and a strong ADP report.
On the H4 chart, the bearish structure is clear: EUR/USD broke below key support and formed a series of unfilled FVGs, signaling sellers are still in control. The current pullback towards the 1.14300 resistance zone could act as a bull trap, with the next target eyed near 1.12300 — a likely liquidity zone.
If this area breaks, the 1.1200 mark may be triggered next. Meanwhile, USD strength shows no signs of fading — especially as the Fed maintains a cautious stance with no easing in sight. The euro is no longer seen as a safe haven, and investors are gradually pulling out.

XAUUSD – Gold jumps as weak US job data boosts bullish sentimentGold prices reacted positively after the US Non-Farm Payrolls came in at only 106K and the unemployment rate rose to 4.2%, signaling a cooling labor market. This weak data has lowered expectations of further rate hikes from the Fed, offering strong support for gold.
On the H4 chart, XAUUSD has formed a bottom around the 3,247 area and is now rebounding within a descending channel. A slight trendline break and a W-pattern near the bottom further reinforce the potential for a continued upward move.
Technical view:
XAUUSD is approaching a key resistance zone around 3,313 – a crucial level that could trigger a breakout. If gold breaks above it with strong buying pressure, it may head toward the upper boundary of the channel.
The RSI is recovering from oversold levels, while EMA34 and EMA89 are starting to converge – suggesting a possible trend reversal ahead.

BSE Long Trade SetupBSE is looking good for a short term long trade. Got hold of this while I was looking through stocks thrown up by my scanner. The Stop Loss levels are indicated in the video. If you find it breaching the higher levels as indicated in the video, a long position can be taken and then trailed. Happy Trading.

XAUUSD – Gold may plunge if key support failsHello traders! Gold continues to move within a clear descending channel and is currently retesting the previous support zone around 3,295.600. The RSI remains weak, and the EMA 34 stays below the EMA 89, confirming that the bearish trend is still dominant.
On the news front, U.S. labor costs have exceeded expectations, the Fed held rates steady, and there’s no sign of a dovish shift. This continues to strengthen the USD and puts pressure on gold. Investors are now awaiting Powell’s speech at tonight’s FOMC meeting—if his tone remains hawkish, gold is likely to face further downside.
Trading strategy:
If price retraces to the 3,350 – 3,371 zone and shows rejection or reversal signals, SELL remains the preferred option.
ES1- Reversal After Extended SelloffPrice has experienced a clean, directional drop with consistent Sell signals and EMA slope confirmation.
Current Buy signal has appeared near potential support, offering a short-term reversal watch.
EMAs still show downward pressure, so caution is warranted until breakout confirmation occurs.
🔍 Educational Setup Observation:
Observed Entry Zone: Near 6,408.00
Stop Level: Below 6,399.25 (below structural low)
Potential Target Area: 6,442.75 — prior imbalance and reaction zone
🧠 SignalPro Highlights:
This is the first Buy signal after a strong sell sequence — often used as a potential momentum shift marker.
Short-term reversal setups like this often require clear candle confirmation above moving averages to validate direction.
⚠️ This chart and setup is for educational purposes only. It is not financial advice. Always conduct your own due diligence and apply proper risk management.

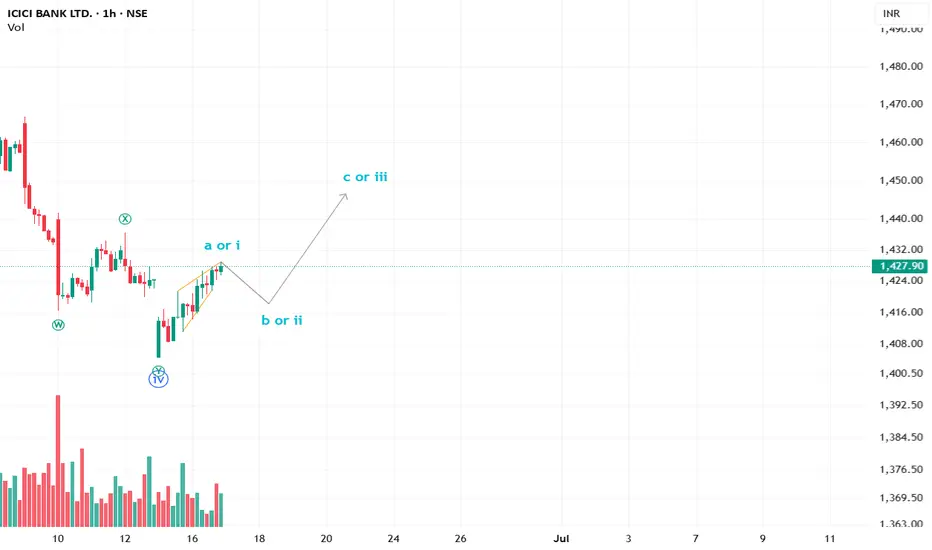
ICICIBANK can follow this path? Clues on the wayA beautiful leading diagonal in ICICI bank reflecting Wave a or i. We can see a minor downside tomorrow and an upside short-term move for a good options trade.
XAUUSD – The Weakness of Gold – Are Investors Ready?Gold is being heavily impacted by the strengthening of the US dollar, driven by recently released economic data from the US. A strong increase in employment and a 2.5% GDP growth show that the US economy is growing stronger than expected, pushing the US dollar higher and creating downward pressure on gold.
The chart shows that gold is trading within a downward price channel, with key support and resistance levels already identified. The strong resistance at 3,345 USD continues to be a major challenge for any upward movement in gold.
If gold cannot break through these resistance levels and continues to decline below 3,310 USD, we may see a deeper correction.

EURUSD: Short-term rebound signals after sharp dropEURUSD has just reacted to a key demand zone and is showing signs of a technical rebound. A small double bottom pattern is forming on the 3H chart, indicating that buyers are starting to return. If the price holds above this recent low, the short-term bullish scenario could continue.
On the news front, the US JOLTS data came in lower than expected, reflecting a cooling labor market. This reduces the likelihood of further Fed tightening, creating room for the euro to recover slightly.
Strategy: Favor buying if price remains above the support zone, with a potential move to retest the upper FVG area before the market makes its next decision.

Gold rebounds – Enough to shift the trend?Gold is trading within an ascending channel, recently bouncing modestly from the trendline after a series of declines. The structure suggests XAUUSD could continue a technical rebound toward the resistance zone near 3,374 before a new trend is confirmed.
On the news front, JOLTS job openings came in slightly below expectations, indicating a cooling U.S. labor market. This offers mild support for gold, as the Fed may consider easing policy sooner. However, with the figure still above 7 million, the impact remains short-term.
Strategy: Watch price reaction near the 3,374 zone. If it fails to break through, the bearish scenario remains dominant. Short-term buying may be considered as long as the trendline holds.

BTCUSDT – short-term pullback before heading higherBTCUSDT remains within a clear ascending channel. On the H8 timeframe, price is facing resistance and may pull back toward lower support before continuing its upward move. Several Fair Value Gaps below act as strong backing zones for buyers.
On the news side, market sentiment is improving as investors anticipate the upcoming PCE report and renewed interest in Bitcoin ETFs. Although the Fed holds its hawkish tone, rising recession risks are fueling expectations of a rate cut later this year.
Strategy: Consider BUY setups if price pulls back into support and shows strong reaction. Trend remains bullish unless the ascending structure is broken.

Gold plunges as Fed stays firm, war fails to boost XAUUSD is showing clear signs of weakness after peaking at 3,375 and consistently forming lower highs. On the H2 chart, the price action confirms a completed distribution pattern and is now consolidating ahead of a potential breakdown below 3,283.
News highlights:
The US ADP and GDP reports exceeded expectations, strengthening the case for the Fed to keep interest rates higher for longer – putting significant pressure on gold.
Although the JOLTS job openings dipped slightly, the figure remains above 7 million, offering little support for gold recovery.
Conflict news between Thailand and Cambodia might offer some support, but the impact is limited due to the small regional scale.
Trading strategy: Prioritize SELL if price pulls back to 3,339 and fails to hold. The next target is around 3,252.
The main trend remains bearish unless XAUUSD breaks above 3,360.
Do you think XAUUSD will break the bottom this week?

Dalmia Bharat: long 2120-2100 stop 2090 Keep eyes on the "Dalmia Bharat" : go long 2120-2100 stop 2090
Eying 2670..2900 in 4- 5 months

EURUSD – Bullish momentum fades, signs of a reversal emergeEURUSD is approaching the key resistance zone at 1.1780, a level that has been rejected multiple times in the past. On the H4 chart, the pair remains firmly within a descending channel since early July, with several FVG zones stacked above—indicating growing selling pressure. The recent upside momentum is clearly weakening, raising the risk of a deeper pullback.
Market context:
– The US dollar continues to gain support from strong economic data, while the Eurozone lacks clear signs of recovery.
– Traders are holding their breath ahead of upcoming Eurozone inflation data and the US PCE report—events that could trigger significant moves.
Trade setup: If EURUSD fails to break above 1.1780, a drop toward the 1.1610 support zone becomes increasingly likely.

XAUUSD – final bounce before the drop?Gold is trapped in a sideways box, and the bounce from the $3,330 zone looks like nothing more than a technical reaction – with no strong buying momentum. The dense cluster of FVGs signals that selling pressure hasn’t been fully absorbed yet.
Fresh data from the U.S. strengthens the bearish case: jobless claims have hit a 3-month low, indicating a resilient labor market. This paves the way for the Fed to keep rates steady at 4.25–4.50%. Meanwhile, Trump’s tariff policies are stoking inflation risks.
If gold fails to break above $3,437 in the next few sessions, sellers may step in aggressively. In that case, the next target could be $3,280.

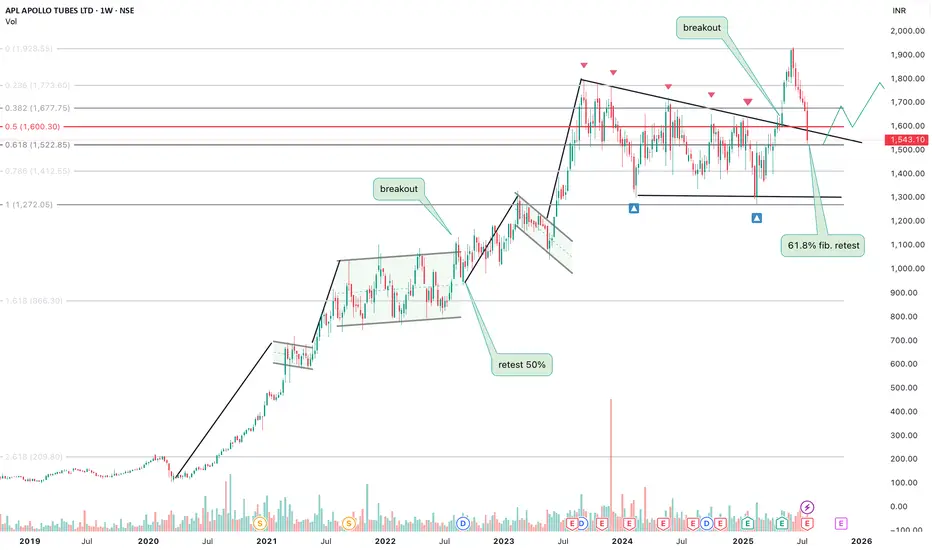
apollo tubes longThe chart has repeated its pattern of consolidation followed by breakout and retest .
we can expect a good upside momentum as it has completed its 0.618% retracement based on earlier chart formations.
the financials and companies growth looks great with increasing revenues and profits.
let me know what you investors feel in the comment.