GBPCHF - CORRECTION NEAR EXHAUSTION?Symbol - GBPCHF
GBPCHF continues its corrective move, forming lower lows amid ongoing macroeconomic uncertainty and concerns related to US policy. GBPCHF remains within a bearish structure but is now approaching a key demand zone around 1.0555 – 1.0530, where buying interest could potentially emerge.
Despite the prevailing downside momentum, the pair is nearing an area that could attract bullish participation. If buyers manage to defend this demand zone, a meaningful rebound from these levels may follow.
Resistance levels: 1.0600, 1.0647, 1.0685
Support levels: 1.0560, 1.0535
If the price fails to hold above the current support and liquidity zone shown on the chart, another wave of selling pressure could develop. However, given the broader market context, the likelihood of a deeper decline appears limited.
Longtradeidea

MPHASIS - TRADE OPPORTUNITY ON LONG SIDESymbol - MPHASIS
CMP - 2251
Mphasis, a global provider of Information Technology solutions specializing in cloud and cognitive services, leverages next-generation technology to assist enterprises in transforming their businesses worldwide.
Recently, Mphasis has experienced a decline due to selling pressures in Nasdaq and U.S. IT stocks, as well as negative data and news flow related to the IT sector. Currently, Mphasis is approaching a crucial support zone in the range of 2250–2180 which has held since July 2023
I anticipate a significant rebound from this level, which is why I am entering long positions in Mphasis Futures at the current market price of 2251. Should the price reach the 2200 range, I will consider adding additional positions. To manage risk, my stop-loss is set at 2170, providing protection in case the support zone fails to hold and the price moves lower. On the upside, I am targeting price levels of 2400 and 2500
Disclaimer: The information provided here should not be construed as a buy or sell recommendation. It reflects my personal analysis and my trading position. Please consider this trading idea for educational purposes only. Thank you!

TATA COMMUNICATIONS - TRADING AT MAJOR SUPPORT ZONESymbol - TATACOMM
CMP - 1388
Tata Communications Ltd. has shown weakness over the past few months, with the overall technical structure indicating a bearish outlook. However, the stock has recently reached a major demand zone, which lies between the 1380-1350 range, a level that has held significant support in previous price actions since 2021. This zone could act as a strong demand area, potentially offering a good trading opportunity at current prices.
The stock has been under selling pressure in the short term, but as it approaches this demand zone, the probability of a reversal or at least a short-term bounce increases. The technical indicators suggest that the stock is at a crucial level where the demand could pick up, leading to a possible upward movement from current levels. Although the broader trend has been bearish, the price action near this support level creates an attractive risk-reward setup.
Given the recent price action, I am taking long positions in TATACOMM Futures at 1388. I will look to add more positions if the price reaches 1360-1350 range. My SL is set at 1325 to manage risk, ensuring protection in case the price fails to hold the demand zone and continues lower.
The target I am expecting is 1520, which represents more than a 10% upside from current levels. This target aligns with previous resistance areas and the potential for a bullish move once the stock stabilizes at the demand zone.
Disclaimer: The information provided here should not be construed as a buy or sell recommendation. It reflects my personal analysis and my trading position. Please consider this trading idea for educational purposes only. Thank you!

CADCHF - TRADE ON LONG SIDESymbol - CADCHF
CADCHF is currently trading at 0.65000
I'm seeing a trading opportunity on buy side.
Buying CADCHF pair at CMP 0.65000
I will be adding more if 0.64500 comes & will hold with SL of 0.63900
Targets I'm expecting are 0.66100 & 0.66480
Disclaimer - Do not consider this as a buy/sell recommendation. I'm sharing my analysis & my trading position. You can track it for educational purposes. Thanks!

HCL TECH - SWING TRADE ON LONG SIDESymbol - HCLTECH
HCL Tech is currently trading at 1360
1300 - 1360 is a good support area for HCL Technologies Ltd.
I'm seeing a trading opportunity on buy side.
Buying HCL Tech Futures at CMP 1360
I will be adding more if 1330 comes & hold with SL of 1295
Targets I'm expecting are 1440 - 1485 & beyond.
Disclaimer - Do not consider this as a buy/sell recommendation. I'm sharing my analysis & my trading position. You can track it for educational purposes. Thanks!

SWING TRADE IDEA - BATA INDIASymbol - BATAINDIA
BATAINDIA is currently trading at 1340
1280 - 1350 is a good support area for BATAINDIA.
I'm seeing a trading opportunity on buy side.
Buying BATAINDIA Futures at CMP 1340
I will be adding more if 1300 comes & hold with 1280 SL.
Targets I'm expecting are 1435 - 1525 & beyond.
Disclaimer - Do not consider this as a buy/sell recommendation. I'm sharing my analysis & my trading position. You can track it for educational purposes. Thanks!

EURPLN - Long Opportunity in Forex!Currency Pair - EURPLN
I am seeing a good trading opportunity in EURPLN.
Taking long positions here at CMP 4.28325
My SL would be 4.27300
Target I'm expecting is 4.34500 - 4.35000
That's 1:6 RR trade.
Disclaimer - Do not consider this as a buy/sell recommendation. I'm sharing my analysis & my trading position. You can track it for educational purposes. Thanks!

EIHOTEL go long if Crossed 242.55
Entry : 242.60
Stop loss : 224.90
Target : 276.50
NOT SEBI REGISTERED, do your own analysis before taking trade


Kotak Mahindra Bank is about to break All time High (Resistance)Kotak Mahindra Bank is about to break All time High (Resistance)
One can go long after breaking all time high with small stoploss

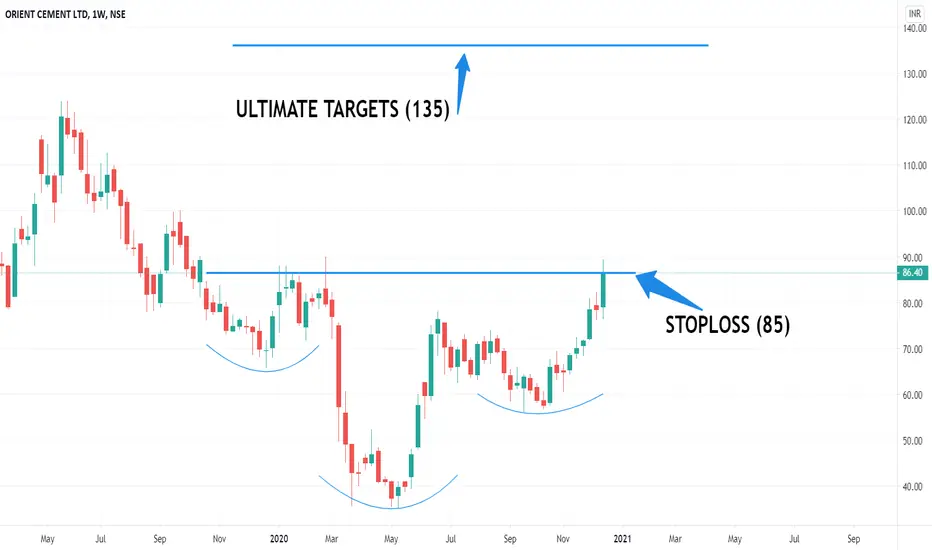
ANOTHER INVERSE HEAD AND SHOULDERS, POSSIBLE BREAKOUT OVER CMP!!As clearly seen, stock has completed the inverse head and shoulders pattern on weekly charts and is ready to give a breakout if it breaches the current market price. Fresh position can be taken on these levels with the stop-loss of 85 for the targets of 135 from here.
JUST ON THE VERGE OF A BREAKOUT ON A WEEKLY CHARTS!!!JTEKTINDIA: Has consolidated on lower levels and indicating for a big breakout completing inverse head and shoulder formation with a perfect bullish candle on the weekly charts. Can be bought here if the stock surpasses the current levels, with the targets of 145.

Siemens India: Looking for an early break out from the triangle After the block deal of share transfer between the holding entities, Siemens India rallied and consolidated near the upper trend line of the triangle pattern.
On 03 July 2020, long green candle was formed in day chart above the upper trend line of the triangle pattern. Volume saw a huge spike indicating a big money move.
If the price sustains above the upper trend line of the triangle pattern with a considerable volume, it would be an early break out and the erst while upper trend line will turn to be a support line.
In case of early break out, buy near 1135 during a surge after a pull back to 1120 levels.
1st Target - 1200-1230; 2nd target - 1250-1270
SL - 1105.
Indicators:
1. MACD has a positive crossover and looking for a divergence
2. ADX indicate strength of the upward move
3. Price crossed and closed above 200 EMA and 20 and 50 EMA point upwards.
4. RSI not yet in overbought zone
Caution: Since this is an early break-out without any strong fundamental news, respect the SL
