Litecoin Super potential toward $300?Real Silver is Up +180% YTD 2025 & Digital Silver ( CRYPTOCAP:LTC ) is Down -44% YTD 2025
That Gap is Getting Impossible to Ignore.
When Real Silver is Pumping Hard but Digital Silver is Sleeping, it Usually Doesn’t Last Forever.
If the Rotation Happens in 2026, CRYPTOCAP:LTC at $250–$300 is Very Realistic.
Now Litecoin has One Job: Prove it Truly is Digital Silver.
NFA & DYOR
LTCUSDT

Is $LTC Dead? The Same Question Asked Before Every Major Rally…Is CRYPTOCAP:LTC Dead? The Same Question Asked Before Every Major Rally…
When markets forget history, they repeat it. Litecoin has gone through multiple full-cycle Retracements, Each time followed by explosive multi-X expansions. Let’s walk through the data:
🔰 2013–2015 Cycle: “LTC is Dead” #1
🔹 LTC hit an ATH of $55 from $1.
🔹 Retraced ~98%, bottoming at $0.985 within 16 months.
🔹 Retail sentiment: “LTC is dead.”
🔹 Smart money quietly accumulated.
Result?
$0.985 → $9 in 4 months (≈ +900%)
Eventually: $0.985 → $370 in 3 years (≈ +37,000%)
🔰 2017–2018 Cycle: “LTC is Dead” #2
🔹 New ATH: $370
🔹 Retracement: 92%, down to $23
🔹 Again: retail capitulation.
Result?
$23 → $146 in 6 months
$23 → $413 by May 2021 (≈ +1700%)
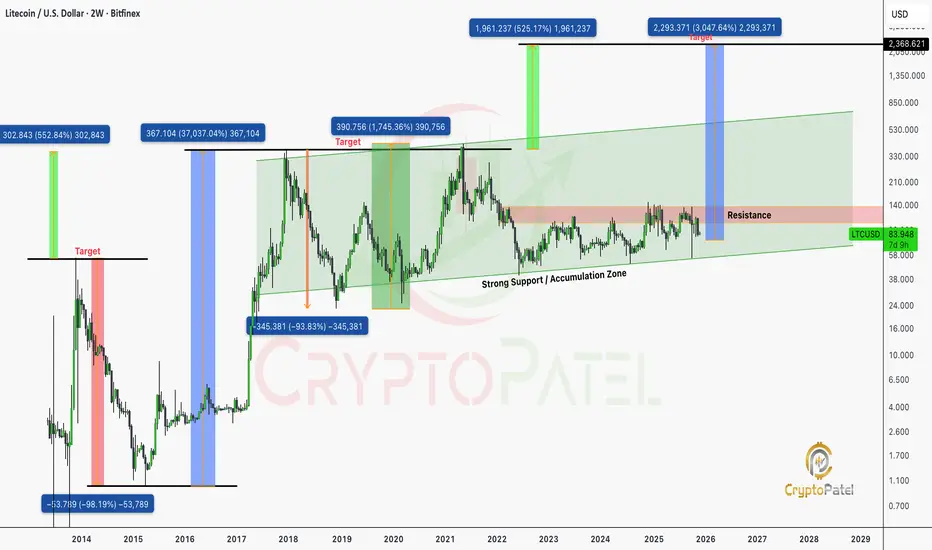
🔰 Current Market Structure (2021–2025)
🔹 Previous ATH: $413 (May 2021)
🔹 Current price: ~$84
🔹 Drawdown: 80%
Retail narrative: “LTC is dead.”
TA narrative: This is historically the accumulation zone.
Technical Outlook (Cycle-Based TA Projection)
Every prior deep-cycle retracement (80–98%) has led to:
🔹 Fresh multi-year impulse waves
🔹 New macro highs
🔹 Massive ROI expansion for accumulator wallets
Based strictly on historical cycle symmetry, volatility bands, and LTC’s halving-driven structure:
LTC Bull-Run Projection:
$600 – $1,000 is a reasonable and technically sound target range for the current macro cycle.
This would represent:
🔹 Breaking the 2021 high
🔹 Completing a full 5-wave macro structure
🔹 Returning to historical expansion ratios seen in every prior cycle
So You Already Know What Happens Next.
Litecoin’s entire history is built on max pain → max gain cycles.
Every 80–98% retracement has delivered its largest multi-X rallies after retail gave up.
Smart investors accumulate when the chart says accumulate, not when the crowd screams “dead.”
FINAL MESSAGE
LTC is not dead. It is in the same deep-value zone where every previous mega-cycle began.
If the market delivers another historical impulse, the $600–$1000 range remains a technically justified target.
Accumulate dips.
Ignore noise.
Let the chart speak.
Not Financial Advice so Always Do your Own Research Before Any Investments.
Is $LTC Dead? The Same Question Asked Before Every Major Rally…Is NYSE:LTC Dead? The Same Question Asked Before Every Major Rally…
When markets forget history, they repeat it. Litecoin has gone through multiple full-cycle Retracements, Each time followed by explosive multi-X expansions. Let’s walk through the data:
🔰 2013–2015 Cycle: “LTC is Dead” #1
🔹 LTC hit an ATH of $55 from $1.
🔹 Retraced ~98%, bottoming at $0.985 within 16 months.
🔹 Retail sentiment: “LTC is dead.”
🔹 Smart money quietly accumulated.
Result?
$0.985 → $9 in 4 months (≈ +900%)
Eventually: $0.985 → $370 in 3 years (≈ +37,000%)
🔰 2017–2018 Cycle: “LTC is Dead” #2
🔹 New ATH: $370
🔹 Retracement: 92%, down to $23
🔹 Again: retail capitulation.
Result?
$23 → $146 in 6 months
$23 → $413 by May 2021 (≈ +1700%)
🔰 Current Market Structure (2021–2025)
🔹 Previous ATH: $413 (May 2021)
🔹 Current price: ~$84
🔹 Drawdown: 80%
Retail narrative: “LTC is dead.”
TA narrative: This is historically the accumulation zone.
Technical Outlook (Cycle-Based TA Projection)
Every prior deep-cycle retracement (80–98%) has led to:
🔹 Fresh multi-year impulse waves
🔹 New macro highs
🔹 Massive ROI expansion for accumulator wallets
Based strictly on historical cycle symmetry, volatility bands, and LTC’s halving-driven structure:
LTC Bull-Run Projection:
$600 – $1,000 is a reasonable and technically sound target range for the current macro cycle.
This would represent:
🔹 Breaking the 2021 high
🔹 Completing a full 5-wave macro structure
🔹 Returning to historical expansion ratios seen in every prior cycle
So You Already Know What Happens Next.
Litecoin’s entire history is built on max pain → max gain cycles.
Every 80–98% retracement has delivered its largest multi-X rallies after retail gave up.
Smart investors accumulate when the chart says accumulate, not when the crowd screams “dead.”
FINAL MESSAGE
LTC is not dead. It is in the same deep-value zone where every previous mega-cycle began.
If the market delivers another historical impulse, the $600–$1000 range remains a technically justified target.
Accumulate dips.
Ignore noise.
Let the chart speak.
Not Financial Advice so Always Do your Own Research Before Any Investments.

$LTC to $500–$1000? Could Explode in the Next Alt SeasonCRYPTOCAP:LTC to $500–$1000? Could Explode in the Next Alt Season
CRYPTOCAP:LTC has been slow-growing, but I see strong potential here. I’m holding tight.
Imo, CRYPTOCAP:LTC could easily hit $500 during the next alt season. If it drops below or near $90, that’s a solid opportunity to accumulate for long-term gains.
A 10x from here isn’t impossible: $500–$1000 is within reach, but it will require patience.
Worth noting: CRYPTOCAP:LTC didn’t hit a new ATH after the 3rd halving, unlike the first two, which reached new highs within about 1000 days. This suggests there’s still a real chance for CRYPTOCAP:LTC to hit a new ATH within the next one Year.
Stay patient, plan your entries, and don’t get caught up in FOMO.
⚠️ Disclaimer: NFA. Crypto is risky. DYOR and only invest what you can afford to lose.

$LTC ACCUMULATION PHASE IS OVER: Ready to $500?🚨 CRYPTOCAP:LTC ACCUMULATION PHASE IS OVER 🚨
✅ Strong bounce from 7-YEAR trend line support
✅ Soon Break out 4-YEAR descending wedge
✅ Re-accumulation zone: COMPLETE
1️⃣ Target 1: $216 (+129%)
2️⃣ Target 2: $388 (+311%)
3️⃣ Target 3: $532 ALL-TIME HIGH (+464%)
👉 Last time this pattern played out = 1,596% PUMP
But yeah, keep buying at ATH 🤡
NFA & DYOR

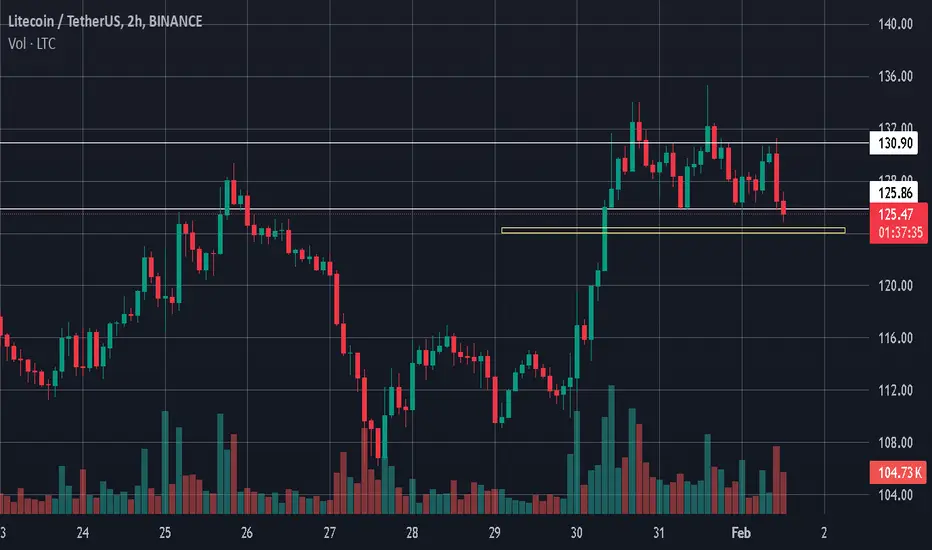
LTCUSDT - BULL TRAP IN MAKING?Symbol - LTCUSDT
CMP - 130.00
LTCUSDT is currently forming a distribution pattern following a period of local consolidation. The price is testing the resistance zone and exhibiting signs of a false breakout. However, it is important to note that the broader cryptocurrency market remains in a corrective phase.
At present, Bitcoin appears relatively weak, undergoing both a correction and short-term consolidation ahead of a potential continuation of the decline toward the 117K-116K range. Within this environment, the recent upward move in LTCUDST may be short lived and could transition into an aggressive decline if the price closes below the key resistance level.
This false breakout, or market manipulation relative to resistance, suggests that LTC’s current rally may represent a local bull trap, particularly amid broader market weakness. A breakdown could lead the pair toward the breakeven or liquidity zone between 124.10 & 115.30
Resistance levels: 132.00, 134.20
Support levels: 124.14, 115.36
A confirmed false breakout of the resistance zone, especially while the altcoin market continues to weaken, could indicate a liquidity grab prior to a deeper market alignment with Bitcoin’s broader correction. Consequently, confirmation of this pattern may serve as a signal for a potential downside move in LTCUSDT.

LTCUSDT (Crypto) Long🌎Litecoin (LTC) is a decentralized peer-to-peer cryptocurrency created in 2011 as an alternative to Bitcoin. It was designed to provide faster and cheaper transactions, positioning itself as "digital silver" to Bitcoin's "digital gold."
The primary goal of Litecoin's creation was to become a more efficient means of instant payments and transfers than Bitcoin.
Litecoin operates on the Proof-of-Work principle, like Bitcoin, but uses the Scrypt algorithm.
The Scrypt algorithm was initially chosen to counter specialized mining hardware (ASICs), keeping mining more decentralized. Although ASICs for Scrypt have been developed over time, this algorithm still requires more memory than SHA-256, which is used in Bitcoin.
The Litecoin network has successfully implemented important upgrades such as Segregated Witness (SegWit) and the Lightning Network, which increase throughput and enable instant microtransactions.
Litecoin has a stated maximum supply of 84 million LTC, four times greater than Bitcoin.
Litecoin block times and transactions are confirmed significantly faster than Bitcoin. This, along with a less congested network, results in very low fees.
A growing number of merchants accepting LTC and integration with payment systems (such as the partnership with Spend)
Litecoin's partnership with the Spend platform (also known as SPEDN by Flexa) was part of a broader integration aimed at making spending Litecoin and other cryptocurrencies in everyday life simple and instant.
This partnership was a joint effort between several parties: the Litecoin Foundation, Nexus Wallet, and the Flexa payment network, which operates the SPEDN app.
At the peak of the partnership, the Flexa network included over 41,000 merchants, primarily in North America, where SPEDN payments were accepted. Here are some well-known companies that accepted payments through this system:
Lowe's, Petco, GameStop, Bed Bath & Beyond, Nordstrom
Why this partnership was important:
It directly linked digital currency to real goods and services.
It also clearly demonstrated Litecoin's advantages—speed (2.5 minutes per block) and low fees.
Today, the SPEDN app is no longer available, but the Flexa payment network itself continues to operate and develop other solutions. Litecoin remains available for spending—through other services, such as BitPay (crypto debit cards and gift cards) or directly at a growing number of online and offline merchants.
In investing and trading, we treat cryptocurrencies as an asset class tied to a risk-on/risk-off regime, only with added variance, like on steroids, so to speak.
Currently, the markets are in risk-on mode, and number of factors point to the beginning of altcoin season.

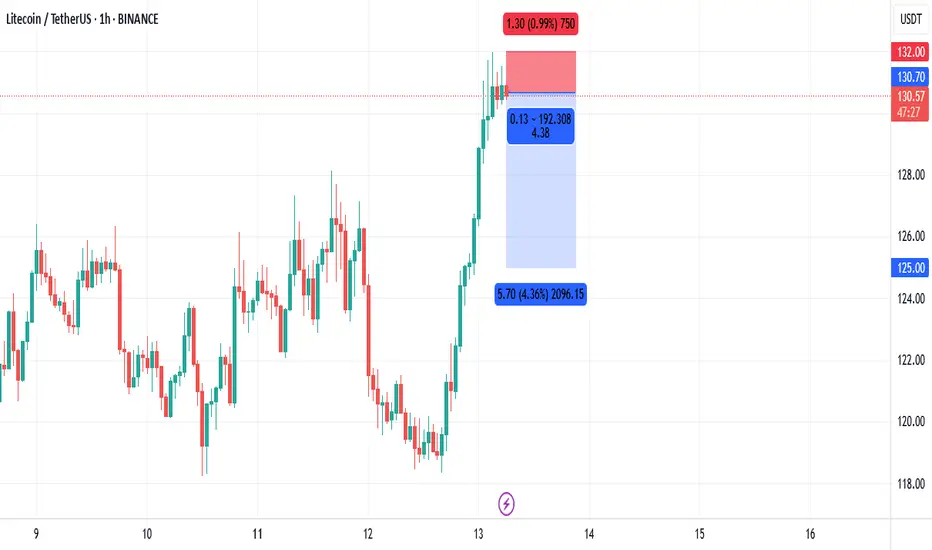
Litecoin-LTCUSDT Short Position LevelsThe Relative Strength Index (RSI) is softening from overbought levels, which could indicate a short-term correction is on the horizon. A failure to hold the $125-121 support level could trigger a move lower.
Entry-$137.70
SL-$139
TP1-$125
TP2-$120
will $LTC/USDT ready for $500 in bull run?CRYPTOCAP:LTC Took Off from $55 — Now Gaining Momentum Again, and $500 Might Be Closer Than You Think
CRYPTOCAP:LTC has delivered strong gains from both our entries:
✅ First entry at $55 — now up 140%
✅ Second entry at $70 — currently up 85%
Currently, CRYPTOCAP:LTC is trading around $117, sitting right at a key resistance level.
If this resistance breaks, we could see a strong rally toward $300–$500 in this bull run.
My Target:
I’m still expecting $500 as a realistic target and anything beyond that is a bonus.
NFA & DYOR

$LTC alert: perfect rebound – $200-$400 next? Don't miss it! NYSE:LTC played out exactly as expected.
It bounced perfectly from our accumulation zone between $60–$70, and is now already up 45% from our entry.
The next big Resistance at $120–$140. If that breaks, we’re eyeing targets of $200 / $300 / $400 / $500.
Yes, $1,000 is still possible, but for now, our focus is on the $500 mark — and I believe this bull run could be the one that finally takes NYSE:LTC there.
I’m confident NYSE:LTC will outperform again, just like in the previous cycles.
And let’s not forget — our very first entry was back at $50.
Are you ready for Litecoin’s next leg up? 👇
Note: NFA & DYOR

LTCUSDT SPOT BUY ZONELTCUSDT SPOT BUY ZONE
To enter a spot trade, you must first confirm that the uptrend will continue and identify which cycle’s peak this uptrend corresponds to. This helps you decide the appropriate profit-taking point.
Is the uptrend still intact?
Which cycle will form the peak of this uptrend—weekly (W), monthly (M), 3-month (3M), or daily (D1)? This is crucial for accurately identifying the peak and taking profits. If you buy aiming for a monthly peak but the price peaks on D1, it’s beneficial as it provides a new buying opportunity rather than forcing you to sell. Knowing which peak you’re following also helps you plan your capital allocation. Following a monthly peak but expecting immediate profits within a day or week is unlikely without significant luck.
You need a specific price range to decide on buying (this is your desired entry price).
You need a timing mechanism to combine with the buy price to ensure the price takes off immediately after your purchase (successful bottom identification).
For LTC, we will:
Wait to buy in the $73 range.
Wait for a “has bottom” signal on the weekly timeframe.

LTC (Litecoin) – Long Spot Entry Opportunity During RetracementLTC is currently undergoing a healthy retracement, pulling back from recent highs. Price is approaching a confluence zone of technical support, making this a high-quality setup for a spot long position.
🔹 Entry Zone:
Around $90.00
📉 50-day Moving Average
📏 38.20% Fibonacci retracement
🧱 Base of key support range
🎯 Take Profit Targets:
🥇 $105 – $115 (initial resistance / previous consolidation)
🥈 $133 – $146 (major structural resistance)
🛑 Stop Loss:
Just below $80.00 (clearly below invalidation / structure breakdown)
📌 Trade Notes:
Wait for signs of reversal confirmation near the $90 zone (e.g., bullish candlestick or RSI divergence).
Volume confirmation on the bounce will increase confidence in the setup.
Position sizing should reflect wider stop due to swing trade nature.

Major Breakout Loading? $LTC Holding Strong at Key SupportMajor Breakout Loading? NYSE:LTC Holding Strong at Key Support
NYSE:LTC is currently consolidating around the $98 level, showing a minor pullback after a failed breakout above the key resistance zone ($101–$128). This red zone has historically acted as a major supply area, rejecting price multiple times.
Key Observations:
➡️ Strong ascending trendline support remains intact since 2019.
➡️ Price retraced from resistance and is hovering near the re-entry zone ($79–$94).
➡️ If LTC reclaims $115+ with volume, a breakout towards $150–$230 is likely.
➡️ Rejection from this zone could lead to another retest of the green re-entry area.
Strategy:
➡️ Watch for bullish confirmation above $115 to aim for mid-term targets.
➡️ Aggressive buyers may consider scaling in between $79–$94 with a tight SL.
➡️ Long-term target remains around $229, $389, and beyond if macro trend continues.

LITECOIN $500 Potential In Current Bull: Detail AnalysisLITECOIN MACRO BREAKOUT – NEXT LEG INCOMING?
NYSE:LTC confirmed a breakout above its multi-year resistance line after holding the Best Accumulation Zone for months!
🔸 Support Held: ~$65
🔸 Accumulation Zone: ~$85-$65
🔸 Short-Term Target: $255/$500
🔸 Long-Term Target: $1000/$1458+
Same pattern. Same zone. Same breakout.
🔥 I’m super bullish on #Litecoin.
Yes, it has tested our patience… but one strong day in this bull market and it could smash $500.
Let’s not forget — our initial entry was around $50, and it’s still a great range to accumulate.
While $1000–$1500 may not happen this bull run, I personally believe it’s possible in the near future.
⚠️ Of course, this is not financial advice — just my personal view. Always DYOR before investing in any coin.

LTCUSDT, TRADE WISELY.Don't go blind for short following this head & shoulder pattern.
Mkt can take support from the level drawn

LTCUSDT: Will This Bullish Setup Ignite a Rally or Fade Away?Yello, Paradisers! Are you ready for what’s brewing in LTCUSDT? 👀
💎LTCUSDT is signaling potential bullish momentum, displaying a bullish Change of Character (CHoCH), a Break of Structure (BOS), breakout of resistance trendline, and the formation of an inverse head and shoulders pattern. These are key indicators suggesting a potential upward move that can't be ignored.
💎If LTCUSDT manages to break out of the current resistance zone, it would enhance the likelihood of a continued bullish push, effectively validating the current pattern.
💎However, should we see a retracement, we could anticipate a bounce from the support zone. To improve the probability on our side, looking for a bullish internal CHoCH on lower timeframes will be critical. Additionally, monitoring BTC’s price action will provide added confirmation and insights.
💎If the price breaks down and closes a candle below the support zone, it will invalidate this bullish scenario. In that case, the best course of action is to remain patient and wait for more compelling price action to form.
Trade smart and stay disciplined, Paradisers. Remember, solid analysis and strategy always outshine impulsive decisions. This is how you win in the long game.
MyCryptoParadise
iFeel the success🌴

#LTC/USDT Litecoin Price Bullish Breakout Indicates PotentialBased on the price action, it is anticipated that there will be a retest at $110 for LTC/USDT as it breaks out of the resistance trendline.

LTC: Bulls Ready to Charge! Breakout Potential Ahead 💎 LTC is poised to break multiple resistance levels, including the resistive trendline and a significant resistance zone, while also forming a bullish W pattern. This confluence of factors suggests a potential bullish move for LTC.
💎 If LTCUSDT manages to break out above the resistance level, it could pave the way for further upward movement towards subsequent resistance levels. Conversely, in the event of a pullback in price, we can anticipate a bounce from the demand zone, providing support to the bullish momentum.
💎 However, should LTCUSDT break down below the demand zone, it would be prudent to exercise caution and refrain from trading LTC in that scenario. This breakdown would signal a potential shift in market sentiment towards bearishness, warranting a reassessment of trading strategies.

Litton Ready for $1000 in bull market?#LITECOIN will pump very hard, you bid yet or not?
- CRYPTOCAP:LTC - Litecoin Price Projections:
Bullish short & long-term outlook based on Past market history.
- Price Targets:
Short-term: $500
Long-term: $1,000-$1,400
- Accumulated substantial LTC holdings during the recent dip. Ideal risk/reward entry point secured.
- Next Steps: Will provide updates on exit strategy specifics as bull market momentum accelerates. Locking in gains at optimal intervals is the priority.

TROYUSDT UPDATEUPDATE
Formation of Falling wedge in Weekly time frame.
Breakout can lead 90-100% Bullish move.
COIN DETAILS
The live TROY price today is $0.002556 USD with a 24-hour trading volume of $6,978,554 USD. We update our TROY to USD price in real-time. TROY is up 6.34% in the last 24 hours. The current CoinMarketCap ranking is #776, with a live market cap of $22,042,798 USD.
T

LTC: W Pattern Formation Suggests Potential Bullish Reversal💎 LTC is currently forming a W pattern within a supportive trendline and in a demand area. Historical price actions indicate that after the formation of the W pattern, LTCUSD has experienced significant upward bounces.
💎A breakout above the small resistance level at the top of the W pattern could signal a bullish move. Alternatively, the price may pull back to the demand levels, which could serve as favorable entry zones.
💎However, if the price breaks below both demand zones, it would be considered a bearish scenario for LTC

INJUSDT IDEAUPDATE
Breaking Bullish Pennant Incase Of Successful Breakout Expecting Bullish Rally Towards 50$
COIN DETAILS
The live price of Injective is $ 35.33 per (INJ / USD) with a current market cap of $ 3.12B USD. 24-hour trading volume is $ 109.74M USD. INJ to USD price is updated in real-time. Injective is -0.96% in the last 24 hours with a circulating supply of 88.39M.
