Gold Trading Strategy XAUUSD August 14, 2025Gold Trading Strategy XAUUSD August 14, 2025:
Gold prices continued to rise in the European session on August 13, 2025 as mild US inflation data raised expectations of a Federal Reserve rate cut in September, while a weaker US dollar also boosted demand for gold.
Fundamental news: The US labor market report earlier this month initially weighed on the greenback, but the latest US CPI data added pressure as it did not show a clear acceleration in inflation due to tariffs in July. The inflation data reinforced the possibility that the Fed will take a more dovish stance in September, which is what the market is expecting.
Technical analysis: After a deep correction to the 3330 area, gold prices showed signs of increasing again. On the H1 frame, an upward price channel has been formed, but the current MA lines are still moving sideways, not showing a clear trend. The 3350 - 3355 area will be the important area to decide whether this uptrend channel can hold or not. RSI on H1 and H4 timeframes has entered the buy zone, this is a very good condition for us to trade. We will trade at the support zones and large liquidity zones of gold prices.
Important price zones today: 3350 - 3355, 3335 - 3340.
Today's trading trend: BUY.
Recommended orders:
Plan 1: BUY XAUUSD zone 3350 - 3352
SL 3347
TP 3355 - 3365 - 3375 - 3390.
Plan 2: BUY XAUUSD zone 3335 - 3337
SL 3332
TP 3340 - 3350 - 3370 - 3390.
Plan 3: SELL XAUUSD zone 3388 - 3390
SL 3393
TP 3385 - 3375 - 3365 - 3355 (small volume).
Wish you a safe, successful and profitable trading day.🥰🥰🥰🥰🥰
M-forex

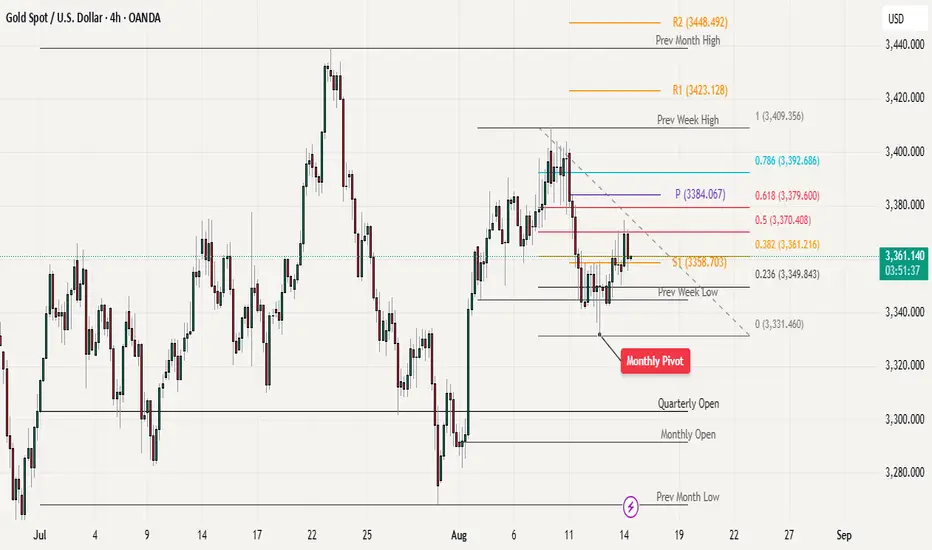
Gold Recovery Stalls at Fibonacci Resistance - Key Levels to WatWe have seen a strong recovery from the monthly pivot point, which acted as solid support. However, the price is now facing significant resistance in the Fibonacci golden zone between 3,370-3,379, based on the recent decline from 3,409 to 3,331. This resistance level presents the main challenge for bulls at this point.
For the bullish momentum to continue, buyers need to push the price above 3,379, which would confirm the upward trend and signal further strength. The positive sign is that gold has been holding steady above the 3,350 level, showing some underlying support at this price point.
Looking at key levels to watch, 3,350 serves as the immediate support level . If this level fails to hold, the next major support comes in at 3,331. A breakdown below these support levels could trigger further selling pressure and lead to additional declines in gold price.
Gold Trading Strategy XAUUSD August 13, 2025Gold Trading Strategy XAUUSD August 13, 2025:
Gold prices recovered slightly, currently trading around $3,351/oz, positive US inflation data for July has reinforced market expectations that the US Federal Reserve (FED) will cut interest rates in September, while a weaker US dollar has boosted gold's appeal.
Fundamental news: Data from the US Bureau of Labor Statistics showed that the Consumer Price Index (CPI) increased 2.7% year-on-year in July, lower than the expected 2.8% and unchanged from June. Core CPI increased 3.1% year-on-year and 0.3% month-on-month, the largest increase in six months.
Technical analysis: The sideways range of 3,340 - 3,360 has not been broken yet. The MAs are showing signs of moving sideways, showing the tug-of-war between buyers and sellers. RSI H1 has started to move towards the buy zone, RSI H4 is heading towards the average line. There is a high possibility that gold price will have a correction according to RSI of H4 and increase strongly again.
Important price zones today: 3340 - 3345, 3365 - 3370 and 3385 - 3390.
Today's trading trend: SELL.
Recommended orders:
Plan 1: SELL XAUUSD zone 3367 - 3369
SL 3372
TP 3364 - 3355 - 3345.
Plan 2: SELL XAUUSD zone 3387 - 3389
SL 3392
TP 3384 - 3374 - 3364 - 3345.
Plan 3: BUY XAUUSD zone 3340 - 3342
SL 3337
TP 3345 - 3355 - 3365 - 3385 - OPEN.
Wish you a safe, successful and profitable trading day.💗💗💗💗💗

Strong USD, Gold "Holding Its Breath" at Key ResistanceYesterday, gold prices continued to trade within a tight range of 3,340–3,355 USD , reflecting the tug-of-war between buyers and sellers. Selling pressure is still present but not strong enough to break the key support level.
On the news front: Both the U.S. Core PPI m/m and PPI m/m are forecast to rise 0.2% (vs. 0.0% previously), while unemployment claims are expected to dip from 226K to 225K . This signals inflationary pressure from the production side and a resilient labor market , which could prompt the Fed to maintain a tight monetary policy. A stronger USD puts short-term downward pressure on gold.
From the chart: Gold is moving within a sideway range of 3,340 – 3,363 USD after being rejected at the 3,363 USD resistance zone. The price structure shows consolidation with minor technical pullbacks. The 3,312 USD support remains intact; if it holds, buyers may step back in.
Suggested strategy:
Look for buy opportunities around 3,312 – 3,320 USD if support holds, with a target at 3,363 USD. Place stop-loss below 3,305 USD to limit risk.
Question: Do you think gold has enough momentum to break 3,363 USD and start a new bullish leg this week?

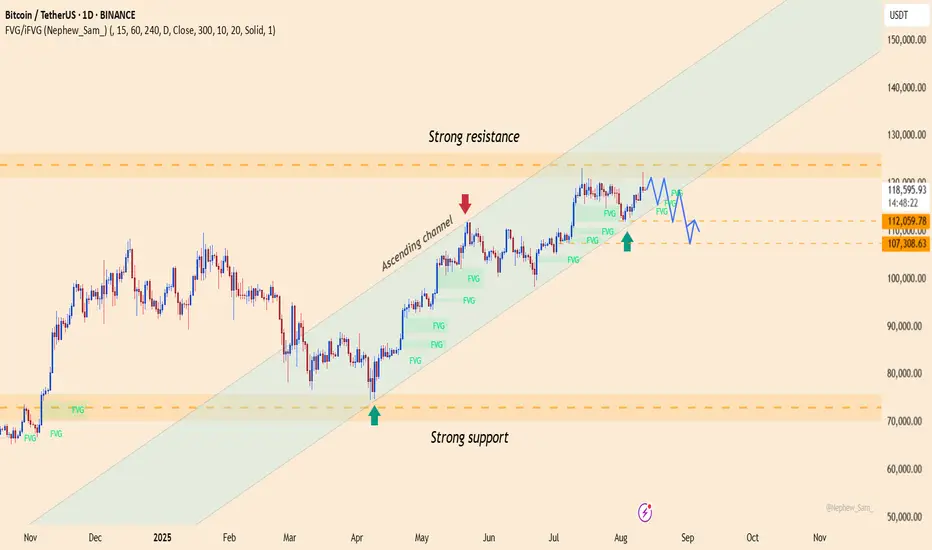
BTCUSDT – Bulls Maintain Control, Upside Scenario IntactOver the past two days , the crypto market has been supported by a series of positive developments: yesterday, U.S. PPI data cooled, easing inflationary pressure and strengthening expectations that the Fed may soon cut interest rates; today, global risk sentiment improved as U.S. and European stock indices rebounded; and most recently, Bitcoin ETF inflows continued to post net gains, signaling that institutional investors remain confident in the bullish trend.
On the daily chart , BTC is still moving within an ascending channel, with a strong resistance zone around 121,000 – 122,000 USDT. Currently, the price is consolidating right near the upper boundary of the channel, showing that buying pressure remains in control. The strong support zone lies between 112,000 – 110,000 USDT, aligning with the channel’s lower boundary.
Preferred strategy: look for buying opportunities if the price pulls back toward 112,000 – 110,000 USDT, targeting a return to 121,000 USDT and potentially new highs. The bullish trend remains intact as long as the price stays within this ascending channel.
XAUUSD Drops $55, Bearish Trend Continues!Yesterday, XAUUSD plummeted from $3,398 to $3,342 , losing more than $55 in just one trading session. This sharp decline pushed XAUUSD below a crucial support level , signaling significant weakness .
This drop confirms that gold is under strong selling pressure , with the market struggling to maintain upward momentum .
Additionally, the m/m CPI came in at 0.3% , higher than the expected 0.2% . This indicates inflation is rising faster than anticipated, increasing expectations that the Fed will continue raising interest rates.
This outcome could strengthen the USD , which typically leads to a drop in gold prices. This factor further supports the bearish outlook for XAUUSD.
The price is now approaching a near resistance level at $3,362 , a key point that may limit further upside potential. The near support is located at $3,310, and this will be tested if the price breaks through the resistance at $3,362.
Conclusion: With the combination of strong bearish price action, a stronger USD driven by CPI data, and technical structure supporting the downtrend, XAUUSD appears to be in a strong bearish trend. Risk management should be a priority as the price could test new lows near $3,310, and if this level breaks, the bearish trend could accelerate.

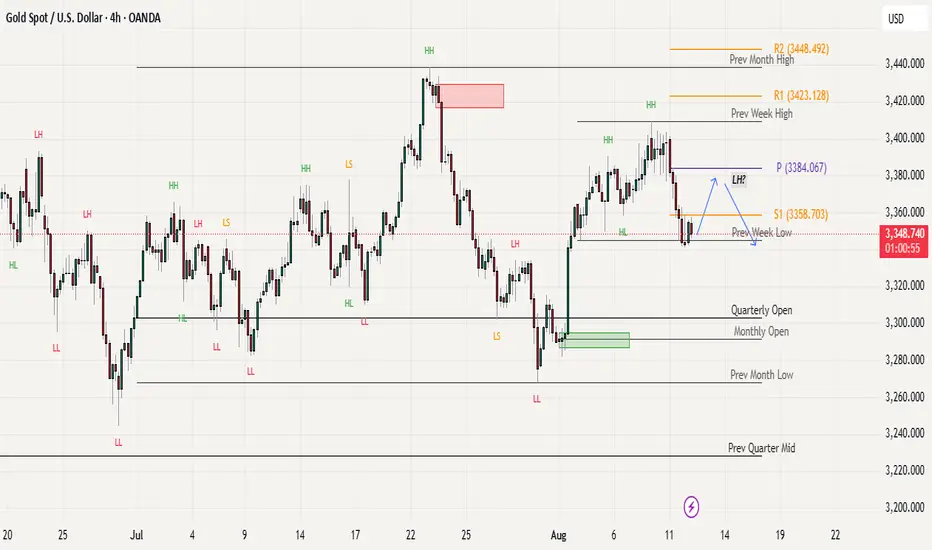
Gold Retreats to Range Zone: CPI Data Could Spark Next MoveGold has encountered strong resistance around the 3400 level and pulled back. The price has now re-entered the range zone again.
The technical picture shows gold ltaking support at 3340 support, while the 3400 level continues to act as a concrete resistance barrier above.
Yesterday's correction saw prices close below 3350, which raises some concern about near-term weakness. Today's CPI data release is expected to inject significant volatility into the market. For gold price structure, a pullback would be healthy to establish a lower high pattern as indicated on the chart, particularly if the gold intends to move lower.
On the upside, the weekly pivot at 3384 now is critical level to monitor, followed by the 3400 resistance zone. To the downside, we have to watch the 3330-3335 support area as the next key level that could determine golds immediate direction.
EUR/USD – Bullish Momentum Still DominatesIn July, the USD rose sharply by around 3.2% thanks to strong GDP data and tax-cut expectations, but this momentum is now fading quickly. Weak employment figures and concerns over the independence of the BLS, following Trump’s dismissal of its head, have undermined confidence in the USD. Goldman Sachs, Citi, and Barclays remain bearish, projecting that EUR/USD could reach the 1.20 area in the medium term.
EUR/USD has maintained an upward trendline since early August, rebounding strongly from 1.1450–1.1500, breaking through FVG, and consolidating above 1.1627. The HH–HL structure confirms the bullish trend. Above 1.1630, price could target 1.1750; a breakout above 1.1750 would open the way to 1.1780–1.1800 (top of the long-term channel).
Trading Plan:
Main Trend: Bullish
Potential Buy Zone: 1.1630 – 1.1650 (upon confirmation signal)
Short-term Targets: 1.1750 → 1.1780
Medium-term Targets: 1.1900 and potentially 1.2000
Sop-loss: Below 1.1600

Gold is about to break out – Big buying opportunity!The chart shows that gold is trading in a clearly defined uptrend channel , with successive higher highs and higher lows, strengthening the solid bullish trend . Price action indicates strong support around 3,300 USD , and if it remains above 3,360 USD , the potential for gold to continue towards the target of 3,450 USD is highly likely. 3,450 USD is a key resistance level; if broken, gold could continue rising strongly to 3,480 USD , reinforcing the market's upward momentum.
News supporting the bullish trend:
The rumor that the U.S. would impose a 39% tax on gold imports from Switzerland triggered a strong buying wave, pushing gold above 3,400 USD . Although the rumor was later denied, the strong reaction still supports market sentiment and maintains the upward momentum.
Additionally, expectations that the Federal Reserve will reduce interest rates in the near future are easing the pressure on gold, a non-yielding asset, making it an attractive investment option in a low-interest-rate environment.
Forecast and trading strategy:
Main Scenario (Bullish Trend): As long as gold stays above 3,360 USD, the upward trend will continue. The next target is 3,450 USD, with the possibility of extending to 3,480 USD if this level is broken.
Entry conditions: Confirmation signals from price action, such as breaking resistance or a bullish candlestick pattern, will be strong entry points. Watch for the breakout of 3,400 USD as a potential buying opportunity.
Risk management: Place a stop-loss below the key support level at 3,360 USD to protect your capital in case the market unexpectedly reverses.

GBPJPY GJ is continuing its decline and is approaching a key demand zone around 194.800, which previously initiated bullish order flow.
I’ll definitely be monitoring this area closely for potential buy setups, as I’m anticipating a possible retracement. As always, confirmation will come from observing the 15-minute structure—once that aligns, I’ll adapt accordingly.

XAUUSD – the bullish wave is not over yetHello fellow traders,
Gold continues to maintain its impressive upward momentum after reaching a new high at 3,440 USD/oz.
On the technical side , XAUUSD remains within its long-term ascending channel, currently trading around 3,397 USD and holding firm above the key support at 3,278 USD.
On the news front , the rally is fueled by the US imposing a 39% tariff on Swiss gold bars, ongoing geopolitical tensions coupled with stagflation risks, and expectations that the Fed will soon cut interest rates. The Indian market has also hit record highs due to a weaker Rupee, while the widening spread between spot and futures prices reflects tightened supply conditions.
Reference strategy: As long as price holds above 3,278 USD, the preferred scenario is short-term consolidation followed by a breakout above 3,534 USD, aiming for higher levels near the upper boundary of the channel.
What do you think—does XAUUSD have enough momentum to break above 3,440 USD in this move?

BTCUSDT – pressure building before the breakoutMarket context:
US trade policy eases restrictions for certain major tech companies → risk appetite improves.
Expectations of a more dovish Fed → capital flows return to the crypto market.
Sentiment & flows:
Short-term Bitcoin holdings increase by around 20 billion USD → trading activity is heating up, but profit-taking pressure is also building.
Investors are closely watching the 116,000 USDT level before adding aggressive long positions.
8H technicals:
Support: 112,600 USDT – a zone that has repeatedly triggered rebounds, maintaining the bullish structure.
Resistance: 116,000 USDT – the “gate” that could open the way to 123,000 USDT.
Bullish scenario remains favored if price closes above 116,000 USDT with confirming volume.
Key takeaway:
The market feels like it’s “winding the spring” – tight consolidation before a potential breakout.
A break below 112,600 USDT would invalidate the short-term bullish view and increase the risk of a deeper pullback.

EURUSD – recovery aiming to test resistance zoneThe euro is benefiting from the weakening pressure on the US dollar as the market expects the Fed to loosen its monetary policy, combined with positive signals of trade cooperation between the US and Europe. This risk-on sentiment is supporting the short-term uptrend of EUR/USD.
The price is moving within a short-term bullish structure and is approaching the resistance zone around 1.1770 , after rebounding strongly from the support area near 1.1630 . Recent pullbacks have been shallow and quickly absorbed, indicating that buyers still hold the upper hand.
Base scenario: EUR/USD may consolidate in a tight range before breaking above 1.1770, opening room for further upside. As long as the 1.1630 support holds, any pullback can be seen as an opportunity to add long positions in line with the prevailing trend.

XAUUSD – consolidating within range, awaiting breakout momentumGold is currently receiving strong support from news that the PBOC has been buying gold for nine consecutive months , bringing reserves close to 74 million troy ounces . This is a strategic move aimed at strengthening financial security and r educing reliance on the US dollar , which has created a positive sentiment in the market.
On the H4 chart, XAUUSD remains range-bound between 3,344 and 3,408 , with strong rebounds from the lower support zone. The price structure suggests that selling pressure is weakening , while buying momentum is building a base.
The preferred scenario is that the price will continue consolidating in a narrow range , then retest 3,344 before rising toward the 3,408 resistance and potentially higher if a breakout occurs. As long as support holds firm , the mild uptrend is likely to continue.

XAUUSD Gold Trading Strategy August 8, 2025XAUUSD Gold Trading Strategy August 8, 2025:
Gold prices have approached the 340x area and have fallen sharply to the 338x support area at the beginning of today's trading session.
Basic news: President Trump announced to double tariffs on Indian goods to 50% in response to continued oil imports from Russia. Reports show that Trump may meet with Russian President Vladimir Putin as early as next week.
Technical analysis: Gold prices are currently in an uptrend channel, but the trading range is showing signs of narrowing. The possibility that the price will correct at this 340x area is very high; if the gold price creates a double peak pattern in the H1 frame, the price range of 3375 - 3380 will confirm the pattern and create a strong downward force for the gold price. If gold forms a double top pattern here, this correction could take gold to the 3350 or even 3330 area.
Important price zones today: 3375 - 3380, 3405 - 3410 and 3420 - 3425.
Today's trading trend: SELL.
Recommended orders:
Plan 1: SELL XAUUSD zone 3407 - 3409
SL 3412
TP 3404 - 3394 - 3374 - 3354.
Plan 2: SELL XAUUSD zone 3423 - 3425
SL 3428
TP 3420 - 3410 - 3390 - 3370.
Plan 3: BUY XAUUSD zone 3375 - 3377
SL 3372
TP 3380 - 3390 - 3400.
Wish you a safe, successful and profitable trading weekend.🌟🌟🌟🌟🌟

EUR/USD – Uptrend Strengthens as USD WeakensMacro backdrop is favoring the euro:
Weaker U.S. labor market (only 73,000 new jobs) is boosting expectations of a Fed rate cut in September.
Political pressure on the Fed raises concerns about its independence → USD loses credibility.
EU–US trade deal eases tensions and supports confidence in the euro.
Technical Outlook
On the H4 chart, price has broken the downtrend line from July , forming a classic higher low structure – a hallmark of an uptrend.
Price is moving within a short-term ascending channel , targeting the 1.1780 resistance zone.
RSI has broken above 70, indicating strong buying momentum but also signaling a potential short-term pullback.
Suggested Trading Strategy
Prefer to Buy on dips toward the 1.1570–1.1600 support zone.
Near-term target: 1.1780
Stop loss: Below 1.1520

XAUUSD – Gold stays hot, bullish trend still intactGold continues to be in the spotlight as a combination of macroeconomic factors and technical structure supports further upside momentum.
Market Overview:
- Analysts have revised gold price forecasts upward to the $3,500–$3,600/oz range, driven by a weaker USD and concerns over slowing US growth.
- Labour market data from the US is showing weakness, with rising jobless claims – increasing expectations that the Fed may cut rates in September.
- Geopolitical tensions and global trade uncertainties are boosting gold's appeal as a safe haven asset.
- Strong investor interest: Trading volumes in gold futures have risen significantly, indicating heavy participation from big money.
Technical Analysis:
- Price is clearly moving within an ascending channel, reflecting a stable medium-term uptrend.
- Gold is currently testing the short-term resistance around $3,408 , with potential for a minor correction toward support near $3,350 , which aligns with the lower boundary of the channel.
- As long as price remains inside the ascending channel, the bullish bias remains valid.
Trading Strategy
Look for long entries near the $3,350 support zone on a pullback.
Short-term target: $3,408 – Mid-term target: $3,500+
Stop-loss: Below $3,320
In summary , gold is receiving strong support from both fundamentals and technicals. Buying the dips remains the preferred strategy in the current setup.

EURUSD – Bottoming out, poised for breakoutAfter a sharp decline since late July, EURUSD is consolidating around the key support zone of 1.1520–1.1580. On the H4 chart, price remains within a descending channel but is beginning to form a compression pattern — often a precursor to a strong breakout. Bullish momentum is building as price rebounds from the 1.1480 low and holds a modest upward bias.
On the macro front, the USD is weakening as markets increasingly expect the Fed to cut interest rates in September, especially after a string of weak labor data. In contrast, the EUR is supported by stable inflation and the ECB’s persistent hawkish stance. If the current support zone holds, EURUSD could break out of the descending channel and target the resistance levels at 1.1680 and 1.1770.

Gold Explodes: Will the Uptrend Continue?News Background:
Recent weak U.S. job data has fueled expectations that the Fed will cut interest rates in September, weakening the USD and bond yields, making gold more attractive. Additionally, trade tensions between the U.S. and India have increased uncertainty, driving capital flows into gold.
Technical Chart:
Resistance: 3,450 USD is a key resistance level. If broken, the price could continue to rise towards 3,500 USD.
Support: 3,360 USD is the nearest support level. A drop below this could lead to a pullback to 3,320 USD.
RSI: Currently at 64.11, close to overbought territory, but not yet too high, suggesting the uptrend could still continue.
Outlook:
Bullish scenario: If 3,450 USD is broken, the price could reach 3,500 USD.
Bearish scenario: If 3,360 USD cannot hold, a pullback to 3,320 USD is possible.

AUDNZD Buy or Sell? AUDNZD tapped into the 4H Supply zone I’ve been monitoring for some time. On Friday, we also saw a bearish structure flip on the 15-minute timeframe — a potential signal that price may break the current demand zone and shift structure to the downside.
I didn't take any positions on Friday, but going into this week, my focus will be on the 4H Demand Zone for possible long opportunities. I’ll be watching how price reacts there — if we get bullish confirmation, I’ll consider a long setup.
For now, shorts don’t offer a favorable R:R, so I’ll remain on the sidelines unless demand breaks. If that happens, I’ll take the same approach, watching for clean structure and new entry zones.
Patience until the market reveals what it wants to do next.

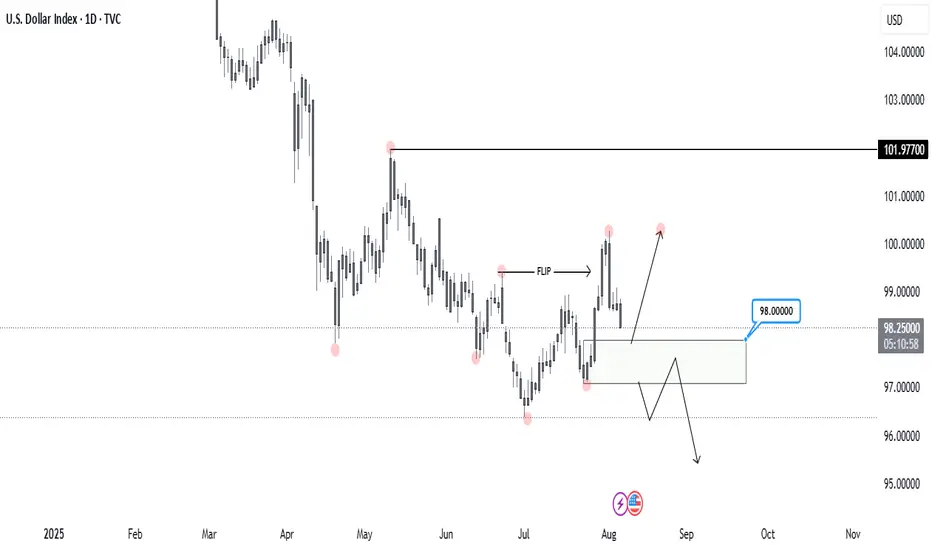
DXY, DAILYLet’s take a look at DXY on the Daily timeframe.
Price recently broke the previous Higher Low, flipping the structure to the downside. This marks a significant shift in momentum.
Now, I'm watching the 98.000 level, which I’ve identified as a Daily Demand Zone. It’s the origin of the move that broke the previous bearish structure, making it a key area of interest.
I’ll be waiting for a reaction from this zone to see if buyers step in again ( most likely ) or if the bearish momentum continues.
That would be my confirmation for xxx/usd shorts.
EURUSD TankThis looks like a very good spot to SELL the EURUSD. Economic factors are showing slightly weak US dollar, but COT reports indicate Commercials still have a lot of LONG contracts. This gives a very nice confluence with a 61.8% retracement of last week's bearish move, also paired with an attractive $1.70 price tag along with it.

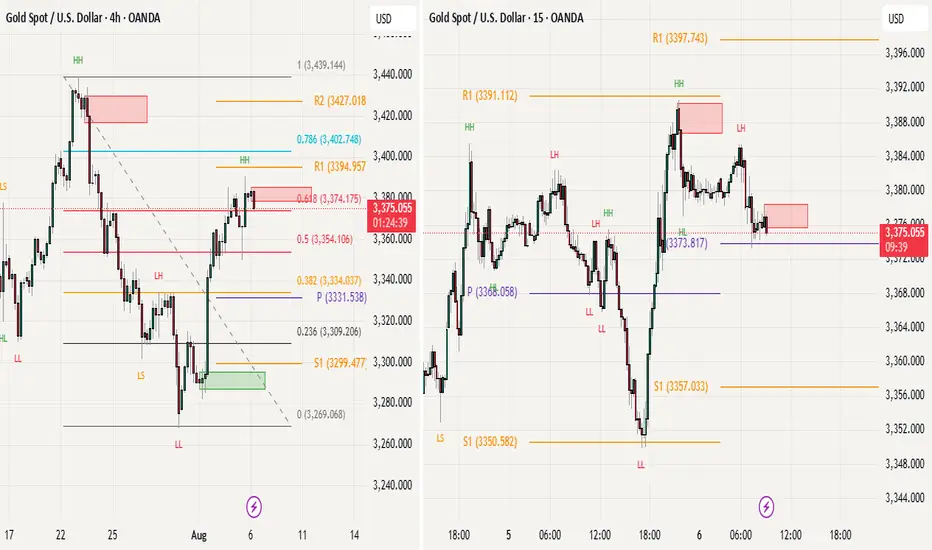
Gold Shows Strength Above Key Fibonacci LevelLooking at the broader time frame, gold has successfully maintained the upward momentum it gained on Friday, with bulls managing to sustain these higher levels. Additionally, the market has broken out aove tbhe important Fibonacci golden zone at the 60% retracement level of 3374, which is a significant bullish sign.
On the lower time frame analysis, we can observe that the 3350 level (Previos day S1) is acting as strong support for gold . Today's pivot is showing an ascending formation pattern, which is clearly visible on the 15-minute time frame chart. The intraday support level for today is at 3357.
From an overall perspective, the larger time frame structure continues to look positive and bullish and currently seems like in consolidation phase. However, if gold manages to print a high low (3335-40 will be good) on the H4 time frame, this would provide an even stronger confirmation signal for the ongoing bullish trend. The combination of sustained momentum, Fibonacci breakout, and ascending pivot formation suggests that gold remains in a favorable position for continued upward movement, provided key support levels hold.