EURUSD remains in a downtrendEUR/USD continues to move within a descending channel, with the 1.1600 area acting as strong resistance. Recent price action suggests the current rebound may be just a retest before the downtrend resumes. The next bearish target is around the 1.1390 support zone.
On the news front, although a strong U.S. PMI puts slight pressure on EUR, the USD faces mixed forces:
Weak NFP data increases expectations of a Fed rate cut.
The new US–EU trade deal imposing a 15% tariff has sharply weakened the euro.
Eurozone PMI improved but remains below 50, indicating a still-fragile recovery.
M-forex

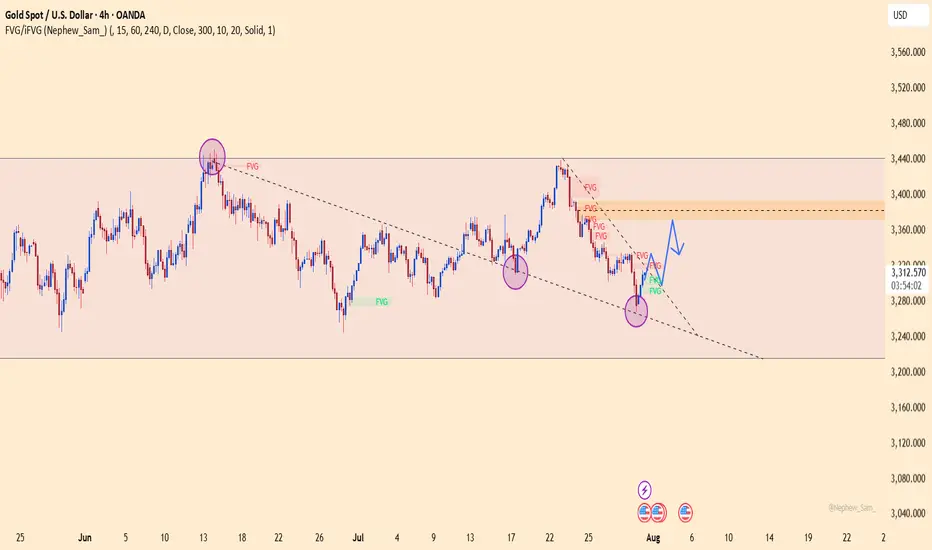
XAUUSD awaits breakout at confluence zoneGold is consolidating around 3,361 USD after a strong rebound from the key support zone at 3,284 USD — previously a major swing low in the existing bullish structure. Recent price action on the H4 timeframe is forming a potential Cup and Handle pattern, indicating that buying pressure remains present after each retracement.
The 3,351 USD resistance area now acts as a confluence zone, where the descending trendline from July intersects with a key horizontal level. Price behavior at this zone will likely determine the next directional move. A successful breakout would confirm the bullish continuation structure, with room to revisit the previous highs.
Current technical signals suggest that buyers are gradually regaining control, as higher lows emerge and upward momentum builds from the major support area.

NZDJPYValid trade opportunity, trying to get into buys before sells. 4H is bearish but price needs to retrace back up to balance the leg. Let's see how it goes.

Gold regains shine after Fed shiftHey traders! Let’s break down what’s been happening with XAUUSD recently.
Last week, gold made a stunning comeback — tumbling first, then surging nearly 800 pips within just a few sessions. This rapid shift was fueled by dovish signals from the Fed and soft US jobs data, which sparked growing expectations of early monetary easing.
At the same time, a global financial survey shows analyst sentiment toward gold at its highest in months. With ongoing global uncertainty, gold is once again in the spotlight as a go-to safe haven.
Despite the rally, volatility remains elevated. The next move will likely depend on upcoming economic data and fresh comments from Fed officials. Meanwhile, holiday trading could mean slower market activity in the short term.
From a technical perspective, gold has broken out of its previous downtrend channel and is moving rapidly. According to Dow Theory, a short pullback may occur — but if price holds above key support, the bullish wave could extend toward the $3,416 level, marked by the 1.618 Fibonacci extension.
This breakout might just be the beginning of a new bullish phase after weeks of sideways action.
What’s your take — is gold gearing up for something bigger?

EURCAD BUYSPrice flipped the 4H structure on EURCAD, making a new higher high and shifting bullish. I’m watching for a retrace back down into the demand zone around 1.58500 that caused the flip.
Looking for buyers to come in here again and push the price higher. Will wait for some confirmation on the 15-minute chart before entering.

GBPUSD GBPUSD is still holding bullish structure. Price has formed a Higher High, and I’ll now be watching for a retracement into the 4H demand zone to potentially form a buy setup.
As of now, there’s no reason to short — unless structure breaks and demand fails, I’ll stick to the bullish bias. If price pulls back cleanly and gives confirmation in the demand zone, I’ll look to take a long position at 1.32000 aligned with the trend.
Keeping it simple: trade with structure, wait for confirmation, and manage risk.

USDCADStructure has shifted on USDCAD — price broke the previous high and formed a new Higher High (HH), confirming a bullish trend.
I’ll be watching to see if price pulls back into the 4H Supply Zone, potentially offering a rejection and a drop lower. From there, I’ll shift focus to the Demand Zone below, where I’ll be looking for long setups if price gives clear bullish confirmation.

EURNZDEURNZD Market Outlook
The price on EURNZD has recently approached the 4H Supply Zone around the 1.96000 level and has flipped the short-term bearish structure, indicating potential bullish momentum. However, given the presence of supply, I'm monitoring the possibility of a retracement from this zone.
My primary scenario involves a short-term rejection from the 1.96000 Supply Zone, targeting a move down into the 1.94000 Demand Zone. From there, I will look for a sell-to-buy setup, with the intention of positioning for a larger upside continuation, provided bullish order flow confirms.
Alternatively, if buyers prove to be significantly strong and supply fails to hold, price may break through the 1.96000 zone and extend higher towards the daily wick area near the 1.98000 level.
Both scenarios remain valid depending on price action and volume behavior at key levels.
Will be watching 15min structure before entering any trade.

XAUUSD – Gold accelerates: Is the 3,600 target within reach?Gold has made an impressive rally of nearly 720 pips, surging from the recent bottom near 3,260 up to 3,365, following a deeply disappointing U.S. jobs report. Non-Farm Payrolls came in at just 106K, far below expectations, while the unemployment rate climbed to 4.2% — a clear sign that the U.S. economy is slowing down. In this context, the expectation that the Fed will pause rate hikes has become more solid, paving the way for gold to break higher.
Technical analysis on the D1 timeframe shows that XAUUSD remains in a well-established ascending channel that has persisted since late 2024. The recent bounce from the 3,260 support zone was strong, with yesterday's bullish candle confirming that buyers are regaining control.
As long as price holds above the 3,260 support area, the next target lies at the psychological resistance around 3,500, and beyond that — the ambitious 3,600 mark.

GBP/USD: Post-Impulse Sell Setup from Ending DiagonalThe chart depicts a completed 5-wave impulsive structure, culminating at the top of wave (5). The internal wave structure of the final fifth wave forms a classic ending diagonal pattern, typically signaling a trend reversal or deep correction.
After this extended fifth wave, the price has started rolling over, confirming the start of a corrective decline. The wave count now expects an ABC correction targeting the previous wave 4/2 demand zone, highlighted in red.
Target 1 (T1): 1.33608
Target 2 (T2): 1.32436
Stop Loss (SL): 1.35988
Ending diagonal at the top of wave (5) signals exhaustion of bullish momentum.
Clear bearish divergence (not shown here) is commonly seen with this pattern.
The price has broken the short-term structure and is now forming lower highs.
Target zone aligns with previous wave 2 consolidation – a typical retracement zone for post-impulse corrections.

EURUSD – Euro tumbles under strong dollar pressureAfter a brief uptick following the US–EU trade agreement, EUR/USD quickly sank under a wave of strong US economic data. While import tariffs on EU goods were reduced to 15%, the US dollar gained more as capital kept flowing into the US thanks to a Q2 GDP growth above 3%, steady PCE, and a strong ADP report.
On the H4 chart, the bearish structure is clear: EUR/USD broke below key support and formed a series of unfilled FVGs, signaling sellers are still in control. The current pullback towards the 1.14300 resistance zone could act as a bull trap, with the next target eyed near 1.12300 — a likely liquidity zone.
If this area breaks, the 1.1200 mark may be triggered next. Meanwhile, USD strength shows no signs of fading — especially as the Fed maintains a cautious stance with no easing in sight. The euro is no longer seen as a safe haven, and investors are gradually pulling out.

EUR/USD Elliott Wave Count Signals Downside TargetsThe EUR/USD chart is displaying a completed 5-wave Elliott impulse structure, suggesting the potential start of a larger corrective move to the downside. Wave 5 appears to have finished after a classic ending diagonal pattern, with price now breaking below the wave 4 support trendline — a strong confirmation of trend exhaustion.
Currently, price is retracing upward towards the 0.5–0.618 Fibonacci retracement zone of the last impulsive leg, around 1.15912–1.16383, which may serve as the final rejection zone for bears to re-enter. This area aligns perfectly with prior support-turned-resistance and is considered the potential reversal pocket.
If price holds below the 1.17869 invalidation level, the structure supports the beginning of an ABC correction or a larger bearish impulse.
Target 1 (T1): 1.14800
Target 2 (T2): 1.13915
Stop Loss (SL): 1.17869
This scenario remains valid as long as the price does not break above 1.17869. A clean break and close above this level would invalidate the bearish setup and suggest a possible wave extension.

GBPJPYThe 4-hour structure on GBP/JPY has turned bullish following a strong upward move that flipped the previous structure after several days of consolidation and limited volatility.
Price has now entered a Demand zone and is likely to retrace toward the 197.500 level, which aligns with a key psychological handle.
This area may present a high-probability trading opportunity, depending on how price reacts. We'll monitor for confirmation before entering a position.

XAUUSD – Gold jumps as weak US job data boosts bullish sentimentGold prices reacted positively after the US Non-Farm Payrolls came in at only 106K and the unemployment rate rose to 4.2%, signaling a cooling labor market. This weak data has lowered expectations of further rate hikes from the Fed, offering strong support for gold.
On the H4 chart, XAUUSD has formed a bottom around the 3,247 area and is now rebounding within a descending channel. A slight trendline break and a W-pattern near the bottom further reinforce the potential for a continued upward move.
Technical view:
XAUUSD is approaching a key resistance zone around 3,313 – a crucial level that could trigger a breakout. If gold breaks above it with strong buying pressure, it may head toward the upper boundary of the channel.
The RSI is recovering from oversold levels, while EMA34 and EMA89 are starting to converge – suggesting a possible trend reversal ahead.

Gold weakens further – is 3250 next?Hello traders, take a look at the chart — what do you see?
Here’s my perspective:
Recently, gold has shown signs of weakness as the U.S. dollar strengthens amid expectations that the Fed will delay interest rate cuts. In response to this, gold continues to trend lower and is currently hovering around the 3,289 USD mark.
The previous ascending trendline has been broken, and both the EMA 34 and EMA 89 have turned downward, fueling bearish momentum. The 3,320 support level has also failed, and the latest bullish correction was rejected — reinforcing the downtrend.
Given these clear fundamentals and technical confirmations, I expect the bearish momentum to accelerate, at least in the short term.
My immediate target for this move is 3,250 USD.
What about you — where’s your target?

Gold Recovery Fails at 3300 - Bearish Bias ContinuesBased on the gold chart analysis, here's a simplified price action breakdown:
Gold attempted a decent recovery and pullback yesterday, but the price is still struggling to sustain above the crucial 3300-3305 area. This inability to hold above key support levels is concerning for bullish sentiment. Additionally, gold has failed to break above the resistance trendline (black line on the chart), which further weakens the bull case.
For any meaningful upward movement, gold needs to generate at least one higher low formation, which hasn't printed yet. The immediate support zone lies at 3267-3275, and if this level breaks down, we could see further decline toward lower price levels. From a price action perspective, sellers are still in control of the market despite yesterday's recovery attempt.
The key levels to watch are the 3300-3305 resistance above and 3267-3275 support below. Until gold can break and sustain above the resistance trendline while forming higher lows, the overall sentiment remains bearish.

XAUUSD – Gold may plunge if key support failsHello traders! Gold continues to move within a clear descending channel and is currently retesting the previous support zone around 3,295.600. The RSI remains weak, and the EMA 34 stays below the EMA 89, confirming that the bearish trend is still dominant.
On the news front, U.S. labor costs have exceeded expectations, the Fed held rates steady, and there’s no sign of a dovish shift. This continues to strengthen the USD and puts pressure on gold. Investors are now awaiting Powell’s speech at tonight’s FOMC meeting—if his tone remains hawkish, gold is likely to face further downside.
Trading strategy:
If price retraces to the 3,350 – 3,371 zone and shows rejection or reversal signals, SELL remains the preferred option.
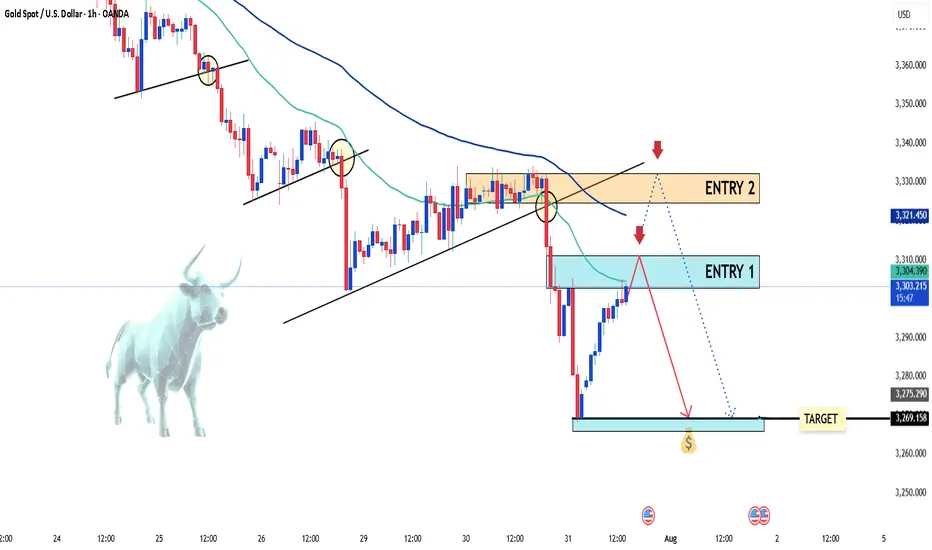
Gold dips again – is the bounce just a trap?Hello traders!
After a quiet start to the day, gold has turned lower and is now hovering around the $3,300 mark. The decline in OANDA:XAUUSD came as U.S. Treasury yields rose in response to strong U.S. economic data. The Fed is widely expected to maintain its current monetary policy stance during today’s session.
From a technical perspective, XAUUSD continues to form bearish structures and breakdowns. While a short-term bullish correction is currently underway, the bears still hold the upper hand — and selling opportunities remain the preferred strategy.
I’ll be focusing on two key entry zones marked on the chart, with a short-term bias favoring sell setups.
Do you agree with this approach?
⚠️ Please remember: This is just a trading idea — make sure to manage your risk properly with defined TP and SL levels.
Good luck and happy trading!
EURUSD at risk of reversal: will sellers take control?Hello everyone! What are your thoughts on EURUSD?
Lately, the euro has been under pressure due to growing weakness in the Eurozone economy. The European Central Bank (ECB) has sent out more cautious signals in response to rising recession risks and cooling inflation. This increases the likelihood that the ECB may wrap up its tightening cycle earlier than the Fed – a shift that could weigh heavily on EURUSD.
From a technical standpoint, EURUSD recently hit a peak around 1.1766 after several attempts, and a CHOCH (Change of Character) reversal pattern may be forming. If the pair fails to reclaim the 1.1766 zone, a deeper downside scenario is likely to unfold.
As for me, I’m currently favoring short setups, especially around supply zones or after failed retests. Discipline and solid risk management remain my top priorities.
How about you? What’s your take on this pair?

XAUUSD – The Weakness of Gold – Are Investors Ready?Gold is being heavily impacted by the strengthening of the US dollar, driven by recently released economic data from the US. A strong increase in employment and a 2.5% GDP growth show that the US economy is growing stronger than expected, pushing the US dollar higher and creating downward pressure on gold.
The chart shows that gold is trading within a downward price channel, with key support and resistance levels already identified. The strong resistance at 3,345 USD continues to be a major challenge for any upward movement in gold.
If gold cannot break through these resistance levels and continues to decline below 3,310 USD, we may see a deeper correction.

Gold price analysis before FOMC Looking at current price action, after sharp decline we witnessed earlier. Gold has found support around the monthly open level between 3300-3310, which is acting as a solid support zone right now. now price is attempting to climb higher with the help of ascending trendline, but it's running into resistance at the weekly open around 3329-31.
If we can see a clean breakout above this weekly resistance, I'd expect gold to make a move toward the 3350 level as the next logical target. Beyond that, we've got the pivot at 3367 which will likely serve as a stronger resistance barrier. On the downside, our immediate support remains at that trendline, with the major support zone at 3300 acting as our safety net.
Today's Fed interest rate decision is the major market mover event;;that could dictate gold next directional move. Personally, I'm leaning toward seeing some upward momentum today, but the real test will be whether price can hold those higher levels or if we'll see rejection and another leg down. The key is watching how gold reacts to whatever the Fed delivers and whether buyers can step in with conviction at these elevated levels. It's definitely a day to stay alert and let the market show its hand before making any big moves.

EURUSD: Short-term rebound signals after sharp dropEURUSD has just reacted to a key demand zone and is showing signs of a technical rebound. A small double bottom pattern is forming on the 3H chart, indicating that buyers are starting to return. If the price holds above this recent low, the short-term bullish scenario could continue.
On the news front, the US JOLTS data came in lower than expected, reflecting a cooling labor market. This reduces the likelihood of further Fed tightening, creating room for the euro to recover slightly.
Strategy: Favor buying if price remains above the support zone, with a potential move to retest the upper FVG area before the market makes its next decision.

Gold rebounds – Enough to shift the trend?Gold is trading within an ascending channel, recently bouncing modestly from the trendline after a series of declines. The structure suggests XAUUSD could continue a technical rebound toward the resistance zone near 3,374 before a new trend is confirmed.
On the news front, JOLTS job openings came in slightly below expectations, indicating a cooling U.S. labor market. This offers mild support for gold, as the Fed may consider easing policy sooner. However, with the figure still above 7 million, the impact remains short-term.
Strategy: Watch price reaction near the 3,374 zone. If it fails to break through, the bearish scenario remains dominant. Short-term buying may be considered as long as the trendline holds.
