Bank Nifty and Nifty50 Scalping TechniquesWhat is Scalping in Index Trading?
Scalping is a high-frequency intraday trading style where a trader looks to capture small price movements multiple times throughout the day. In indices like Nifty50 and Bank Nifty, where price movement is fast and often sharp, scalping is a preferred strategy for many traders.
Scalpers don't aim to catch a ₹100 move. Even ₹20–₹30 on a Bank Nifty option, done 3–4 times a day with volume and discipline, can generate consistent returns.
Why Nifty50 & Bank Nifty for Scalping?
High Liquidity: Tight bid-ask spreads make it easier to enter and exit quickly.
Option Volatility: Options on these indices give quick 5–10% moves in minutes.
Trend & Momentum Friendly: These indices often move in clean intraday trends, giving plenty of scalping chances.
Institutional Interest: Nifty and Bank Nifty are tracked by institutions, so technical levels work well.
Tools Every Scalper Must Use
Before we dive into strategies, make sure you have these ready:
5-Minute / 3-Minute Candlestick Chart
VWAP (Volume Weighted Average Price)
CPR (Central Pivot Range)
Price Action Levels (Previous Day High/Low, Opening Range)
Option Chain Analysis (for OI build-up)
Volume & Momentum Indicators (e.g., RSI, MACD)
Top Scalping Techniques for Nifty & Bank Nifty
1. VWAP Bounce Strategy
Best Time: 9:30 AM to 11:00 AM or 1:30 PM to 3:00 PM
How it works:
Wait for price to test the VWAP line.
If trend is up, and price bounces from VWAP with a bullish candle → enter Call Option.
If trend is down, and price rejects VWAP with bearish candle → enter Put Option.
Entry: On confirmation candle after touching VWAP
Target: 15–25 points on option premium
Stop Loss: 5-minute candle close above/below VWAP
Why it works: Institutions use VWAP for entries; many intraday algos are VWAP-based.
2. CPR Breakout Scalping
Best Time: Opening hour or post-lunch (2:00 PM onwards)
How it works:
If the day’s CPR is narrow, expect trending moves.
Wait for a breakout above CPR high (for long) or below CPR low (for short).
Entry only after a strong 5-minute candle closes outside CPR.
Bonus Tip: Narrow CPR + gap-up = trend day; very scalper-friendly.
Targets: 1:1.5 or trailing stop loss
Risk: High if you trade before confirmation—wait for candle close.
3. Opening Range Breakout (ORB)
Best Time: 9:15 AM – 9:45 AM
How it works:
Mark high and low of first 15 minutes (Opening Range).
Wait for price to break above high or below low with volume.
Ride the momentum for a quick 20–30 point move.
Ideal with: Volume spike + option chain confirmation (OI buildup)
Setup Example:
Bank Nifty breaks above 15-min high, with strong buying in 44,000 CE option → go long.
4. Momentum Scalping with RSI + Candles
How it works:
Use 3-minute chart.
If RSI crosses 60 and a strong green candle forms → go long.
If RSI drops below 40 and red candle forms → go short.
Why this works: Combines price momentum with volume conviction.
Targets: Small, quick moves (10–20 points in Nifty, 20–40 in Bank Nifty options)
Stop Loss: Fixed SL or previous candle high/low
5. Option Chain Scalping – "Smart Money Footprint"
How it works:
Track OI build-up in real-time (especially at ATM or 1-step OTM strikes).
If you see heavy OI build-up + volume spike at 44,000 CE → momentum may build.
Enter on confirmation from price chart (ideally with VWAP or CPR confluence).
Bonus: Combine this with Live Change in OI (many brokers offer this now).
Tools to watch:
Strike Price OI Build-up
IV Rise (Implied Volatility)
Volume on Option Contracts
Important Scalping Do’s & Don'ts
Do’s:
Trade only when price structure + indicator + volume align.
Use limit orders to reduce slippage.
Cut losses fast. Scalping is risk-first.
Have fixed daily targets (e.g., ₹1,500/day)
Trade less when market is choppy
Don’ts:
Don’t chase after big moves already gone.
Don’t increase lot size without system consistency.
Don’t scalp in low volatility phases (e.g., between 12–1:30 PM).
Mindset of a Nifty/Bank Nifty Scalper
You are not a trend trader – you’re a sniper.
Profits come from repetition, not jackpot moves.
You must read the pulse of the market within the first 30 minutes.
No trade > bad trade.
Scalping is about control, discipline, and micro-decisions. Even 3–5 successful trades in a session can result in high accuracy days.
Example Live Scenario (Bank Nifty)
Date: Suppose Bank Nifty opens at 44,000
CPR Range: 43,940–44,060 (tight)
VWAP: At 44,020
Option Chain: 44,000 CE OI increasing rapidly, price trading above VWAP
Setup: CPR breakout + VWAP hold + OI build-up at CE
Trade: Buy 44,000 CE @ ₹120
Target: ₹140–₹160
SL: ₹110
Exit: Within 10–15 mins
Avoid trading just on gut feeling. Use structure.
Conclusion
Scalping in Nifty and Bank Nifty is not gambling—it's calculated, quick decision-making with small but consistent profits. Whether you’re using VWAP, CPR, or live option data, your edge comes from preparation and discipline, not prediction.
If you're just starting, begin with paper trading or small lots, and gradually scale up once your win-rate improves. With time, you'll find the setup that fits your personality best—whether it’s breakout-based, pullback scalping, or OI-driven.
M-forex
Global Factors Impacting Indian MarketsIntroduction
The Indian stock market, like any other major market, is deeply interconnected with global events. While domestic news like RBI policy, election results, or monsoons do influence our stocks, global factors often act as the real drivers behind sharp up-moves or crashes.
Whether you're an investor, trader, or analyst, understanding how global cues influence Nifty, Bank Nifty, Midcaps, and even commodities is essential for smart decision-making.
In this explanation, we’ll break down the major global factors, how they affect Indian markets, and what traders should watch daily and weekly.
1. U.S. Federal Reserve & Interest Rates (Fed Policy)
Why it matters:
The U.S. Federal Reserve’s interest rate decisions directly impact global liquidity. When the Fed raises rates, money becomes costlier. Foreign investors often pull out from emerging markets like India to invest in safer U.S. bonds.
Impact on India:
Rising U.S. interest rates = FII selling in India
Weakens rupee, inflates import costs (e.g., crude oil)
Tech & high-growth sectors take a hit (especially those sensitive to valuations)
2. Crude Oil Prices
India is a major oil importer—more than 80% of our crude is imported. Crude price volatility has massive ripple effects across inflation, currency, fiscal deficit, and stock market sectors.
Impact on India:
High crude = inflation + weak rupee + fiscal stress
Negatively affects oil-dependent sectors like aviation, paints, logistics, autos
Boosts oil marketing companies' revenue (but hits margins if subsidies increase)
Example:
If Brent Crude moves from $70 to $95 in a month, expect:
Nifty to correct
INR to weaken vs USD
Stocks like Indigo, Asian Paints, Maruti to face pressure
💰 3. Foreign Institutional Investors (FII) Flow
FIIs bring in billions of dollars into Indian equity and debt markets. Their buying or selling behavior is often influenced by:
Global risk appetite
Currency trends
Interest rate differentials
Geopolitical tensions
When do FIIs sell?
When the dollar strengthens
When there’s fear in global markets (e.g., war, U.S. recession)
When India underperforms vs peers
When do FIIs buy?
When global liquidity is high
India shows growth resilience vs China or other EMs
Post-election clarity, reform hopes, etc.
Daily Tip:
Watch FII cash market activity—daily inflows/outflows often decide Nifty’s intraday trend.
🏦 4. U.S. Economic Data (CPI, Jobs, GDP, PCE)
Every month, the U.S. releases:
CPI (inflation data)
Jobs Report (NFP)
GDP numbers
PCE (Personal Consumption Expenditures)
These influence Fed decisions, hence impacting global markets.
Example:
A hot U.S. inflation print → Fear of more rate hikes → Nasdaq crashes → Nifty follows
A weak U.S. jobs report → Rate cut hopes → Global rally → Bank Nifty surges
Keep an eye on U.S. calendar events, especially the first Friday of every month (NFP Jobs) and mid-month (CPI release).
🌏 5. Geopolitical Tensions & Wars
Markets hate uncertainty. Global conflicts often lead to panic selling, flight to safety, and surge in gold/crude prices.
Key global risk zones:
Russia-Ukraine
Middle East (Israel-Iran, Saudi-Yemen)
China-Taiwan-U.S. tensions
Impact on India:
Spike in gold and crude
Selloff in equity markets
Rise in defensive sectors (FMCG, Pharma, IT)
Surge in defence stocks (BEL, HAL, BDL)
💱 6. Dollar Index (DXY) & USD-INR Movement
The Dollar Index (DXY) measures the dollar's strength vs other currencies.
Rising DXY = Stronger dollar = FII outflows from India = Nifty weakens
Falling DXY = More risk-on = Money flows into emerging markets = Nifty rallies
Rupee’s role:
A weak INR/USD makes imports costly → impacts inflation
A strong INR/USD helps improve trade balance → attracts investors
💹 7. Global Equity Markets (Dow Jones, Nasdaq, Asian Peers)
The Indian market is heavily influenced by:
Dow Jones, Nasdaq (overnight sentiment)
SGX/GIFT Nifty (pre-market cues)
Asian Markets (Nikkei, Hang Seng, Shanghai)
How it affects us:
Strong global cues = Nifty opens gap-up
Weak Nasdaq = IT stocks sell off at open
Mixed Asian markets = Rangebound Nifty till clarity
Pro Tip: Always check Nasdaq futures and GIFT Nifty levels before the market opens.
🧭 8. China’s Economic Health
As a large global player in manufacturing, China’s growth (or lack of it) sends signals across the world.
If China slows down:
Commodities fall (good for India)
Asian currencies weaken
Global markets get jittery
If China shows strong stimulus:
Metal stocks rally globally (Tata Steel, Hindalco benefit)
Global optimism lifts all EMs
🏦 9. Global Banking or Financial Crises
Remember the Silicon Valley Bank collapse (2023)? Or the 2008 Lehman crisis?
Global financial stress always triggers:
A sell-off in Indian banks
Panic across all indices
Shift toward safe havens (gold, USD)
Traders should monitor:
Global bond yields
Credit Default Swaps (CDS spreads rising = trouble)
Bank stress signals in Europe/U.S.
🌾 10. Global Commodity Cycles (Metals, Energy, Agri)
India, being resource-dependent, reacts to global commodity moves.
Rally in metals = Tata Steel, Hindalco, JSW Steel surge
Rally in coal, oil = Uptrend in ONGC, Coal India, Oil India
Rally in agri = FMCG and consumer food stocks affected
Keep a watch on:
LME (London Metal Exchange) prices
Global wheat/rice/cocoa/sugar trends
🛑 Final Thoughts
Global factors are not just background noise. They are active triggers that move Indian markets every single day.
A smart trader or investor should:
Track global cues as seriously as domestic ones
Prepare for overnight risks using hedges or stop losses
Read market behavior through global context, not just stock-level news
By staying connected to the world, you can stay one step ahead of the market.

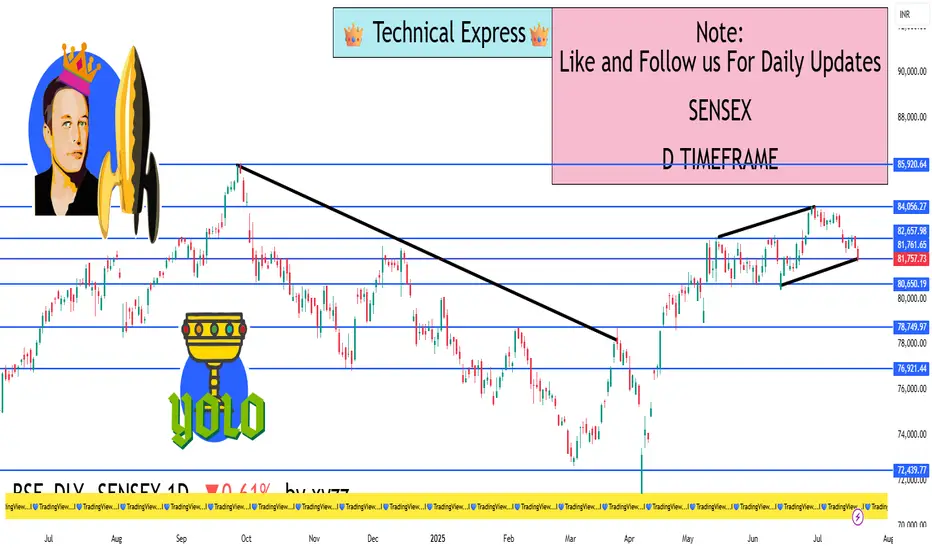
Sensex 1D Timeframe
📈 Sensex (BSE 30) Today’s Overview (1D Time Frame)
Opening Level: Sensex opened higher around 82,350 to 82,500 points, continuing the positive momentum from previous sessions.
Intraday High: Reached around 82,530 in the first half of the session.
Intraday Low: Dropped to approximately 82,170–82,200 in the afternoon session.
Current Trading Range: Mostly trading between 82,200 and 82,500 levels, with a slight upward bias.
Previous Close: Around 82,180–82,200.
Net Change: Trading +0.2% to +0.3% higher, showing slight gains.
🔍 Key Market Drivers Today
Positive Impact:
Strong earnings from banking stocks, especially HDFC Bank and ICICI Bank, are boosting index strength.
Eternal Group (parent of Zomato) surged significantly, adding positivity to market sentiment.
Low volatility today, with India VIX falling, indicating reduced fear in the market.
Negative Impact:
Realty, PSU Banks, and Media sectors underperformed, capping higher gains.
Profit booking seen in auto and pharma stocks, causing minor mid-session dips.
📝 Technical Summary
Trend: Overall uptrend remains intact, with minor intraday corrections.
Support Levels: Immediate support around 82,170–82,200 zone.
Resistance Levels: Strong resistance around 82,500–82,550, breakout beyond which could take Sensex toward 83,000.
Volatility: Low volatility suggests possible slow and steady upward movement
✅ Summary Conclusion
Today, Sensex is mildly positive, driven by financial sector strength and earnings momentum. Some sector rotation is visible with pockets of weakness in PSU and Realty stocks. Volatility remains low, supporting a controlled trading session with limited intraday swings.

Banknifty 1D Timeframe📈 Bank Nifty – Market Overview
Opening Price: Opened strong near 57,250–57,300.
Intraday High: Touched around 57,286 in early trading hours.
Intraday Low: Dropped towards 56,730 during mid to late session.
Current Trading Range: Between 56,730 and 57,280, with a mild negative bias.
Previous Close: Around 56,953.
Current Loss: Trading -0.3% to -0.5% lower compared to previous close.
🔍 Key Drivers Today
Private Banks Hold Strength: Stocks like HDFC Bank and ICICI Bank showed resilience, limiting the downside.
PSU Banks Under Pressure: Public sector banks including SBI, PNB, and Canara Bank underperformed, causing the index to drift lower.
Profit Booking Seen: After an early positive move, intraday profit booking pulled the index back.
Low Volatility: Reduced intraday swings, though a narrow downtrend was visible after the first hour.
📊 Technical Picture
Support Zone: Strong support is visible around 56,730–56,700. A breach could see a quick move toward 56,500–56,000.
Resistance Zone: Resistance remains at 57,250–57,300. If this level is crossed, the next upside target is around 57,500–57,700.
Trend Bias: Neutral to bearish for the day due to selling pressure after opening strength.
✅ Summary Conclusion
Bank Nifty is showing slight weakness today, mainly dragged by public sector banks. The index gave up early gains, but private banks kept the fall in check. Current range is 56,730–57,280. Watch for either a bounce above 57,300 or a break below 56,700 for the next clear trend direction.

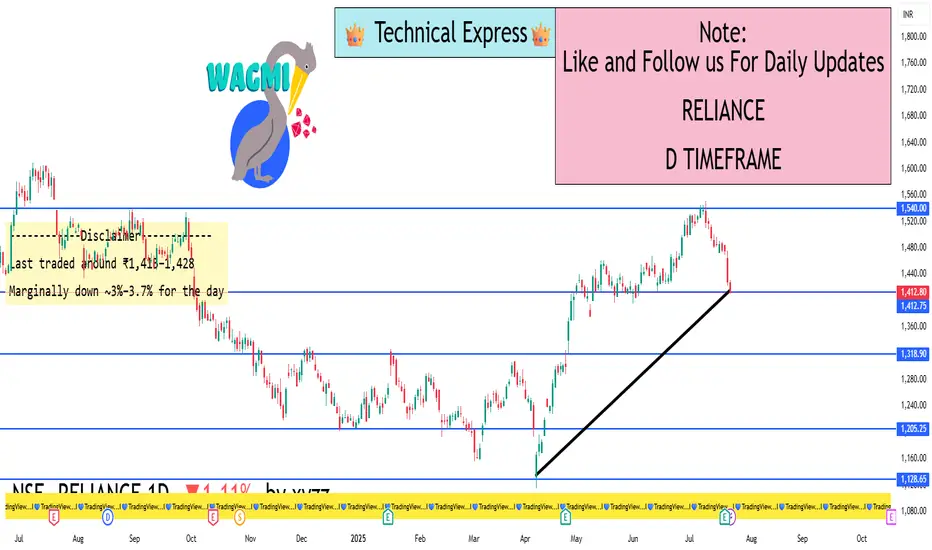
Reliance 1D Timeframe📊 Reliance Industries – Intraday Overview
Previous Close: ₹1,428.6
Opening Price: Opened slightly lower around ₹1,427–₹1,431.
Intraday High: Approximately ₹1,432 during early session.
Intraday Low: Dropped towards ₹1,410 during the mid-session.
Current Trading Price: Trading near ₹1,415, showing around 0.9% to 1% decline from the previous close.
🔍 Key Reasons for Movement Today
Post-Earnings Pressure: After recent earnings, Reliance faced profit booking as some investors booked gains following a previous rally.
Sector Weakness: Energy and telecom segments showed subdued strength while retail remained flat.
Heavy Volume: Trading volume remained above average, suggesting active participation from institutions and retail traders.
📈 Technical Snapshot
Immediate Support Zone: ₹1,410–₹1,412. If this breaks, next support could be near ₹1,400.
Immediate Resistance Zone: ₹1,430–₹1,432. A breakout above this may lead towards ₹1,440–₹1,450.
Trend Positioning: Reliance is currently below its short-term (20-day) moving average, indicating mild short-term weakness but no major breakdown.
💡 Intraday Strategy Levels
Scenario Trigger Point Expected Move
Bullish Reversal Above ₹1,432 Potential upside towards ₹1,445–₹1,450
Neutral/Bearish Between ₹1,410–₹1,430 Consolidation zone with limited moves
Breakdown Risk Below ₹1,410 Could slide to ₹1,400 or even ₹1,390 short-term
✅ Summary Conclusion
Reliance is trading with a mild negative bias, with price action holding between ₹1,410–₹1,432. The overall short-term structure remains weak after intraday profit booking, but key support is holding near ₹1,410. Watch for recovery above ₹1,432 for any bullish reversal or break below ₹1,410 for further downside.
HDFCBANK 1D Timeframe📈 HDFC Bank – Intraday Overview
Opening Price: Opened strong around ₹2,005–₹2,010.
Intraday High: Touched approximately ₹2,018 during early trading.
Intraday Low: Maintained support around ₹2,000.
Current Price: Trading near ₹2,016, showing a gain of around +0.8% to +0.9%.
Previous Close: ₹2,005.
🔍 What’s Driving HDFC Bank Today
Positive Earnings Effect: Strong Q1 earnings with around 12% year-on-year profit growth, bonus share announcements, and dividends have boosted buying interest.
Sector Leadership: Among the strongest performers in the banking sector, helping to support indices like Nifty50 and Bank Nifty.
Consistent Volume: Healthy trading volumes indicate sustained institutional participation.
Strong Sentiment: Momentum remains high with overall positive cues from private banking space.
📊 Technical Summary
Support Level: Strong support exists around ₹2,000–₹2,005.
Resistance Level: Intraday resistance at ₹2,018 with major resistance near ₹2,027 (recent all-time high).
Trend Direction: Bullish trend, as it is making higher lows and maintaining strength above the psychological ₹2,000 mark
✅ Summary Conclusion
HDFC Bank is trading positively today with sustained momentum after strong earnings and corporate actions. Intraday action shows bullish strength above ₹2,000, with the possibility of new highs if it crosses ₹2,018–₹2,027 levels. Technical trend remains positive to bullish for the day.

Advance Option Trading📊 Advance Option Trading – Complete Professional Guide
Advance Option Trading focuses on mastering professional-grade strategies that go beyond simply buying Call and Put options. This approach uses multi-leg strategies, Option Greeks, and volatility analysis to help traders profit in bullish, bearish, sideways, or even volatile and low-volatility markets with better control over risk and reward.
This is how professional traders and institutions trade options — systematically, with probability, and smart risk management.
💡 What is Advanced Options Trading?
In Advanced Options Trading, you learn:
✅ Complex Strategies like Spreads, Straddles, Strangles, Iron Condor
✅ How to combine multiple options in one trade
✅ Reading and using Option Greeks to manage your trades
✅ Analyzing Implied Volatility (IV) to predict market reactions
✅ Managing risk and reward scientifically
🎁 What You Master in Advanced Option Trading
1. Option Greeks
Delta — How much option price moves with the underlying.
Theta — Time decay; how much premium you lose every day.
Gamma — Rate of change of Delta; helps in intraday adjustments.
Vega — Sensitivity to volatility changes.
Rho — Impact of interest rates (minor but useful).
➡️ Professionals use Greeks to adjust their positions and decide when to enter, exit, or hedge trades.
2. Volatility Trading
High IV Strategies → Sell Options (Iron Condor, Credit Spread).
Low IV Strategies → Buy Options (Straddle, Strangle).
IV Crush → Profit from fast drop in implied volatility after events (like earnings/news).
3. Advance Risk Management Techniques
Adjusting trades dynamically as price moves.
Hedging positions when necessary.
Avoiding big losses using proper position sizing.
Managing trades based on Greeks exposure
✅ Benefits of Advanced Options Trading
✅ Predictable Profitability — higher consistency
✅ Works in all market conditions
✅ Controlled Risk, Limited Loss
✅ Higher Win Rate Strategies
✅ Option Greeks help you stay professional
✅ Volatility analysis increases trade accuracy
📝 Who Should Learn Advanced Options Trading?
✅ Traders who know basics and want more control
✅ Those interested in hedging and capital protection
✅ Swing or positional traders wanting steady income
✅ Intraday traders aiming for high probability setups

Institution Option Trading📈 Institutional Option Trading – Complete Detailed Guide
Institutional Option Trading refers to how big financial institutions, such as banks, hedge funds, and proprietary trading firms, use options strategically in the market to manage risk, maximize profits, and control large positions with precision. This approach is highly systematic, data-driven, and based on volume, volatility, and liquidity analysis — very different from how retail traders trade options.
💡 What is Institutional Option Trading?
Institutions don’t gamble with options — they use options for:
✅ Hedging — Protecting big portfolios from market drops.
✅ Income Generation — Earning regular profits through premium selling.
✅ Directional Bets — Placing large directional trades with minimal risk.
✅ Volatility Trading — Making profits from changes in volatility without caring about market direction.
📚 Key Features of Institutional Option Trading
1. Focus on Liquidity
Institutions trade highly liquid options, usually:
Index Options (NIFTY, BANKNIFTY, SPX)
Blue-Chip Stocks (Apple, Reliance, TCS, Infosys)
Commodity Options (Gold, Crude Oil)
They avoid low-volume contracts and always trade in markets where they can enter and exit positions without slippage.
2. Use of Option Greeks
Institutions are masters of Option Greeks:
Delta for direction,
Theta for time decay profits,
Vega for volatility play,
Gamma for adjusting positions dynamically.
They don’t trade blindly but monitor how their positions react to price, time, and volatility changes.
3. Premium Selling Bias
Most institutional setups involve selling options (not just buying).
✅ Credit Spreads, Iron Condors, and Covered Calls are preferred.
Why? Because time decay works in their favor, giving consistent income.
4. Hedging Big Positions
Institutions always hedge their trades.
✅ Example: They may hold large stock positions and sell Covered Calls or buy Protective Puts to reduce risk.
✅ This creates balanced portfolios, minimizing market shocks.
✅ Institutional Trading Tools
Open Interest Analysis
Option Chain Data
IV (Implied Volatility) charts
Volume Profile & Market Profile
Real-time Greeks exposure tools
Delta-neutral hedging platforms
📝 Example of Institutional Option Trade
Scenario: NIFTY at 22,000, sideways expectation for next week.
✅ Strategy: Sell 22,500 Call, Sell 21,500 Put (Iron Condor).
✅ Buy hedges: 23,000 Call, 21,000 Put.
✅ Profit Range: If NIFTY stays between 21,500-22,500 → Max Profit.
✅ Risk Managed: Losses capped, steady time decay profit.
🚀 Benefits of Learning Institutional Option Trading
✅ Consistent income instead of gambling
✅ Risk protection using proper hedging
✅ Trade size management for scalability
✅ Ability to handle big accounts with steady growth
✅ Professional market understanding

Learn Institutional Trading💡 What Does “Learn Institutional Trading” Mean?
When you learn institutional trading, you focus on:
Smart Money Behavior — How institutions think and trade.
Market Manipulation — How the big players create fake moves to trick small traders.
Liquidity Zones — Areas where institutions enter or exit trades.
Order Blocks, Breaker Blocks, Fair Value Gaps — Special price zones where banks place their orders.
Higher Time Frame Analysis — Institutions trade on bigger time frames like 4H, Daily, and Weekly.
🎁 Why Learn Institutional Trading?
✅ Understand why price moves before big news.
✅ Learn where to enter trades with high accuracy.
✅ Trade with peace of mind by following market logic, not emotions.
✅ Get consistent profits by following smart money footprints.
🔥 Key Topics to Learn in Institutional Trading
1. Market Structure
Learn how the price moves in trends: Higher Highs, Higher Lows (Uptrend) and Lower Highs, Lower Lows (Downtrend).
Identify key swing points used by big traders.
2. Liquidity Concepts
Price always goes where liquidity is (stop-loss clusters, pending orders).
Learn about liquidity grabs, stop hunts, and false breakouts.
3. Order Blocks
The secret zones where institutions enter trades.
Once you spot order blocks, you can trade before the market moves big.
4. Fair Value Gap (FVG)
Price always returns to imbalance zones where few trades happened.
Learn to trade the gap fills with high accuracy.
5. Entry Techniques
Learn how to enter using Break of Structure (BOS) or Change of Character (CHOCH).
Use confirmation entries on lower time frames (5min, 15min) after spotting order blocks on higher time frames (4H, Daily)
🧩 Tools You Need to Learn Institutional Trading
✅ TradingView — For chart analysis.
✅ Forex Factory — For news events and market sessions.
✅ SMC Indicators — Some free, some paid tools available for order block marking.
✅ YouTube or Paid Courses — Channels like Mentfx, ICT (Inner Circle Trader), etc.
✅ Trading Journal — To track every trade and improve.
📊 Example Setup (Simple Explanation):
Timeframe: Daily chart for order block → 15min chart for entry.
Step 1: Spot Order Block on Daily.
Step 2: Wait for Liquidity Grab.
Step 3: Wait for CHOCH on 15min.
Step 4: Enter trade with SL below OB → Target previous high/low.
📝 Conclusion:
Learning Institutional Trading = Trading Smart Money Way
This method teaches you to follow the banks and big traders — not get trapped by them. Mastering these skills takes time and practice, but it transforms you from a random gambler into a professional trader.

Master Institutional Trading What is Institutional Trading?
Institutional trading involves market participation by major financial organizations that trade massive volumes of stocks, forex, commodities, or derivatives. Their trades are usually well-planned, research-driven, and executed with precision to avoid large price movements during entries and exits.
Institutions have:
Access to insider research.
Priority order execution.
Advanced algorithmic trading tools.
Huge capital, which can shift market directions.
Retail traders, in contrast, often lack these tools and operate with limited funds. However, by mastering institutional trading concepts, a retail trader can "follow the smart money" and make better, more informed trades.
🎯 Key Concepts in Master Institutional Trading
1. Market Structure
Institutional traders rely heavily on market structure — identifying how price moves in trends, ranges, and key swing points.
Higher Highs & Higher Lows in uptrends.
Lower Highs & Lower Lows in downtrends.
Liquidity zones where institutions place orders.
2. Order Blocks
Order blocks are areas on the chart where institutions have placed large buy or sell orders. These blocks often act as strong support or resistance zones where price reacts heavily.
Bullish Order Block: A zone of institutional buying.
Bearish Order Block: A zone of institutional selling.
3. Liquidity Grabs & Stop Hunts
Institutions often "hunt liquidity" by pushing the price to take out retail stop-losses before moving in the desired direction.
Stop Loss Liquidity: Targeting areas where many traders have their stops placed.
Fakeouts & Traps: Creating false breakouts to capture liquidity.
4. Imbalances / Fair Value Gaps
After strong institutional moves, price often leaves imbalances (gaps) in the market where few or no trades occur. Institutions usually revisit these gaps to "fill" them before continuing the trend.
5. Smart Money Concepts
This strategy focuses on aligning your trades with institutional activity using:
Internal/External Liquidity
Premium/Discount Pricing
High Timeframe Bias
Refined Entry Models
✅ Benefits of Mastering Institutional Trading
Trade with the Market Movers instead of against them.
Higher Accuracy, fewer fakeouts.
Better Risk Management, learning how and where institutions place their stops.
Improved Patience & Discipline, by following smart money footprints.
🚀 Popular Institutional Trading Tools
TradingView for clean charts and liquidity mapping.
MT4/MT5 with SMC indicators.
Volume Profile to see where high-volume trades occur.
Order Flow Tools (more advanced) to analyze order book data.
📝 Final Thoughts
Mastering Institutional Trading is not about copying a magic strategy but learning how the market truly operates from a smart money perspective. It requires patience, backtesting, and constant observation of market behavior. Once you align yourself with institutional flows, your win rate and consistency can dramatically improve.

Gold surges with explosive breakoutGold prices launched into a powerful rally yesterday, soaring from $3,350 to nearly $3,400 — a stunning $50 move, equivalent to 500 pips.
This surge was supported by a weakening US Dollar and a drop in the 10-year Treasury yield, which fell to its lowest level in over a week. On the macro front, if the Federal Reserve signals an earlier-than-expected rate cut, the bullish momentum could extend further in the long term.
Technical outlook: The H2 chart reveals a strong breakout after gold successfully breached the $3,372 resistance zone ( as highlighted in yesterday’s strategy ). Price is now completing a pullback, which may serve as the base for the next bullish wave.
Do you agree with this view? Share your thoughts and let’s discuss together.
Good luck with your trades! ✨

Gold XAUUSD Trading Strategy on July 22, 2025Gold XAUUSD Trading Strategy on July 22, 2025:
Yesterday's trading session, gold prices rebounded strongly from the 3345 area to the 3402 area after the previous multi-timeframe compression.
Basic news: President Donald Trump's trade stance towards Europe became tougher; Europe plans to develop a retaliation plan.
Technical analysis: After the previous multi-timeframe compression, gold prices rebounded strongly again. The previous resistance zone of 3365 - 3370 has now become a support zone for gold prices. Currently, a strong uptrend is showing in multiple timeframes. However, the RSI on the H1 frame is currently quite overbought, we will wait for a correction to the support zone to trade.
Important price zones today: 3365 - 3370, 3347 - 3352 and 3422 - 3427.
Today's trading trend: BUY.
Recommended orders:
Plan 1: BUY XAUUSD zone 3365 - 3367
SL 3362
TP 3370 - 3380 - 3400 - 3420.
Plan 2: BUY XAUUSD zone 3347 - 3349
SL 3344
TP 3352 - 3362 - 3372 - 3400.
Plan 3: SELL XAUUSD zone 3425 - 3427
SL 3430
TP 3422 - 3412 - 3402 - 3382 (small volume).
Wish you a safe, favorable and profitable trading day.💯💯💯💯💯

XAUUSD – The bullish surge isn't over yetGold just delivered an impressive breakout of nearly 500 pips on July 21, fueled by a weakening USD as U.S. housing and manufacturing data showed signs of slowing down. With a bleaker economic outlook and growing expectations that the Fed may cut interest rates in Q4/2025, investors are flocking back to safe-haven assets – and gold is shining bright.
Technically, XAUUSD remains firmly within a clearly defined ascending channel, with price action bouncing sharply off dynamic support. The metal is currently consolidating around the 3,400 zone – if buyers can hold this ground, the door toward 3,440 and beyond could swing wide open.
As long as gold holds above 3,347, bulls remain in full control. This might just be a healthy pullback before the next leg up – don’t miss out as the market gains momentum!

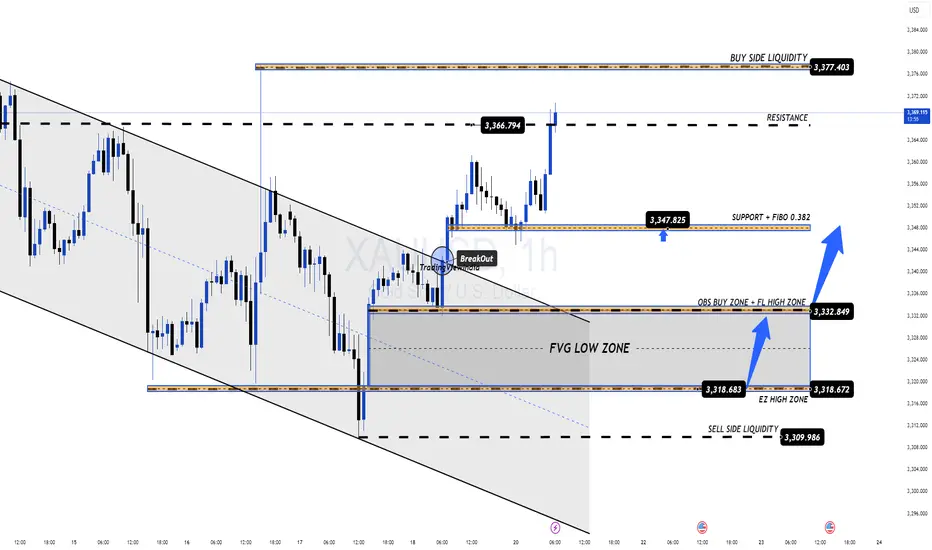
GOLD PLAN 21/07 – START OF THE WEEK FACES STRONG RESISTANCE GOLD PLAN 21/07 – START OF THE WEEK FACES STRONG RESISTANCE – WAIT FOR CONFIRMATION!
Market Overview:
Gold rebounded swiftly after a minor correction late last week, mainly fueled by ongoing geopolitical tensions. While there are no major economic events scheduled this week, macro headlines and global conflicts will likely drive volatility and direction for gold prices in the coming sessions.
Technical Outlook:
Price is quickly approaching a key resistance zone and may retest the Buy Side Liquidity area around 3377 – 3380.
A short-term reaction from sellers is possible, aiming to fill the Fair Value Gaps (FVG) below.
⚠️ Selling at current levels carries higher risk unless clear reversal signals appear. Patience is key!
Trading Plan for Today:
🔹 BUY ZONE: 3331 – 3329
SL: 3325
TP Targets:
3335 – 3340 – 3344 – 3348 – 3352 – 3358 – 3364 – 3370
🔹 SELL ZONE (risky – confirmation needed): 3377 – 3379
SL: 3383
TP Targets:
3372 – 3368 – 3364 – 3360 – 3350
Key Notes:
The 3347 zone currently acts as short-term support for bulls. If this breaks, gold may slide back to fill lower FVG zones.
Watch closely for volume activity during the London session to confirm intraday bias.
Always respect your SL/TP levels to protect your capital, especially early in the week when volatility can spike unpredictably.
💬 Stay patient, trust the structure, and let price come to your zones. Trading is a game of waiting, not chasing!
Good luck, traders!
Nifty 50 Intraday Plan for July 22, 2025🔼 Bullish Levels (Call Side - CE):
Above 25,038 : If the market opens and sustains above this level for 10 minutes, you can consider buying CE. This is the first breakout point, indicating possible upward movement.
Above 25,128: Holding above this level indicates a positive trade view. Momentum is expected to increase, and buyers may become more aggressive. Good zone to initiate or add to CE positions.
Above 25,260 : This is the CE entry level where breakout confirmation happens. If price reaches and sustains this zone, it signals strong bullish strength.
Above 25,380 : This is marked as the short-covering zone. If the price reaches here, it means many short traders may exit, creating a spike. Ideal for booking profits on CE trades.
🔽 Bearish Levels (Put Side - PE):
Below 25,038 : If the price fails to sustain above this level and breaks down with 10-minute candle confirmation, it indicates weakness. PE trades can be considered from here.
Below 24,938 : This level is a clear PE entry level. Sustained trading below this suggests downward continuation.
Below 24,920 : This is the risky PE zone. If the market trades here, PE positions should be handled with caution unless strong selling pressure is seen.
Below 24,800 : This is a safe PE zone. Breakdown below this signals confirmed bearish sentiment, and you can aggressively hold PE options.
Below 24,780 : This is the unwinding level, meaning big players may start exiting their positions, possibly triggering sharp declines. Ideal for booking PE profits or trailing stop-loss tightly.

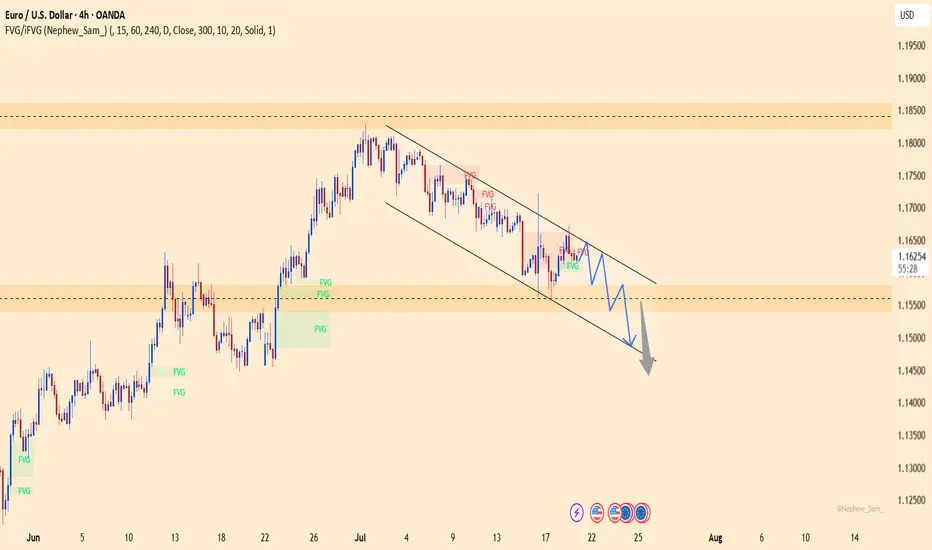
EURUSD – Trend broken, bearish momentum accelerating!EURUSD is maintaining a clear downtrend structure within a well-defined descending channel, with consistently lower highs forming. Fair Value Gaps (FVGs) keep getting rejected, signaling that sellers are firmly in control. The current scenario points to a technical bounce toward the 1.164 zone, followed by a likely rejection back down to the lower boundary near 1.148.
Technical signals confirm the bearish bias as price respects both the trendline and the supply zones, failing to break above recent resistance levels.
On the fundamental side, the ECB has recently struck a more dovish tone due to cooling inflation, while the USD is regaining strength amid expectations that the Fed will keep rates elevated longer — all of which continue to pressure the euro lower.
XAUUSD – Breakout or Continued Accumulation?Gold continues to respect a solid bullish structure within an ascending price channel. After a healthy pullback from recent highs, the price has retested a key technical support area and is showing signs of a strong rebound.
Current price action reveals that the market is respecting both the FVG zone and the rising support line—clear signals that smart money is still leaning toward the buy side. The next bullish targets lie around the upper resistance zone.
From a macro perspective, weaker-than-expected U.S. retail sales have placed downward pressure on the dollar, fueling speculation that the Fed may soon pivot toward easing. This adds momentum to gold’s upside potential.

Gold Prices Rise Amidst USD WeaknessAmong precious metals, prices are increasing due to the weakening of the USD. There are no negative scenarios for gold in the medium term, considering the current developments: US government spending is out of control, ongoing trade tensions, uncertain inflation, and increasing criticism aimed at the Fed.
As of the time of writing, gold has risen by 0.3% in the past 24 hours, equivalent to an increase of 100 pips, currently trading at 3,350 USD.
The current environment is highly favorable for gold, especially as investors lose confidence in the stability of US monetary policy. If the Fed begins to concede to political pressure, gold prices could break previous highs and head toward 3,440 USD/ounce in the short term.
Do you agree with this view?

SEBI’s Derivatives Market Reforms & Jane Street Fallout1. The Bigger Picture: Why SEBI Intervened
India is currently the world’s largest equity derivatives market in terms of contracts traded. On expiry days, the trading volume in index derivatives—especially options—is often more than 300 times higher than that of the cash market. This unprecedented scale might sound like a success story at first glance, but SEBI, the Securities and Exchange Board of India, saw warning signs flashing bright red.
Over the past few years, retail traders have swarmed into the derivatives space, especially index options like Bank Nifty and Nifty 50. Most of them are drawn in by the promise of quick profits and leveraged exposure. However, a SEBI study revealed that 91% of retail traders in derivatives ended up losing money. That’s an alarming statistic. It signaled that the market was becoming speculative rather than investment-oriented.
Additionally, the structure of the market had become heavily tilted towards short-tenure options—weekly, and even daily expiries—turning it into a speculative playground. This over-dependence on weekly contracts resulted in wild swings, sharp intraday moves, and extreme volatility, especially on Thursdays (the weekly expiry day). This environment wasn't healthy—neither for long-term investors nor for the broader financial ecosystem.
SEBI saw this as a structural issue and decided to take bold steps to reform the derivatives market and make it safer, more rational, and more sustainable.
2. SEBI’s Core Reforms: Changing the Game
a) Extending Contract Tenure
One of the biggest problems SEBI identified was the overuse of ultra-short-term contracts. Weekly options had become the norm, with traders focusing on short bursts of market movement rather than making informed investment or hedging decisions.
To counter this, SEBI is planning to extend the tenure of derivative contracts. This means:
Less frequent expiries.
Longer-dated instruments becoming more liquid.
Reduced scope for expiry-based volatility and manipulation.
By pushing the market toward longer expiry contracts (like monthly and quarterly), SEBI wants to encourage thoughtful strategies, proper hedging, and discourage fast-money, short-term gambling.
b) Discouraging Retail Over-Speculation
Retail participation in the F&O market has skyrocketed, but most retail traders don’t fully understand the risks involved. SEBI has already taken several steps to discourage reckless speculation, such as:
Reducing the number of expiries per month.
Increasing the lot size of index futures and options, making it harder for small-ticket traders to over-leverage.
Introducing detailed risk disclosures on broker apps to educate traders about potential losses.
These steps are aimed at protecting small investors and bringing more stability to the market.
c) Focusing on the Cash Market
India’s cash equity market is relatively underdeveloped when compared to its derivatives segment. SEBI aims to rebalance this. By encouraging growth in the cash market, SEBI hopes to reduce the over-reliance on F&O and create a healthier, more resilient market structure.
3. The Jane Street Controversy: What Happened?
In July 2025, SEBI dropped a regulatory bombshell by banning Jane Street, a major US-based high-frequency trading (HFT) firm, from Indian markets. This wasn’t just a slap on the wrist—it was a full-blown interim order with massive consequences.
The Allegations:
SEBI alleged that Jane Street engaged in manipulative expiry-day strategies over a multi-year period. Here’s what SEBI believes happened:
In the morning of expiry days, Jane Street allegedly bought large volumes of index-heavy stocks. This artificially pushed the index higher.
At the same time, they opened short positions in index options, betting that the index would fall later.
In the afternoon, they unwound their stock positions, which pulled the index down.
As the index dropped, their short options positions profited heavily.
This strategy allowed them to make massive profits on expiry days, using their firepower to allegedly manipulate both the cash and derivative markets.
SEBI’s Action:
Barred Jane Street from trading in Indian markets.
Ordered them to deposit over ₹4,800 crore (~$570 million) in suspected unlawful gains.
Accused the firm of using its dominant market position to rig expiry-day movements.
Jane Street, of course, denied the allegations, claiming that their trades were legal arbitrage and part of liquidity provisioning. They are challenging the order in court, but the damage—both reputational and market-wide—has already been done.
4. The Immediate Fallout: Markets Take a Hit
The ban on Jane Street had a chilling effect on the market. Here's what followed:
a) Volume Drops
Jane Street was a major market maker in India’s derivatives space, especially on expiry days. After the ban:
F&O volumes dropped by over 30%.
Index options saw significantly reduced liquidity.
The premium turnover on the NSE fell by nearly 36%.
This wasn’t just a temporary blip. It revealed how dependent the Indian market had become on a few HFT firms to provide liquidity and manage spreads.
b) Volatility Dips
Interestingly, India’s volatility index (VIX) dropped to multi-month lows post the ban. With fewer players like Jane Street aggressively trading expiry moves, the markets became calmer. While this might seem good, too little volatility can reduce trading opportunities and narrow market participation.
c) Wider Spreads and Execution Slippage
With fewer market makers and less volume, traders—especially institutions—began facing wider bid-ask spreads. That means it became more expensive to execute trades, especially in large quantities. This can hurt mutual funds, FIIs, and even large domestic traders.
5. Broader Implications for the Indian Market
a) SEBI’s Strength as a Regulator
This episode showcases that SEBI is serious about enforcing discipline, even if it means challenging a global giant like Jane Street. That sends a strong signal to both domestic and international players: India’s markets are not a free-for-all.
b) Liquidity Vacuum
With Jane Street gone, there's a temporary liquidity vacuum. Other firms are cautious, unsure if they might be targeted next. SEBI needs to strike a balance—encouraging good players while weeding out bad behavior.
c) Investor Confidence and Market Maturity
While retail traders might find the new reforms and lower volatility frustrating, long-term investors and institutions are likely to benefit from a more predictable and transparent market.
6. Legal Battle and Global Ramifications
Jane Street has taken the legal route, depositing the required funds while appealing the SEBI ban. Depending on how the case proceeds:
It could set new legal precedents in Indian market jurisprudence.
It may influence how SEBI handles future cases involving algorithmic or HFT trading.
Other global firms might review or revise their India strategies, balancing opportunity with regulatory risk.
If SEBI wins the case, it strengthens its position as a tough, credible regulator. If Jane Street wins, it may force SEBI to revisit how it defines and regulates market manipulation, especially in the algo/HFT space.
7. What This Means for You (the Trader/Investor)
For Retail Traders:
Expect fewer sharp expiry-day moves. Strategies based on quick, expiry-day scalping may need to be adapted.
Market may feel slower, but potentially safer.
You’ll need to focus more on strategy, research, and planning, instead of gambling on weekly moves.
For Institutions:
Market access costs may rise due to wider spreads.
Less volatility may reduce arbitrage and quant trading opportunities.
Need for more diversified trading models, including participation in the cash and bond markets.
For Market Observers and Policy Thinkers:
This is a rare opportunity to watch a major regulatory shift unfold.
India’s market is transitioning from being a trader’s playground to an investor’s ecosystem.
8. What Comes Next?
SEBI will likely roll out more reforms—stricter monitoring, revised rules for expiry days, and enhanced surveillance.
New market makers may enter the space, possibly Indian firms or global ones with stronger compliance protocols.
Jane Street’s legal outcome will influence how aggressively foreign algo firms operate in India going forward.
✍️ Final Word
The SEBI vs Jane Street saga is more than a single enforcement action—it’s a symbol of India’s market maturity. By reforming derivatives and holding big players accountable, SEBI is trying to create a safer, more balanced market for everyone—from retail investors to institutional giants.
The road ahead may involve some pain—lower volumes, fewer trading thrills—but the foundation being laid could ensure a more sustainable, fair, and globally respected financial market

Sensex 1D Timeframe✅ Current Market Status:
Closing Price: ₹82,452.00
Change: –148.32 points
Percentage Change: –0.18%
Day’s Range: ₹82,300.70 – ₹82,892.30
52-Week Range: ₹65,302.20 – ₹83,822.00
🔍 Key Technical Levels:
📌 Support Zones:
Support 1: ₹82,200 – minor trendline support
Support 2: ₹81,800 – recent bounce zone
Support 3: ₹81,000 – strong institutional buying level
📌 Resistance Zones:
Resistance 1: ₹82,900 – intraday high rejected
Resistance 2: ₹83,400 – multi-session top
Resistance 3: ₹83,800 – all-time high zone
🕯️ Candlestick Pattern:
Candle Type: Bearish body with upper wick
Formation: Reversal candle after a small bounce
Implication: Supply seen near highs; indicates hesitation in buying
📈 Indicator Status (1D Timeframe):
Indicator Value & Signal
RSI (14) ~45 – Neutral but slipping downward
MACD Bearish crossover – sellers gaining control
20 EMA ~₹82,780 – Price below this level (short-term bearish)
50 EMA ~₹82,000 – May act as dynamic support soon
📊 Price Structure Summary:
Sensex is in a tight range between ₹81,800 and ₹83,400.
The price rejected from ₹82,900, showing sellers are active.
If ₹82,200 breaks, we might see movement toward ₹81,800 and ₹81,000.
A bullish breakout will only occur above ₹83,400 with strong volume.
🧠 Market Sentiment & Institutional View:
Volatility: Moderate — no extreme panic or euphoria
Volume: Average — no big accumulation seen
Smart Money Activity: Likely waiting near breakout levels or lower discount zones (₹81,000)
🔚 Summary:
🔴 Short-Term Bias: Slightly Bearish
🟡 Key Range: ₹81,800 – ₹83,400
✅ Buyers' Entry Point: Above ₹83,400
⚠️ Sellers' Trigger: Below ₹82,200 or ₹81,800 for more downside
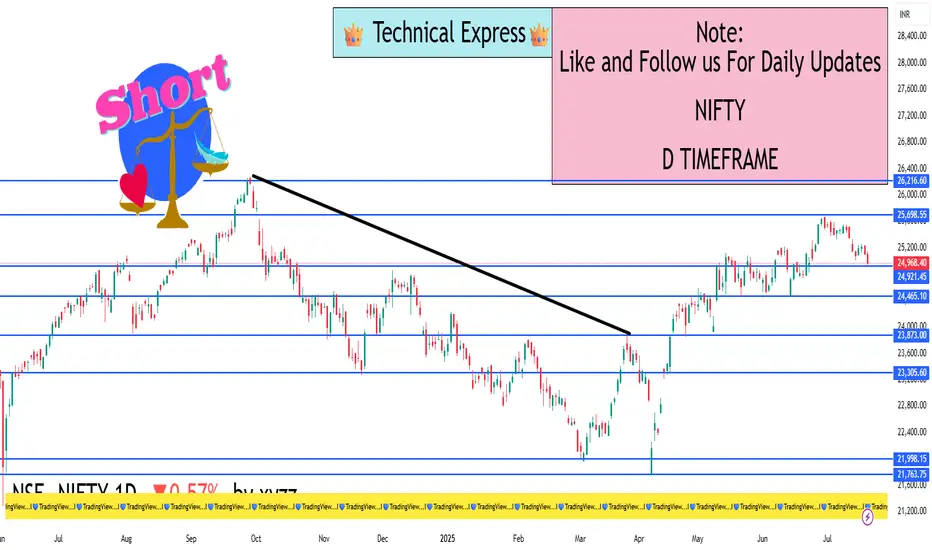
Nifty 1D Timeframe✅ Current Market Status:
Closing Price: ₹24,972.50
Change: –95.20 points
Percentage Change: –0.38%
Day’s Range: ₹24,905.60 – ₹25,095.10
52-Week Range: ₹19,638.30 – ₹25,194.60
🔍 Key Technical Levels:
📌 Support Zones:
Support 1: ₹24,900 – Intraday low and key psychological level
Support 2: ₹24,750 – Previous breakout zone
Support 3: ₹24,500 – Short-term trendline base
📌 Resistance Zones:
Resistance 1: ₹25,100 – Day’s high and minor barrier
Resistance 2: ₹25,200 – All-time high
Resistance 3: ₹25,500 – Next potential rally target if breakout succeeds
🕯️ Candlestick Pattern:
Recent Candle: Bearish candle after range-bound session
Price Action: Failed to sustain above ₹25,100
Implication: Weakness around highs, possible pullback toward support
📊 Market Structure Summary:
Nifty formed a double top near ₹25,200, indicating exhaustion
Currently testing ₹24,900 – if broken, next support is ₹24,750
A breakout will only be valid above ₹25,200 with strong volume
🧠 Institutional Behavior:
Likely profit booking near highs
No major signs of heavy accumulation
May re-enter above ₹25,200 or below ₹24,500 for value buying
🔚 Summary:
🔴 Short-Term Bias: Slightly Bearish
🟡 Watch Levels: ₹24,900 (support) and ₹25,200 (resistance)
✅ Buyers: Wait for breakout above ₹25,200
⚠️ Sellers: Watch for breakdown below ₹24,900 or ₹24,750
Banknifty 1D Timeframe✅ Current Market Status:
Closing Price: ₹56,283.00
Change: –545.80 points
Percentage Change: –0.96%
Day’s Range: ₹56,204.85 – ₹56,705.15
52-Week Range: ₹47,702.90 – ₹57,628.40
🔍 Key Technical Levels:
📌 Support Levels:
Support 1: ₹56,000 – Price is hovering close to this level
Support 2: ₹55,800 – Previous low zone
Support 3: ₹55,200 – Strong buying area from last month
📌 Resistance Levels:
Resistance 1: ₹56,700 – Intraday rejection zone
Resistance 2: ₹57,100 – Swing high from earlier this week
Resistance 3: ₹57,600 – 52-week high
🕯️ Candlestick Analysis:
Candle Type: Big bearish candle with upper wick
Pattern: Bearish continuation — sellers are active
Implication: If price stays below ₹56,200, further downside possible
📈 Indicator Overview:
Indicator Signal
RSI (14) ~48 – Neutral zone, slightly bearish
MACD Bearish crossover – Downward momentum
20-Day EMA ~₹56,500 – Price below this, showing short-term weakness
50-Day EMA ~₹55,600 – Could act as support
📊 Market Sentiment:
Volatility: High intraday swings observed
Volume: Slightly above average – confirms strong seller presence
Institutional Action: Likely booking profits at higher levels
🔚 Summary & Outlook:
🔴 Short-Term Bias: Bearish
🟡 Watch Levels: ₹56,000 support and ₹56,700 resistance
✅ For Buyers: Wait for a strong close above ₹56,700
⚠️ For Sellers: Breakdown below ₹56,000 could lead to ₹55,200

Learn Institutional Trading Part-7🎯 What is Institutional Trading?
Institutional trading is the process by which large entities — such as investment banks, hedge funds, mutual funds, and proprietary trading firms — participate in the market using large volumes of capital. These institutions don’t follow the strategies used by most retail traders. Instead, they use techniques that are based on market structure, liquidity, and logic, not indicators or news.
When you master institutional trading, you learn how to think like the smart money. You understand why price moves, not just how. This knowledge allows you to anticipate large moves instead of reacting to them late.
🔍 Key Concepts to Master
✅ Market Structure Phases
Institutions move through four major phases:
Accumulation – Quiet buying or selling in a range
Manipulation – False moves to trap retail traders
Expansion – Sharp move in the real direction
Distribution – Profit-taking while the crowd enters late
Understanding these phases helps you spot entries early and avoid fakeouts.
✅ Liquidity & Stop Hunts
Institutions need liquidity to enter large positions. They often drive price toward zones full of stop-losses or breakout traders, then reverse the market. These areas are called liquidity pools.
Retail traders get stopped out — smart traders enter after the trap, with the institutions.
✅ Order Blocks & Imbalances
Institutions often leave footprints through large unbalanced candles or zones (called order blocks and fair value gaps). These areas act as magnets for future price moves. Mastering these zones gives you high-accuracy entries with solid risk-reward.
💼 Why It Works
Retail traders lose because they follow emotion and indicators. Institutional traders win because they:
Wait for precision setups
Manage risk with discipline
Trade based on logic, structure, and liquidity
Don’t chase trades — they let the market come to them
When you master institutional trading, you adopt this same mindset. You become patient, calculated, and consistent
