Sensex 1D Timeframe✅ Current Market Status:
Closing Price: ₹82,452.00
Change: –148.32 points
Percentage Change: –0.18%
Day’s Range: ₹82,300.70 – ₹82,892.30
52-Week Range: ₹65,302.20 – ₹83,822.00
🔍 Key Technical Levels:
📌 Support Zones:
Support 1: ₹82,200 – minor trendline support
Support 2: ₹81,800 – recent bounce zone
Support 3: ₹81,000 – strong institutional buying level
📌 Resistance Zones:
Resistance 1: ₹82,900 – intraday high rejected
Resistance 2: ₹83,400 – multi-session top
Resistance 3: ₹83,800 – all-time high zone
🕯️ Candlestick Pattern:
Candle Type: Bearish body with upper wick
Formation: Reversal candle after a small bounce
Implication: Supply seen near highs; indicates hesitation in buying
📈 Indicator Status (1D Timeframe):
Indicator Value & Signal
RSI (14) ~45 – Neutral but slipping downward
MACD Bearish crossover – sellers gaining control
20 EMA ~₹82,780 – Price below this level (short-term bearish)
50 EMA ~₹82,000 – May act as dynamic support soon
📊 Price Structure Summary:
Sensex is in a tight range between ₹81,800 and ₹83,400.
The price rejected from ₹82,900, showing sellers are active.
If ₹82,200 breaks, we might see movement toward ₹81,800 and ₹81,000.
A bullish breakout will only occur above ₹83,400 with strong volume.
🧠 Market Sentiment & Institutional View:
Volatility: Moderate — no extreme panic or euphoria
Volume: Average — no big accumulation seen
Smart Money Activity: Likely waiting near breakout levels or lower discount zones (₹81,000)
🔚 Summary:
🔴 Short-Term Bias: Slightly Bearish
🟡 Key Range: ₹81,800 – ₹83,400
✅ Buyers' Entry Point: Above ₹83,400
⚠️ Sellers' Trigger: Below ₹82,200 or ₹81,800 for more downside
M-forex
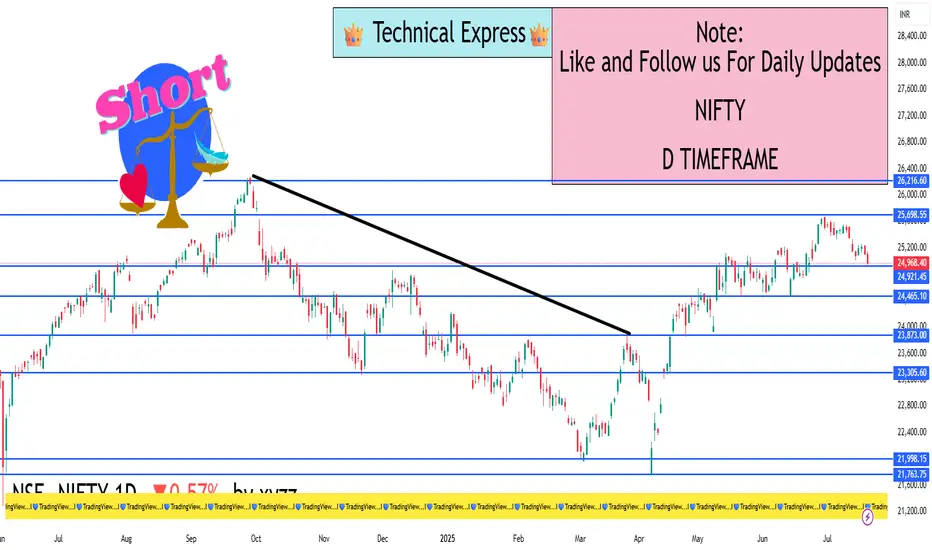
Nifty 1D Timeframe✅ Current Market Status:
Closing Price: ₹24,972.50
Change: –95.20 points
Percentage Change: –0.38%
Day’s Range: ₹24,905.60 – ₹25,095.10
52-Week Range: ₹19,638.30 – ₹25,194.60
🔍 Key Technical Levels:
📌 Support Zones:
Support 1: ₹24,900 – Intraday low and key psychological level
Support 2: ₹24,750 – Previous breakout zone
Support 3: ₹24,500 – Short-term trendline base
📌 Resistance Zones:
Resistance 1: ₹25,100 – Day’s high and minor barrier
Resistance 2: ₹25,200 – All-time high
Resistance 3: ₹25,500 – Next potential rally target if breakout succeeds
🕯️ Candlestick Pattern:
Recent Candle: Bearish candle after range-bound session
Price Action: Failed to sustain above ₹25,100
Implication: Weakness around highs, possible pullback toward support
📊 Market Structure Summary:
Nifty formed a double top near ₹25,200, indicating exhaustion
Currently testing ₹24,900 – if broken, next support is ₹24,750
A breakout will only be valid above ₹25,200 with strong volume
🧠 Institutional Behavior:
Likely profit booking near highs
No major signs of heavy accumulation
May re-enter above ₹25,200 or below ₹24,500 for value buying
🔚 Summary:
🔴 Short-Term Bias: Slightly Bearish
🟡 Watch Levels: ₹24,900 (support) and ₹25,200 (resistance)
✅ Buyers: Wait for breakout above ₹25,200
⚠️ Sellers: Watch for breakdown below ₹24,900 or ₹24,750
Banknifty 1D Timeframe✅ Current Market Status:
Closing Price: ₹56,283.00
Change: –545.80 points
Percentage Change: –0.96%
Day’s Range: ₹56,204.85 – ₹56,705.15
52-Week Range: ₹47,702.90 – ₹57,628.40
🔍 Key Technical Levels:
📌 Support Levels:
Support 1: ₹56,000 – Price is hovering close to this level
Support 2: ₹55,800 – Previous low zone
Support 3: ₹55,200 – Strong buying area from last month
📌 Resistance Levels:
Resistance 1: ₹56,700 – Intraday rejection zone
Resistance 2: ₹57,100 – Swing high from earlier this week
Resistance 3: ₹57,600 – 52-week high
🕯️ Candlestick Analysis:
Candle Type: Big bearish candle with upper wick
Pattern: Bearish continuation — sellers are active
Implication: If price stays below ₹56,200, further downside possible
📈 Indicator Overview:
Indicator Signal
RSI (14) ~48 – Neutral zone, slightly bearish
MACD Bearish crossover – Downward momentum
20-Day EMA ~₹56,500 – Price below this, showing short-term weakness
50-Day EMA ~₹55,600 – Could act as support
📊 Market Sentiment:
Volatility: High intraday swings observed
Volume: Slightly above average – confirms strong seller presence
Institutional Action: Likely booking profits at higher levels
🔚 Summary & Outlook:
🔴 Short-Term Bias: Bearish
🟡 Watch Levels: ₹56,000 support and ₹56,700 resistance
✅ For Buyers: Wait for a strong close above ₹56,700
⚠️ For Sellers: Breakdown below ₹56,000 could lead to ₹55,200

Learn Institutional Trading Part-7🎯 What is Institutional Trading?
Institutional trading is the process by which large entities — such as investment banks, hedge funds, mutual funds, and proprietary trading firms — participate in the market using large volumes of capital. These institutions don’t follow the strategies used by most retail traders. Instead, they use techniques that are based on market structure, liquidity, and logic, not indicators or news.
When you master institutional trading, you learn how to think like the smart money. You understand why price moves, not just how. This knowledge allows you to anticipate large moves instead of reacting to them late.
🔍 Key Concepts to Master
✅ Market Structure Phases
Institutions move through four major phases:
Accumulation – Quiet buying or selling in a range
Manipulation – False moves to trap retail traders
Expansion – Sharp move in the real direction
Distribution – Profit-taking while the crowd enters late
Understanding these phases helps you spot entries early and avoid fakeouts.
✅ Liquidity & Stop Hunts
Institutions need liquidity to enter large positions. They often drive price toward zones full of stop-losses or breakout traders, then reverse the market. These areas are called liquidity pools.
Retail traders get stopped out — smart traders enter after the trap, with the institutions.
✅ Order Blocks & Imbalances
Institutions often leave footprints through large unbalanced candles or zones (called order blocks and fair value gaps). These areas act as magnets for future price moves. Mastering these zones gives you high-accuracy entries with solid risk-reward.
💼 Why It Works
Retail traders lose because they follow emotion and indicators. Institutional traders win because they:
Wait for precision setups
Manage risk with discipline
Trade based on logic, structure, and liquidity
Don’t chase trades — they let the market come to them
When you master institutional trading, you adopt this same mindset. You become patient, calculated, and consistent

Learn Institutional Trading Part-5🧠 What is Option Trading?
Option trading is the practice of buying and selling options contracts on stocks, indices, currencies, or commodities.
An option is a financial derivative — a contract that gives the buyer the right (but not the obligation) to buy or sell an underlying asset at a predetermined price on or before a specific date.
There are two types of options:
✅ Call Option: Right to buy the asset.
✅ Put Option: Right to sell the asset.
📝 Key Terms:
Strike Price: The price at which the option can be exercised.
Premium: The cost of buying the option.
Expiry Date: The last date the option is valid.
Lot Size: Options are traded in fixed quantities, known as lots.
Underlying: The asset the option is based on (e.g., Nifty, stock, commodity).
📊 Basic Example of Option Trading
Imagine stock ABC is trading at ₹100.
You buy a Call Option with strike price ₹105, expiring in 1 week, paying ₹3 as premium.
If ABC goes to ₹110, your option is worth ₹5 (profit = ₹2 per share).
If ABC stays below ₹105, your loss is limited to ₹3 (the premium paid).
Options allow you to leverage trades — you control large value positions with smaller capital.
🔍 Why Trade Options?
✅ Low Investment, High Potential: You pay only the premium, not the full asset price.
✅ Hedging: Protect long-term investments from market downturns.
✅ Strategic Flexibility: Make profits in bullish, bearish, or even sideways markets.
✅ Defined Risk: In buying options, your maximum loss is limited to the premium.
🧱 Types of Option Trading Strategies
There are two categories of traders:
Option Buyers
Option Sellers (Writers)
Let’s explore both with common strategies.
🔼 1. Option Buying Strategies
✔️ Bullish Strategies
Long Call: Buy Call expecting price to rise.
Bull Call Spread: Buy one Call and Sell higher strike Call to reduce cost.
✔️ Bearish Strategies
Long Put: Buy Put expecting price to fall.
Bear Put Spread: Buy higher strike Put and sell lower strike Put.
✔️ Volatile Market Strategy
Long Straddle: Buy both Call and Put at the same strike (profits in big moves).
Long Strangle: Buy OTM Call and OTM Put — cheaper than Straddle.
🔽 2. Option Selling (Writing) Strategies
Option sellers benefit from time decay and collect premium from buyers.
✔️ Range-Bound Strategies
Short Straddle: Sell both Call and Put at same strike (profits if price stays stable).
Iron Condor: Sell OTM Call and Put, buy further OTM Call and Put (limited risk).
✔️ Directional Strategies
Covered Call: Hold stock, sell Call for income.
Naked Put: Sell Put expecting price to stay above strike.
🛑 Warning: Selling options can have unlimited risk if not hedged properly. Only experienced traders should use these strategies.
🕰️ Time Decay & Option Greeks
Option prices are influenced by multiple factors. The most important ones are called Option Greeks:
🔹 Delta – Measures how much the option price moves for a ₹1 move in the underlying.
Call: Delta between 0 to +1
Put: Delta between 0 to -1
🔹 Theta – Measures time decay. Options lose value as they approach expiry.
🔹 Vega – Measures sensitivity to volatility. Higher volatility = higher premium.
🔹 Gamma – Measures how Delta changes as the underlying moves.
Understanding Greeks helps you manage risk, timing, and volatility in trades
💼 Option Trading in Institutional Trading
Institutions like hedge funds, FIIs, and banks use options to:
Hedge portfolios
Build complex arbitrage positions
Exploit volatility
Earn passive income via writing options
They don’t just guess direction — they analyze Open Interest, volume, VIX (volatility index), and option chains to create data-driven positions.
Retail traders can track institutional activity by analyzing:
Option Chain Data
Open Interest Build-up
Put-Call Ratios (PCR)
Volume Spikes in OTM options
📈 Real-World Example: Bank Nifty Intraday Option Buy
Bank Nifty is at 48,000.
You buy a 48,100 CE for ₹150.
It jumps to 48,400 within 1 hour.
Your CE premium rises to ₹350.
You book profit: ₹200 * 15 lot size = ₹3,000 profit (before brokerage/taxes).
Such short-term intraday moves can yield high returns, but also come with high risk.
📉 Common Mistakes in Option Trading
🚫 Holding options till expiry without purpose
🚫 Buying OTM (far out-of-money) options hoping for big moves
🚫 Ignoring Theta decay
🚫 Not managing position size
🚫 Lack of understanding of Option Greeks
🛡️ Risk Management Tips
💰 Never risk more than 2-5% of capital per trade.
✅ Use stop-loss or premium SL.
📚 Always trade with a defined strategy.
🧊 Avoid overtrading in high-volatility news events.
📊 Backtest your setups and understand risk-reward ratios.
🧠 Mindset for Option Trading
Be logical, not emotional.
Accept losses as part of the game.
Focus on probability, not certainty.
Be a risk manager first, trader second.
Learn from your trades — both wins and losses.
🎯 Final Words: Why You Should Learn Option Trading
Option trading is not gambling. It’s a skill — one of the most strategic tools in the financial markets. With proper education, discipline, and practice, options can give you:
🔹 More ways to profit in any market
🔹 Better control over risk
🔹 Flexible strategies for every condition
Whether you want to day trade Nifty options or hedge your long-term investments, mastering option trading puts you ahead of 90% of retail traders

Learn Institutional Trading Part-3🔍 What You'll Learn:
✅ Market Structure Mastery
Understand how price moves through different phases — accumulation, manipulation, expansion, and distribution — and how institutions position themselves at each level.
✅ Order Flow & Liquidity Concepts
Institutions focus on liquidity. Learn how they seek out stop-losses and resting orders to fill large positions without moving the market too much.
✅ Smart Money Concepts
Identify where "smart money" (institutional money) is entering and exiting the market using tools like:
Fair Value Gaps (FVG)
Order Blocks
Breaker Blocks
Liquidity Pools
Inducement and Mitigation zones
✅ Volume & Open Interest Analysis
Discover how volume analysis and options open interest reveal institutional footprints in futures and options markets.
✅ Institutional Risk Management
Learn how institutions manage massive portfolios with strict risk control, position sizing, and hedging techniques.
✅ High Probability Trade Setups
Master trade setups based on institutional logic — including trap setups, liquidity grabs, and imbalance trades — with better reward-to-risk ratios.
🧠 Why Learn Institutional Trading?
Retail traders often fall prey to emotional trading and market manipulation. Institutional traders, however, rely on logic, data, and strategy. By learning institutional trading:
You'll stop chasing price and start anticipating moves.
You'll learn to trade with the big players, not against them.
You'll gain confidence by using smart money principles instead of random indicators.
🚀 Who Should Learn This?
Day traders looking to level up
Swing traders aiming for high precision
Option traders focusing on large-scale setups
Anyone who wants to understand how real money moves the market
📈 Ready to Ride the Big Moves?
“Learn Institutional Trading” is your pathway to mastering the strategies that drive the global markets. Say goodbye to confusion and emotional trades — and start thinking like a professional.

Master Candle Sticks part-2🔥 What Are Candlesticks?
A candlestick is a visual representation of price movement within a specific time period (1 minute, 1 hour, 1 day, etc.). It consists of:
Body – The area between the open and close.
Wick (Shadow) – The high and low prices reached.
Color – Usually green (bullish) or red (bearish).
🧠 Why Learn Master Candlestick Patterns?
Mastering candlestick patterns helps traders:
Identify trend reversals or continuations.
Get early entry or exit signals.
Understand market psychology and price action.
Improve risk-reward ratios in trades.
🧭 Top Master Candlestick Patterns (Explained Simply)
Here are some of the most important candlestick patterns every trader should master:
1. Doji
🔍 Indecision in the market
Shape: Small body, long wicks
Meaning: Buyers and sellers are equal – could indicate a reversal if found after a trend.
Types: Standard Doji, Long-Legged Doji, Dragonfly, Gravestone
2. Hammer 🔨
📈 Bullish reversal pattern
Shape: Small body at top, long lower wick
Appears: After a downtrend
Signal: Buyers are stepping in strongly
3. Inverted Hammer
📈 Also bullish reversal
Shape: Small body at bottom, long upper wick
Appears: After a downtrend
Signal: Buyers testing resistance – may rise soon
4. Shooting Star 🌠
📉 Bearish reversal
Shape: Small body at bottom, long upper wick
Appears: After an uptrend
Signal: Sellers taking control
5. Engulfing Patterns
A. Bullish Engulfing
Two candles: First red (small), second green (larger, fully covers the red)
Appears: At the bottom of a downtrend
Signal: Strong reversal to upside
B. Bearish Engulfing
Two candles: First green (small), second red (large, covers the green)
Appears: At the top of an uptrend
Signal: Reversal to downside
6. Morning Star 🌅
📈 Three-candle bullish reversal
1st: Long red
2nd: Small (any color)
3rd: Strong green
Appears: After downtrend
7. Evening Star 🌇
📉 Three-candle bearish reversal
1st: Long green
2nd: Small (indecision)
3rd: Strong red
Appears: After uptrend
8. Marubozu
💡 Strong trend candle
No wicks (only body)
Green Marubozu: Full bullish power
Red Marubozu: Full bearish power
9. Spinning Top
🔄 Low momentum or indecision
Small body, equal upper and lower wicks
Shows uncertainty – market could reverse or consolidate
📘 Tips to Master Candlestick Reading
Don’t rely on just one candle. Always see the pattern in context of previous trend.
Use volume with candlesticks – A reversal candle with high volume is more powerful.
Combine with other tools – Support/Resistance, Moving Averages, RSI, etc.
Practice on charts daily – Backtest on historical data
✅ Final Thoughts
Master Candlestick Patterns are a foundation for price action trading. They don't work alone but when used wisely with technical indicators and proper risk management, they can give high-probability setups.

GOLD WEEKLY OUTLOOK | JULY 21–25 GOLD WEEKLY OUTLOOK | JULY 21–25
Get Ready for a New Trading Week 🇮🇳
🔍 Market Recap:
Gold showed a strong bullish reversal late last week after sweeping liquidity around the FVG ZONE near 3310. Price quickly surged toward the OBS SELL ZONE around 335x–336x.
By Friday’s close, however, price reacted sharply to a confluence of technical zones (OBS + FIBO) and settled below the VPOC, hinting at a potential short-term top.
📉 Outlook for July 21–25:
📌 No major economic events are lined up next week.
⚠️ However, geopolitical tensions, global trade policies, and military news could bring sudden volatility.
Stay alert for unexpected liquidity spikes!
🧠 Technical Setup – H1 Mid-Term View:
Gold has been forming multiple Fair Value Gaps (FVGs) due to aggressive bullish moves.
While price has reached new highs, lower FVG zones remain unfilled – creating a strong possibility of a retracement.
🔁 Expected Scenario:
We may see price retrace to the 3310–3305 zone to fill these gaps, then potentially resume bullish movement.
📍 Trading Strategy for the Week:
🔸 Wait for price to enter lower FVG zones
🔸 Look for early BUY signals at key confluence areas such as:
CP zones
Fibonacci retracement levels
Volume/price reaction levels
🎯 Bullish Target Zones:
Primary target remains: 333x – 336x
If momentum continues after the pullback, we could see a move toward the Buy Side Liquidity near 3371.749
✅ Key Reminders for Indian Traders:
🚫 Avoid emotional buying at highs (no FOMO!)
📏 Stick to your TP/SL rules – risk management is critical, especially during uncertain global headlines
📊 Stay focused and trade with a plan
🌟 Wishing you a restful weekend. Come back refreshed and ready to dominate the charts next week!
🚀 Good luck & happy trading

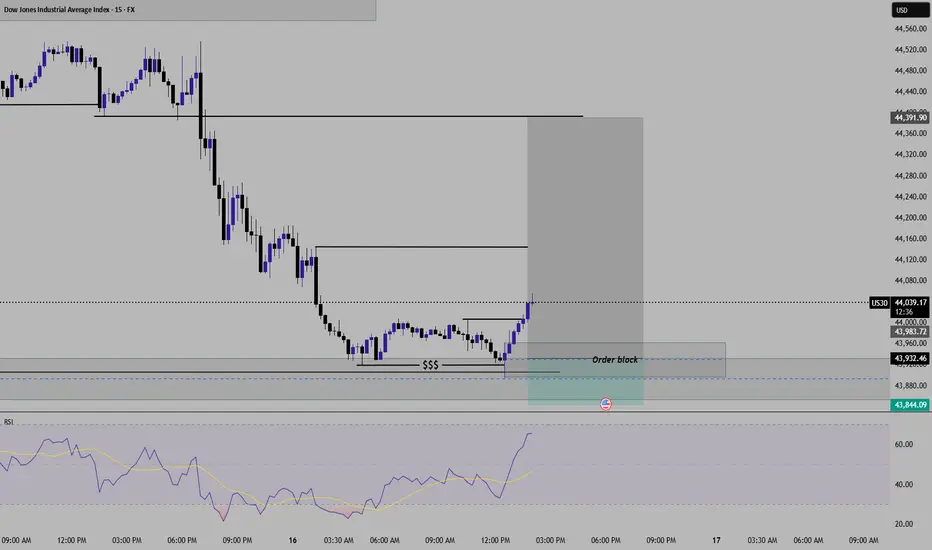
US30 Analysis for smaller time frameUS30 Buy setup With HTF Liquidity Grab Confirmation and lower time frame Entry module.
Buy @ 43925
Stop loss @43845
1st Target - @44140
2nd Target - 44390
(This publication is only for education purpose. consult your financial advisor before any investment)
High-Probability Scalping Techniques🔍 What Is Scalping?
Scalping is a fast-paced intraday trading style where traders aim to take multiple small profits throughout the trading day. Instead of holding trades for hours or days, scalpers may be in and out of trades within minutes or even seconds.
Scalping is all about:
Quick entries and exits
High accuracy
Controlled risk
Small but frequent gains
The core idea? “Many small wins add up to a big win.”
Scalping works best in liquid markets, like Nifty, Bank Nifty, large-cap stocks, or high-volume futures and options.
💡 Why Do Traders Choose Scalping?
Scalping is perfect for traders who:
Have limited capital but want to grow it steadily
Prefer not to hold positions overnight (no gap-up/gap-down risk)
Love short-term action and decision-making
Want to trade professionally in 1-2 hours daily
Also, scalping can reduce your exposure to market news, global events, or overnight uncertainty.
But remember: scalping isn’t easy. It’s a skill. You need discipline, speed, and a proven strategy.
🎯 Key Characteristics of High-Probability Scalping
To make scalping successful, your strategy must include:
Factor Requirement
Speed Fast entries and exits with minimal slippage
Liquidity Trade only stocks/indexes with high volume
Precision Narrow stop losses, clear targets
Discipline No emotions, stick to plan
Risk Management Small risk per trade, compounding over time
🧠 Scalper's Mindset: Think Like a Sniper, Not a Machine Gunner
You’re not shooting randomly. You’re waiting patiently for high-probability opportunities where the odds are clearly in your favor.
Scalping is not about trading more—it’s about trading better.
🔧 Tools Every Scalper Needs
Before we dive into strategies, here’s what you must have in place:
Fast internet connection
Live market depth / Level 2 data
5-min, 1-min, and tick charts
Hotkeys for fast order placement
Broker with low brokerage per trade
Scalping involves dozens of trades per session, so costs matter!
🛠️ High-Probability Scalping Techniques (Explained in Human Language)
Let’s now explore some proven techniques that many experienced scalpers use.
🔹 1. VWAP Bounce Strategy
VWAP = Volume Weighted Average Price. It tells you the average price where most volume happened during the day.
📌 Concept:
In a trending market, price often bounces off VWAP before continuing the trend.
You trade that bounce.
✅ Rules:
Identify trend (price above VWAP = uptrend, below = downtrend)
Wait for a pullback to VWAP
Look for confirmation (like a bullish candle in uptrend)
Enter trade with tight SL below VWAP
Target = 0.5% to 1% move
🔍 Chart Timeframe:
1-minute or 5-minute candles
Ideal for: Nifty/Bank Nifty, Reliance, HDFC, SBIN, INFY
🔹 2. Opening Range Breakout (ORB)
This is a classic scalping setup used in the first 15–30 minutes of market open.
📌 Concept:
First 15-min range defines the initial battle between buyers/sellers.
Breakout from this range = strong momentum.
✅ Rules:
Mark high and low of 15-min candle from 9:15 to 9:30
Buy when price breaks above the high + volume rises
Sell when price breaks below the low + volume rises
SL = below/above opposite side of the range
Target = 1:1 or trail profit
💡 Tip:
Works best on trending news days or earnings release days.
🔹 3. Scalping Breakouts with Volume Confirmation
A breakout is only real if volume supports it. Otherwise, it’s a trap.
✅ Rules:
Use 5-minute chart
Identify consolidation (flat price action with narrow range)
Watch for breakout with spike in volume
Enter with SL just outside the range
Exit with a 1:1 or 1.5:1 risk-reward
🎯 Indicators:
Bollinger Bands tightening
Volume histogram
Price breaking upper/lower band
🔹 4. RSI Divergence Scalping
You can scalp reversal points using RSI divergence.
✅ Rules:
Use 5-min or 3-min chart
RSI near 70 or 30 signals overbought or oversold
If price makes higher high but RSI makes lower high → Bearish divergence
If price makes lower low but RSI makes higher low → Bullish divergence
Enter for quick reversal scalp
SL = recent swing high/low
Target = VWAP or recent pivot
🔹 5. News-Based Scalping
Scalping on earnings releases, news events, or market-moving headlines can be profitable—but risky.
✅ Approach:
Stick to high-volume large-cap stocks
Avoid holding more than a few minutes
Use Level 2 order book to watch supply/demand shifts
Trade the initial burst, exit quickly
📈 Ideal Indicators for Scalping
VWAP
RSI (5 or 14-period)
Bollinger Bands
EMA crossover (e.g., 8 EMA vs 21 EMA)
MACD (fast settings for short-term signals)
But remember: indicators are tools, not guarantees. Always combine them with price action and volume.
📉 Risk Management: The Scalper’s Shield
This part matters even more than the strategy itself.
Rule Explanation
Risk only 0.5% to 1% of capital per trade Protects you from wipeout on a bad day
Always have a stop-loss No SL = no survival
Don’t average losing trades You’re scalping, not investing
Exit on SL or target—no emotion Don’t hope, don’t pray
Track your win-rate Aim for 60%+ with 1:1 risk-reward
🧮 Sample Scalping Day Plan
Time Action
9:15–9:30 AM Watch first 15-min candle for ORB
9:30–11:00 AM Take 2-3 high-quality trades (VWAP bounce, RSI scalp)
11:00–2:00 PM Avoid choppy markets or only scalp consolidations
2:00–3:00 PM Look for afternoon breakouts
3:00–3:20 PM Avoid taking fresh trades, exit open ones
🔁 Scalping Checklist
Before you place any trade, ask yourself:
✅ Is the setup clear and backed by volume?
✅ Am I trading with the trend or against it?
✅ Is my SL defined and within risk limit?
✅ Am I emotionally calm and focused?
✅ Is this a high-probability or random trade?
📊 Example of a High-Probability Scalping Trade
Stock: Reliance
Chart: 1-min
Setup: VWAP bounce + bullish engulfing candle
Entry: ₹2,950
Stop-Loss: ₹2,944
Target: ₹2,958
Result: Profit of ₹8 per share in 3 minutes
This may look small—but scalpers do 5–10 such trades a day, scaling with quantity.
🚨 Common Mistakes to Avoid
❌ Overtrading (more is not better)
❌ No plan or random entries
❌ Chasing trades late
❌ Holding scalps like swing trades
❌ Trading during news without preparation
❌ Ignoring transaction costs
🧾 Final Words: Is Scalping Right for You?
Scalping is not for everyone. It requires:
High focus and speed
Strong discipline
Quick decision-making
Excellent risk control
But if you develop the skill, it can provide:
Daily consistency
Limited overnight risk
Quick compounding
Full control over trades
✅ Start small.
✅ Practice on paper or low quantity.
✅ Use one strategy, track results, then scale up.
AI & Algo-Based Automated Trading🤖 What Is Algorithmic Trading?
Algorithmic Trading, or simply Algo Trading, is when computer programs automatically place buy/sell orders based on pre-defined rules, without human intervention.
Imagine giving your laptop a checklist like:
“If Nifty goes above 22,500 AND RSI is above 60 AND volume is high, then BUY.”
The computer will monitor the market 24x7—and the moment this condition is met, it will execute the trade automatically in milliseconds.
This kind of rule-based, automated trading using programs is Algo Trading.
🧠 What Is AI in Trading?
AI-based trading goes a step further.
Unlike basic algos that follow fixed rules, AI can learn, adapt, and improve with experience—just like humans.
Using technologies like:
Machine Learning (ML)
Natural Language Processing (NLP)
Neural Networks
Predictive Analytics
AI systems analyze massive amounts of data, including charts, volumes, news, tweets, macro events, and more—and predict future price movements or generate smart trading signals.
So while Algo Trading is like giving instructions to a robot, AI Trading is like training a robot to think like a trader
How Does Algo Trading Work?
Algo trading usually follows a 4-step cycle:
Strategy Design:
You create a trading rule, e.g. “Buy if 5 EMA crosses 20 EMA”.
Execution:
Set it up with your broker or software to trade automatically.
Monitoring:
Keep an eye to adjust for market conditions or technical issues.
Common Algo Strategies:
Moving average crossovers
Mean reversion
Arbitrage (buy low, sell high across markets)
Trend following
Momentum trading
Scalping (multiple small profits in quick trades)
🔮 How Does AI-Based Trading Work?
AI-based systems do all the above PLUS:
Analyze news sentiment (good or bad for a stock)
Understand social media buzz (like Twitter or Reddit)
Learn from historical chart patterns and price movements
Adjust strategies based on outcomes (self-improvement)
Example:
An AI bot could learn that when crude oil prices rise + VIX increases + USDINR weakens → certain oil & gas stocks tend to rally → it may buy those stocks automatically.
This is smart prediction, not just following a rule.
🌐 Who Uses AI & Algo Trading?
✅ Institutional Investors:
Mutual Funds
FIIs (Foreign Institutional Investors)
Insurance companies
Banks and proprietary trading desks
✅ Hedge Funds:
Quant funds like Renaissance Technologies, Two Sigma, Citadel use AI at scale
💰 Benefits of AI & Algo Trading
Speed – Trades happen in milliseconds. You can’t beat that manually.
Discipline – No emotional trading, no greed or fear.
Scalability – Run multiple strategies on multiple stocks at once.
Precision – Orders are accurate, slippages can be minimized.
⚠️ Risks & Challenges
It’s not all sunshine and profits. Here are some things to be cautious about:
Risk Description
Overfitting Your model may work in the past but fail in live market.
Black Swans Unforeseen events can destroy even smart systems.
Data Issues Bad data = bad trades. Accuracy matters.
Connectivity/Tech If system crashes mid-trade, results can be brutal.
Emotional Blindness AI can't feel panic—good for rules, bad for crisis.
🧠 Real World Use Cases
✅ Example 1: Intraday Scalping Bot
Scans top 100 NSE stocks
Enters trades on VWAP bounces with strict SL
Exits with 0.5-1% target
Runs 50 trades/day across stocks
✅ Example 2: AI News Sentiment Strategy
Uses NLP to scan headlines, tweets, earnings
Classifies news into “Positive”, “Negative”, or “Neutral”
Trades in the direction of sentiment before retail even reacts
✅ Example 3: Pair Trading Algo
Compares movement of two related stocks (e.g. HDFC Bank vs ICICI Bank)
If one deviates too far from the other, it creates a hedge
Buy one, sell the other—profit from convergence
🔁 The Future: AI + Algo + Quantum + Blockchain?
The future of markets is combining:
AI (Decision Making)
Algo (Execution)
Blockchain (Transparency)
Quantum Computing (Speed & Accuracy)
Large financial institutions are already hiring AI scientists and coders instead of traditional analysts. Markets are evolving—and so should we.
🧾 Conclusion
AI & Algo Trading is the future—and the present. It’s fast, smart, and scalable.
Big institutions are already using them to make crores from micro-movements. For retail traders, this is an opportunity to level up, automate emotions out, and trade systematically
Option Selling Strategies for Monthly Income📘 What is Option Selling?
In options trading, you have two parties:
Option Buyer – Pays premium to buy the right (but not obligation) to buy/sell a stock or index
Option Seller (Writer) – Receives that premium, but takes on the obligation to deliver, if the buyer exercises
📌 So, in option selling:
You earn premium upfront
Your profit comes if the option expires worthless
Time is your friend (theta decay helps you)
The odds of success are higher, but risk is theoretically unlimited (if not managed well)
🔧 Core Concepts You Must Know Before Selling Options
✅ 1. Time Decay (Theta)
Option prices fall as expiry nears (especially if OTM)
Sellers benefit because buyers lose value daily
✅ 2. Implied Volatility (IV)
Higher IV = Higher Premiums = Better for sellers
Sell when IV is high, buy when IV is low
✅ 3. Margin Requirement
You need sufficient funds (or collateral) to sell options
Brokers block margin depending on your strategy
✅ 4. Strike Price Selection
Selling options far away from current price reduces risk
Choose strikes based on support/resistance or option chain OI
📦 Top 4 Option Selling Strategies for Monthly Income
Let’s look at the most trusted, beginner-to-pro level strategies used for monthly income.
🔹 1. Covered Call – Best for Stock Investors
You own a stock and you sell a Call Option against it.
Generates income from stocks you already hold
You earn premium every month
If stock stays below strike → you keep stock + premium
If stock crosses strike → your stock may get sold (with profit)
Example:
You hold 1 lot of TCS (300 shares) at ₹3,600
Sell 3700CE for ₹40 premium
If TCS stays below ₹3700, you keep ₹12,000 premium (₹40 × 300)
✅ Low risk
✅ Good for long-term investors
🚫 Limited upside on stock
🔹 2. Cash-Secured Put (CSP) – Get Paid to Buy Stocks
You sell a Put Option for a stock you’re willing to buy at a lower price.
You collect premium
If stock falls below strike → You must buy it
You effectively get stock at discount
Example:
Sell 3600PE in TCS and collect ₹50 premium
If TCS closes above ₹3600, you keep the ₹15,000 premium
If TCS drops below ₹3600, you get to buy it—but at an effective price of ₹3550
✅ Ideal for long-term investors
✅ Safer than naked put selling
🚫 Requires full cash or margin
🔹 3. Short Strangle – Good for Range-Bound Market
You sell one Out-of-the-Money Call and one OTM Put.
Profit if the stock/index remains in a range
You earn premium from both sides
Risk if price moves too much either way
Example (Nifty at 24,000):
Sell 24200CE at ₹100 and 23800PE at ₹120
Total premium = ₹220 (₹11,000 per lot)
Max profit = ₹11,000 if Nifty stays between 23800 and 24200 till expiry
✅ High premium potential
🚫 Unlimited risk if market breaks range
✅ Can be hedged with far OTM buys
🔹 4. Iron Condor – Limited Risk, Limited Reward
This is an advanced version of strangle with protection.
Sell 1 OTM Call + 1 OTM Put
Buy 1 further OTM Call + 1 further OTM Put
You form a “box” where profit is limited, but losses are capped
Example (Nifty at 24000):
Sell 24200CE (₹100) + 23800PE (₹120)
Buy 24400CE (₹30) + 23600PE (₹40)
Total premium = ₹220 – ₹70 = ₹150
Max profit = ₹150 × 50 = ₹7,500
Max loss = ₹50 (difference in strikes – net credit)
✅ Great for peace of mind
✅ No unlimited risk
🚫 Less profit than naked strangle
📅 How to Use These Strategies for Monthly Income
🔄 Repeat Monthly:
Choose 1 or 2 strategies
Select stocks or index with high liquidity
Sell options 20–30 days before expiry
Exit before expiry (if needed) or let decay work
📌 Ideal Instruments:
Nifty / Bank Nifty
Liquid stocks: Reliance, HDFC Bank, Infosys, ICICI, TCS
🧠 Smart Practices:
Trade with capital you can afford to lock for a few weeks
Don’t sell options blindly – check news, IV, support/resistance
Use alerts or trailing stops
⚠️ Risks and How to Manage Them
Risk How to Handle
Unlimited Loss Use hedging (e.g., iron condor) or stop-losses
Sudden Market Moves Avoid during events (budget, elections, Fed)
Low Premium Don't sell too close to expiry with low reward
Margin Call Keep extra buffer; monitor exposure
Overtrading Stick to 1–2 good trades per expiry
✅ Final Thoughts
Option selling is not a get-rich-quick tool—but it’s a powerful way to generate stable income month after month, when done with patience, logic, and discipline.
You don’t need to be a genius—just:
Understand how premiums behave
Focus on low-risk, high-probability trades
Use hedges and stop-losses
Stick to tested rules
Track your performance and learn from mistakes
Liquidity Concepts & Smart Money Trading💧 What is Liquidity in the Stock Market?
In simple terms, liquidity means how easily you can buy or sell a stock (or any asset) without affecting its price too much.
📌 Imagine This:
You're at a crowded market and want to sell 10 bags of rice. If there are many buyers, you’ll sell quickly at your price. That’s high liquidity.
But if only 1 buyer is there, you’ll need to lower the price—or wait. That’s low liquidity.
✅ High Liquidity Stocks:
Easy to enter and exit
Tight bid-ask spread
High volume and interest
Examples: Reliance, HDFC Bank, TCS, Infosys
🚫 Low Liquidity Stocks:
Wide spread
May not execute large orders fast
Often in smallcap or SME segments
Prone to manipulation
So, as a trader or investor, liquidity matters because it affects:
Speed of your trades
Slippage (difference between expected and executed price)
Risk of getting trapped in illiquid counters
🧠 Who is “Smart Money”?
“Smart Money” refers to the big, institutional players who move the market silently.
🧱 Types of Smart Money:
FIIs (Foreign Institutional Investors)
DIIs (Domestic Institutional Investors)
Mutual Funds, Pension Funds
Hedge Funds
Prop Desks (Proprietary traders of large brokers or banks)
These players do not trade like retail traders. They have:
Huge capital
Access to better research
Advanced tools and algorithms
Patience to accumulate or distribute over days/weeks
The power to create or absorb liquidity
They don’t chase stocks. They build positions strategically.
🎯 The Relationship Between Liquidity & Smart Money
This is where it gets interesting.
Smart Money doesn’t want you to know what they’re doing. So they operate in stealth mode, using liquidity zones to enter/exit.
Let’s break this down in real terms.
💡 Real Example: How Smart Money Uses Liquidity
Scenario: Let’s say a mutual fund wants to buy ₹500 crore worth of a midcap stock.
If they suddenly place a large buy order, the price will shoot up.
So what do they do?
They wait for panic selling, like during news, results, or false breakdowns.
They create liquidity pools—zones where many stop-losses are triggered.
Retail traders sell in panic, creating supply.
Smart money absorbs quietly.
This is called accumulation.
Similarly, when they want to sell, they:
Push price up with breakout candles
Attract retail buyers chasing the move
Slowly distribute their holdings
Leave small players trapped at the top
🔄 Concepts You Must Know
1. Accumulation Zone
Where smart money buys silently
Flat or range-bound price action
Volume slowly rising
No major breakout yet
2. Distribution Zone
Where smart money sells quietly
Price looks strong, but momentum slows
Volumes stay high
Sudden rejections from resistance
3. Liquidity Grab / Stop Hunt
A deliberate move to trigger stop-losses and create liquidity
Often seen before real trend begins
Can be traps for retail traders
Example: Price breaks below support, then sharply reverses
📊 How to Track Liquidity & Smart Money Moves
Here are tools and techniques used by traders:
📌 1. Volume Profile
Shows where most trading has happened
High Volume Nodes (HVN): Liquidity zones
Low Volume Nodes (LVN): Price moves quickly
Watch for consolidation near HVNs—could be accumulation/distribution
📌 2. Order Book / Market Depth
For intraday traders
Shows how many buy/sell orders exist at various levels
Spikes in orders may signal liquidity traps or fake pressure
📌 3. Open Interest (OI) in Options
Rising OI + flat price = buildup
Long unwinding or short covering signals smart money behavior
📌 4. FII/DII Data
Track daily net buy/sell figures
Sectoral trends from mutual fund holdings
FII selling = market weakness, especially in large caps
📌 5. Wyckoff Method (Optional but powerful)
Focuses on market cycles
Accumulation → Markup → Distribution → Markdown
Helps understand the intent behind price action
🔥 Common Smart Money Setups
✅ 1. False Breakout Trap
Price breaks above resistance
Retail traders enter long
Smart money sells into strength
Price reverses
How to Spot:
Check volume
See if candle closes above or within resistance
Confirm with next bar’s reaction
✅ 2. Stop-Loss Hunting
Price dips below support
Retail SLs get hit
Price reverses sharply with strong volume
How to Spot:
Sudden wick below major swing low
Sharp V-shaped recovery
Volume spike + reversal candle
✅ 3. Liquidity Sweep Before Rally
Sideways phase ends with a big red candle
Then reversal and trend begins
This is smart money loading positions
🛠️ How to Use This in Trading (With Practical Tips)
✅ For Swing Traders:
Identify consolidation zones with rising volume
Wait for breakout or breakdown with volume
Add volume profile to spot high-activity zones
Check if OI is building around a strike in options
✅ For Intraday Traders:
Track OI buildup + price action around round numbers
Use Market Profile or VWAP to understand liquidity zones
Watch for traps near open or just before close
✅ For Investors:
Watch mutual fund buying sectors
Use MF/ETF monthly reports for accumulation patterns
Avoid chasing rallies—enter during base formation
✅ Final Thoughts
Most retail traders lose money not because their analysis is wrong—but because they don’t understand the rules smart money plays by.
In 2025’s market, where FIIs, algorithms, and institutions dominate, understanding liquidity and smart money behavior is not optional—it’s essential.
You don’t need millions to trade like smart money. You just need the right mindset, tools, and the patience to wait for clean setups.
📌 Remember: “Volume reveals the truth. Price tells the story. Liquidity is the language smart money speaks.
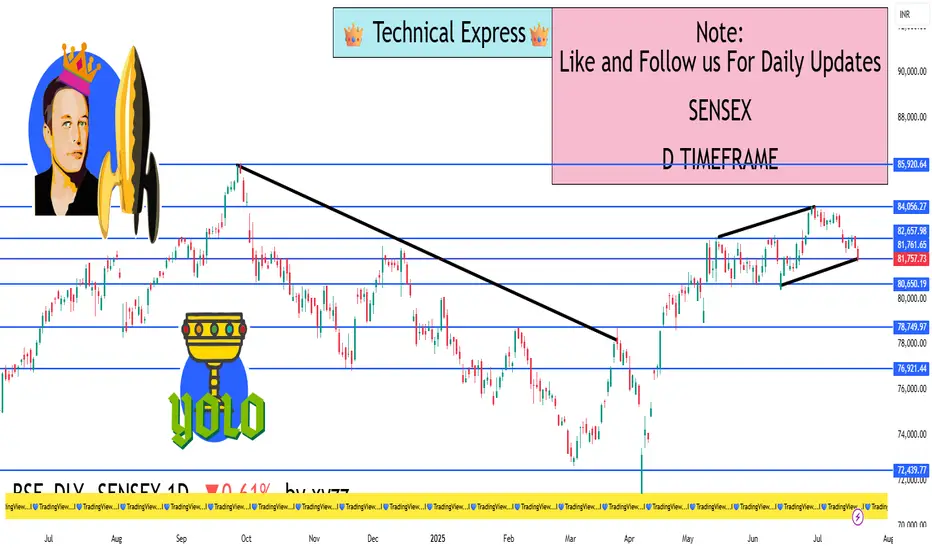
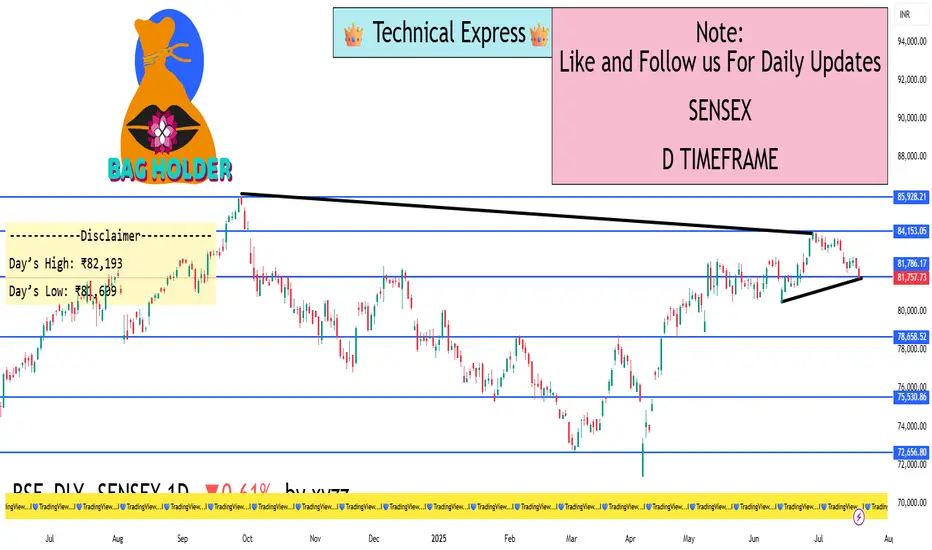
Sensex – 1D Timeframe📅 Sensex Daily Timeframe Analysis (1D) – As of 19 July 2025
📊 1. Market Summary
Closing Price: ₹81,758
Change from Previous Day: –502 points (–0.61%)
Day’s High: ₹82,193
Day’s Low: ₹81,609
52-Week High/Low: ₹85,978 / ₹71,425
➡️ Sensex dropped for the third day in a row and is showing signs of continued weakness.
🕯️ 2. Candlestick Behavior (1-Day Chart)
The candle formed is a bearish candle with a small body and an upper wick.
This means that the price went up intraday but couldn't hold and was sold off by the end of the day.
Sellers are actively pushing price down, especially near ₹82,000.
📉 3. Trend Direction
The market is in a clear downtrend.
This is seen by:
Lower highs (each peak is smaller than the last one)
Lower lows (each dip is deeper)
Sensex is unable to break back above key levels like ₹82,200 – showing strong selling pressure.
🧠 Trend Summary:
Price action is confirming bearish momentum. Buyers are weak, sellers are in control
📘 6. Volume & Market Strength
Volume is average to slightly rising on red (down) candles.
This shows active selling by institutions or large players.
No large green candle with volume = no strong buyer support yet.
💹 7. Simple Trading Strategy Based on 1D Timeframe
✅ If You’re a Swing Trader:
Bearish Bias: Sell on rise near ₹82,200 or ₹82,600
Target 1: ₹81,466
Target 2: ₹81,174
Stop Loss: Above ₹82,600 (or use trailing SL)
⚠️ If You’re Waiting for a Buy Opportunity:
Wait for price to touch ₹80,739 – ₹81,174 zone, then look for bullish reversal signals (big green candle, volume, RSI > 35)
🔚 Final Thoughts:
Sensex is under pressure.
No major recovery sign is seen yet.
A bounce is possible only near major support zones, but for now, bears are winning.
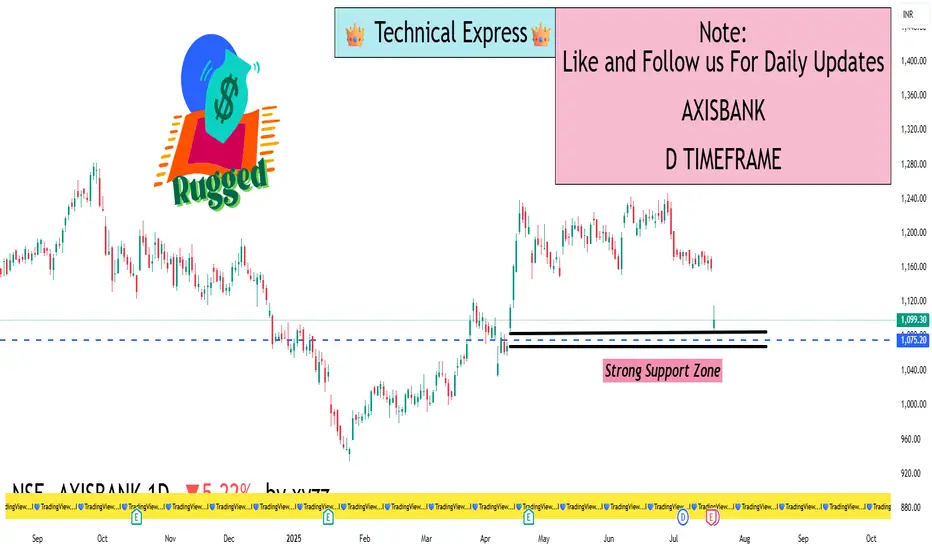
AXISBANK – 1D Timeframe📊 AXISBANK – DAILY CHART (1D TIMEFRAME)
📅 Date: July 18, 2025
Closing Price: ₹1,099
Change: –₹60.50 (–5.2%)
Intraday Range: ₹1,074 (Low) – ₹1,159 (High)
52‑Week Range: ₹867 – ₹1,186
YTD Return: Approx. +8%
Volume: Heavier than average, indicating strong selling pressure.
⚠️ MARKET CONTEXT & TREND
Bearish Trend: Axis Bank has broken below key support zones.
Oversold RSI: While it suggests possible short-term bounce, confirmation is needed.
Strong ADX: Indicates trend strength is increasing — in this case, on the downside.
High Volume Sell-off: Indicates institutional or heavy selling pressure.
No reversal indicators yet – MACD is still negative and falling.
🔍 SUMMARY VIEW
Trend: Strongly Bearish
Momentum: Weak, heavily oversold
Volatility: High
Reversal Signs: Not yet confirmed
Short-Term Outlook: Bearish to sideway unless price reclaims ₹1,120–1,150 zone
🔮 WHAT TO WATCH NEXT
Reversal Confirmation: Look for RSI climbing back above 30 and MACD crossover.
Volume Drop on Red Days: If selling volume dries up, it may signal weakening bears.
Breakout above ₹1,150: Could confirm fresh buying and trend reversal.
Further Drop Below ₹1,070: Could lead to panic selling and deeper correction
Option Trading✅ Why Trade Options?
📊 Profit in All Market Conditions — Whether markets go up, down, or stay flat, options allow you to build strategies for every scenario.
💰 Limited Risk, High Reward — With proper strategies like buying options, you can limit your risk to the premium paid but enjoy unlimited upside.
🔒 Hedge Existing Investments — Investors use options to protect their portfolios from market crashes.
🧩 Flexibility — Options allow for creative trade setups such as income generation, speculation, and hedging.
📉 Leverage — Control larger positions with less capital.
✅ Key Concepts in Option Trading
1. Call Option (Buy Side):
Gives the buyer the right to buy an asset at a certain price before expiry.
✅ Call Buyer profits when price goes up.
✅ Call Seller (Writer) profits when price stays flat or falls.
2. Put Option (Sell Side):
Gives the buyer the right to sell an asset at a certain price before expiry.
✅ Put Buyer profits when price goes down.
✅ Put Seller profits when price stays flat or rises.
✅ Important Terms to Know
Strike Price – The fixed price at which you can buy or sell the underlying asset.
Premium – The cost paid by the option buyer to the seller for the right to exercise.
Expiry Date – The date when the option contract becomes void.
In-the-Money (ITM) – Option has intrinsic value (profitable if exercised).
Out-of-the-Money (OTM) – Option has no intrinsic value (unprofitable if exercised).
At-the-Money (ATM) – Option strike is closest to the current market price.
✅ Popular Option Trading Strategies
1. Directional Strategies:
Long Call – Profit from rising markets.
Long Put – Profit from falling markets.
2. Non-Directional Strategies:
Iron Condor – Profit from range-bound markets.
Straddle/Strangle – Profit from big movements in either direction.
Butterfly Spread – Low-cost strategy for limited movement with high reward potential.
3. Income Strategies:
Covered Call – Selling calls on owned stocks for premium income.
Cash-Secured Put – Selling puts on stocks you want to own at a lower price.
✅ Advanced Concepts for Institutional-Level Trading
📌 Implied Volatility (IV): Measures expected future volatility; options become expensive when IV rises.
📌 Theta Decay: Time decay that eats away premium, favoring option sellers.
📌 Delta, Gamma, Vega, Theta (Greeks): Quantify how option prices react to changes in market conditions.
📌 Hedging with Options: Professionals hedge large portfolios using protective puts or collars.
📌 Liquidity and Open Interest: High open interest means better liquidity, tighter spreads, and easier trade execution.
✅ Why Institutions Prefer Option Trading
Institutions, banks, and hedge funds use options to:
Hedge large stock portfolios.
Generate steady returns through premium collection.
Manage volatility exposures.
Create complex structured products.
They use strategic adjustments, rollovers, and risk-defined positions to control large portfolios with precision.
✅ Common Mistakes to Avoid in Options
❌ Trading without understanding volatility impact.
❌ Ignoring time decay when buying options.
❌ Going all-in on OTM options with low probabilities.
❌ Not managing trades near expiry.
❌ Trading without considering the Greeks.
✅ Final Thoughts
Option Trading is not gambling — it’s a professional tool for risk management, income generation, and speculation. When used correctly, options offer high flexibility, controlled risk, and diverse profit opportunities. However, success requires education, discipline, and strategy.
Learn the true power of Option Trading, master market behavior, and you will have one of the most versatile weapons in your financial toolkit

Divergence Secrets✅ What is Divergence?
Divergence occurs when price action and an indicator (usually a momentum oscillator) move in opposite directions. This signals a disconnection between price and momentum, often happening before significant reversals.
Most Common Indicators Used:
RSI (Relative Strength Index)
MACD (Moving Average Convergence Divergence)
Stochastic Oscillator
CCI (Commodity Channel Index)
✅ Types of Divergence
1. Regular Divergence (Classic Divergence)
Bullish Divergence: Price makes lower lows, but the indicator makes higher lows → Suggests potential upward reversal.
Bearish Divergence: Price makes higher highs, but the indicator makes lower highs → Suggests potential downward reversal.
📌 Use Case: Best applied during downtrends (bullish divergence) or uptrends (bearish divergence) to catch reversals.
2. Hidden Divergence (The Professional’s Favorite)
Bullish Hidden Divergence: Price makes higher lows, but indicator makes lower lows → Signals trend continuation upwards.
Bearish Hidden Divergence: Price makes lower highs, but indicator makes higher highs → Signals trend continuation downwards.
📌 Use Case: Hidden divergence is used to confirm trend continuation after pullbacks, ideal for trend traders.
3. Exaggerated (Extended) Divergence
Price forms equal highs/lows, but the indicator shows higher lows/lower highs → Signals momentum build-up for reversal.
📌 Use Case: Seen at range breakouts or market tops/bottoms.
✅ Why Divergence Works (Institutional View)
Liquidity Manipulation: Institutions push price to make new highs/lows to grab liquidity, but momentum slows because real volume decreases.
Momentum Imbalance: Even as price extends, internal market strength weakens, revealed through divergence.
Smart Money Accumulation/Distribution: Divergence often appears when institutions quietly build or offload positions, creating momentum shifts.
✅ Advanced Divergence Trading Secrets
🔥 Secret #1: Multi-Timeframe Divergence
Always check divergence on higher timeframes (H4, Daily), then execute entries on lower timeframes (M15, H1).
A daily divergence holds more power than M15 divergence.
🔥 Secret #2: Confluence with Support/Resistance or Order Blocks
Divergence is strongest when it happens at a key structure level (support, resistance, order block, or imbalance zone).
Don’t trade divergence alone — combine it with price reaction at major zones.
🔥 Secret #3: Wait for Structure Break Confirmation
After divergence, wait for Break of Structure (BOS) or Change of Character (CHoCH) to confirm reversal.
This filters out many false divergence signals.
🔥 Secret #4: Volume Confirmation
Confirm divergence with volume drop or volume spike reversal.
Divergence with low participation increases reversal probability.
✅ Pro Divergence Entry Method
✅ Spot Divergence at key levels.
✅ Wait for candlestick confirmation (engulfing candle, pin bar, inside bar).
✅ Look for Break of Minor Structure.
✅ Enter on retest of BOS/CHoCH zone or order block.
✅ Stop loss below swing low/high, target next liquidity pool or imbalance zone.
✅ Common Mistakes to Avoid
❌ Trading divergence without context (e.g., countering a strong trend blindly).
❌ Ignoring higher timeframe trend direction.
❌ Entering without confirmation candle or structure break.
❌ Using lagging indicators without understanding price action.
✅ Final Thoughts
Divergence is a leading indicator, but it must be combined with market structure, key levels, and confirmation price action. Professionals use divergence as a warning sign, not an instant entry trigger. By mastering divergence, you can predict market exhaustion, capture high-reward reversals, and avoid common retail traps.
Divergence is one of the hidden secrets of market timing — master it, and your trading accuracy will improve dramatically

Learn Institutional TradingWhy Learn Institutional Trading?
The financial markets are not random; they are highly structured environments controlled by large financial players who leave visible footprints on the chart. Most retail traders don’t see these footprints and end up on the wrong side of the market. By learning institutional trading, you will finally understand:
Why the market moves the way it does.
How to spot liquidity traps and avoid stop-loss hunting.
Where smart money enters and exits trades.
How to trade with confidence instead of fear and guesswork.
This course focuses on the real mechanics of price movement, not on unreliable indicators or random trade signals.
What You Will Learn in Institutional Trading
✅ Smart Money Concepts (SMC):
Learn how institutional traders accumulate and distribute orders, using liquidity to their advantage. Understand the true story behind price action.
✅ Liquidity and Order Blocks:
Master the art of identifying liquidity pools, order blocks, and market manipulation zones. Understand where smart money enters the market and how you can follow their lead.
✅ Market Structure Mastery:
Learn to read market structures with precision, identify internal and external structures, and capitalize on market shifts with high-probability trade setups.
✅ Entry and Exit Strategies:
Get access to professional-grade entry methods, including refined confirmation entries, break-of-structure (BOS) trades, and optimal risk-reward setups.
✅ Risk Management Techniques:
Understand how institutions manage risks and protect their capital. Implement strong risk management rules to protect your trading account from unnecessary losses.
✅ Live Market Sessions and Mentorship:
Participate in live market discussions, chart breakdowns, and Q&A sessions with expert traders who trade institutional concepts every day.
Who Can Learn Institutional Trading?
This course is suitable for:
📌 Beginners who want to start with professional strategies from day one.
📌 Intermediate traders who are tired of inconsistent results.
📌 Advanced traders who want to refine their understanding of market manipulation.
📌 Investors who wish to add active trading as an income source.
📌 Aspiring professionals who aim to make trading a serious career path.
Benefits of Learning Institutional Trading
✅ Trade with clarity and confidence, knowing you are on the side of smart money.
✅ Stop chasing trades and start trading with high-probability setups.
✅ Learn to avoid retail traps and false breakouts.
✅ Build a sustainable trading career with proper risk management and psychological discipline.
✅ Apply your skills to any market: stocks, forex, crypto, indices, or commodities.
✅ Experience real growth as a professional trader, thinking several steps ahead of the market.
Learn Institutional Trading is more than just a course — it’s a complete professional transformation. It equips you with the skills, mindset, and strategies to succeed in modern financial markets. Stop trading blindly and start trading with purpose, accuracy, and confidence.

Master Institutional TradingWhy Master Institutional Trading?
The stock market, forex, and other financial markets are highly manipulated environments, driven by the decisions of institutional traders, banks, hedge funds, and large players. Learning how these institutions trade gives you the clarity and confidence to trade in the direction of smart money rather than becoming a victim of market traps.
With this program, you will not only learn how the markets operate but also how to read price movements like an institutional trader. You’ll master advanced techniques that allow you to identify high-probability trade setups, manage your risks like a professional, and trade with patience and precision.
Key Features of Master Institutional Trading
Smart Money Concept (SMC): Understand the core principles of smart money trading, including how large institutions accumulate and distribute assets.
Liquidity Hunting Strategies: Learn how institutions use liquidity zones, stop loss hunting, and false breakouts to trap retail traders — and how you can profit by following their footprint.
Order Block Mastery: Master the identification of order blocks, breaker blocks, and mitigation blocks — key areas where institutional orders are placed.
Market Structure & Price Action: Analyze clean price action without relying on lagging indicators. Understand market structure shifts, internal and external liquidity, and premium/discount zones.
Advanced Risk Management: Learn professional risk management techniques to control drawdowns and maximize returns, including how institutions scale in and out of positions.
Live Market Analysis: Get exposure to live trading sessions where experts explain the logic behind every trade entry and exit, based on institutional concepts.
Psychological Discipline: Develop a winning mindset focused on discipline, patience, and long-term profitability, just like professional traders working in financial firms.
Who Is This Course For?
This program is ideal for:
Traders who want to stop following retail strategies and learn real market mechanics.
Beginners who want to build a solid institutional foundation from the start.
Intermediate traders who are struggling with inconsistent results and want to level up their skills.
Experienced traders who wish to refine their market reading abilities and trade with greater precision.
Full-time or part-time traders seeking to understand price manipulation and liquidity traps.
What You’ll Gain from This Master Class
✅ The ability to track institutional footprints and predict market movements more accurately.
✅ A complete system based on price action, market structure, and liquidity analysis.
✅ Tools and strategies to avoid false signals and stop-loss hunts.
✅ Improved risk-reward ratios by trading in the direction of smart money.
✅ A professional, emotion-free approach to trading that focuses on long-term profitability.
✅ Real-world practical skills that you can apply in any market — stocks, forex, crypto, or commodities.
This is not a basic or theoretical course. The Master Institutional Trading program delivers real, professional-level trading knowledge, breaking down the hidden market mechanics that drive price action. By the end of this program, you will no longer trade like the crowd — you will trade like the institutions that move the markets

Trading Master Class With ExpertsWhy Choose the Trading Master Class With Experts?
In the world of trading, there’s a fine line between success and failure. The financial markets are full of opportunities but also come with significant risks. The key difference between winning traders and losing traders is education, discipline, and strategy. This masterclass is not just about learning how to trade; it’s about developing a professional trading mindset, learning proven techniques, and practicing high-probability setups under the guidance of industry experts.
This is a result-oriented program designed to give you a complete transformation from a confused trader to a disciplined market participant.
Key Highlights of the Master Class
In-Depth Market Knowledge: Learn the complete fundamentals of financial markets, including market structure, how different asset classes work, and what drives market movements.
Technical Analysis Mastery: From candlestick patterns to advanced indicators, understand how to read charts like a pro. Learn key technical tools like moving averages, RSI, MACD, Fibonacci retracements, and more.
Professional Trading Strategies: Master multiple trading styles including day trading, swing trading, scalping, and positional trading. Get access to expert-verified strategies used by institutional traders.
Options and Derivatives Trading: Understand the power of options trading, futures contracts, hedging techniques, and options strategies like iron condor, spreads, straddles, and strangles.
Institutional Trading Insights: Discover how big players operate in the market. Learn about smart money concepts, liquidity traps, stop loss hunting, and how to trade in alignment with market movers.
Risk Management and Trading Psychology: Learn how to protect your capital using strict risk management rules. Understand the psychological side of trading and how to build emotional discipline for consistent success.
Live Trading Sessions: Participate in live market analysis and live trading sessions with experts who explain their trades in real-time, helping you understand their decision-making process.
Community and Mentorship: Join a supportive community of traders where you can share ideas, discuss setups, and receive continuous guidance from mentors.
Who Should Attend This Master Class?
This masterclass is suitable for:
Aspiring traders who are looking for a solid foundation to start their trading journey.
Intermediate traders who are struggling with consistency and need structured guidance.
Investors who want to learn active trading techniques to multiply their returns.
Working professionals who want to trade part-time with smart strategies.
Full-time traders who want to sharpen their skills and expand their market knowledge.
What You Will Achieve After This Master Class
✅ You will be able to independently analyze charts and identify profitable trading opportunities.
✅ You will develop professional risk management habits that protect you from heavy losses.
✅ You will gain the confidence to trade any market condition — bullish, bearish, or sideways.
✅ You will have clear strategies to trade with discipline, eliminating guesswork and emotional mistakes.
✅ You will build a trader’s mindset focused on growth, patience, and long-term profitability.
This is not just another trading course. It is a complete transformation program that helps you think, act, and succeed like a professional trader. Step into the world of high-probability trading and change your financial future with the Trading Master Class With Experts.

Master Candle Sticks✅ Why Candlesticks Are So Powerful
Candlesticks visually represent real-time market sentiment. Every single candlestick shows you:
Who is in control (buyers or sellers).
The strength of momentum.
Potential exhaustion or continuation.
The battle between retail traders and smart money.
Unlike indicators, which lag, candlesticks are real-time market footprints, helping traders make quick, informed decisions based on pure price action.
✅ Structure of a Candlestick
Every candlestick consists of:
Body: The range between open and close prices — shows strength or weakness.
Wick/Shadow: High and low of the session — shows rejection, liquidity grabs, or manipulation.
Color: Bullish (green/white) vs. Bearish (red/black).
The size of the body and wicks tells a story about market strength or indecision.
✅ Essential Candlestick Patterns
🔵 Reversal Patterns:
Pin Bar (Hammer/Inverted Hammer): Long wick shows rejection of price and potential reversal.
Engulfing Candles: Bullish or bearish candles fully engulf previous candle → momentum shift.
Morning Star / Evening Star: Three-candle reversal at key levels → trend change confirmation.
Doji: Indecision candle, often seen before reversals or breakouts.
🔵 Continuation Patterns:
Inside Bar: Consolidation, often leading to breakouts in the direction of trend.
Bullish/Bearish Flag: Continuation after a sharp move.
Three White Soldiers / Three Black Crows: Strong multi-candle trend confirmation.
✅ Advanced Institutional Candlestick Secrets
🔥 Secret 1: Candlesticks at Key Market Levels
Candlestick signals are most reliable at:
Order Blocks
Support & Resistance Zones
Liquidity Pools
Imbalance/Fair Value Gaps
Always combine candlestick signals with higher timeframe zones for high-probability setups.
🔥 Secret 2: Wick Rejections & Stop Loss Hunts
Institutions often push price to grab liquidity beyond a support/resistance level, shown by long wicks. Wick rejections = liquidity grab = high reversal probability.
🔥 Secret 3: Multi-Timeframe Candlestick Reading
A single higher timeframe candle (Daily, 4H) is built from multiple smaller timeframe candles. Professionals:
Use HTF direction and LTF entry.
For example, Daily bullish engulfing + M15 break of structure = precise sniper entry.
✅ How to Master Candlestick Trading
✅ Focus on clean price action, avoid overcrowding charts with indicators.
✅ Study reaction at key levels, not random patterns.
✅ Always confirm with market structure (trend direction, higher highs/lows, BOS/CHoCH).
✅ Use candlestick confluence, combining patterns with liquidity zones, order blocks, or supply/demand.
✅ Avoid low-quality signals in choppy or low-volume markets.
✅ How Institutions Use Candlesticks
Institutions manipulate candles during low liquidity periods (fakeouts).
They use time-based traps, creating bullish/bearish patterns before reversing direction.
Volume + Candlestick Analysis shows true institutional intent — e.g., high volume bullish pin bars after liquidity grab = strong upside signal.
✅ Pro Tips for Candlestick Mastery
💡 Best signals occur after liquidity grabs — false breakout + rejection wick.
💡 Always combine candlesticks with market structure shifts — don’t take isolated signals.
💡 Trade in the direction of higher timeframe momentum, even if lower timeframe gives opposite signals.
💡 In sideways markets, avoid reversal signals, favor range trades.
✅ Final Thoughts
Candlesticks are the true language of the market. By mastering candlestick trading, you’ll gain the ability to predict market moves before they happen, trade with confidence, and avoid the common mistakes of indicator-dependent retail traders.
Master Candlestick Trading is your first step to becoming a consistently profitable trader, whether in forex, stocks, crypto, or commodities

EURUSD on the verge – a trap waiting for the carelessThis pair has just completed a classic rounding top, with a sharp rejection near 1.16500. Buying momentum is fading, RSI is dropping, and the recent retest of the broken trendline might have been the final warning – the “kiss of death” could already be in play.
On the fundamental side, the U.S. keeps fueling the dollar: consumer spending is rising, jobless claims are falling, and the Fed shows no sign of easing up. Meanwhile, the ECB is still searching for direction, leaving the euro exposed and vulnerable.
If the current support level breaks, EURUSD could slide quickly to lower zones. This is no longer a time for hope – it’s time to choose a side and act.

XAUUSD: breakout risk is approachingXAUUSD has been consolidating in a tight range since early July. Despite multiple bounces from support, price has failed to deliver a clear breakout, signaling weakening buying pressure. The current structure leans bearish, with momentum turning increasingly negative.
On the news front, the U.S. economy continues to show strong recovery: rising consumer demand, falling unemployment, and surging USD and bond yields. This puts significant pressure on gold – a non-yielding asset in a high-interest environment.
If price breaks below the bottom of the range, the downside could accelerate sharply in the near term. Buyers should remain extremely cautious in this setup.
