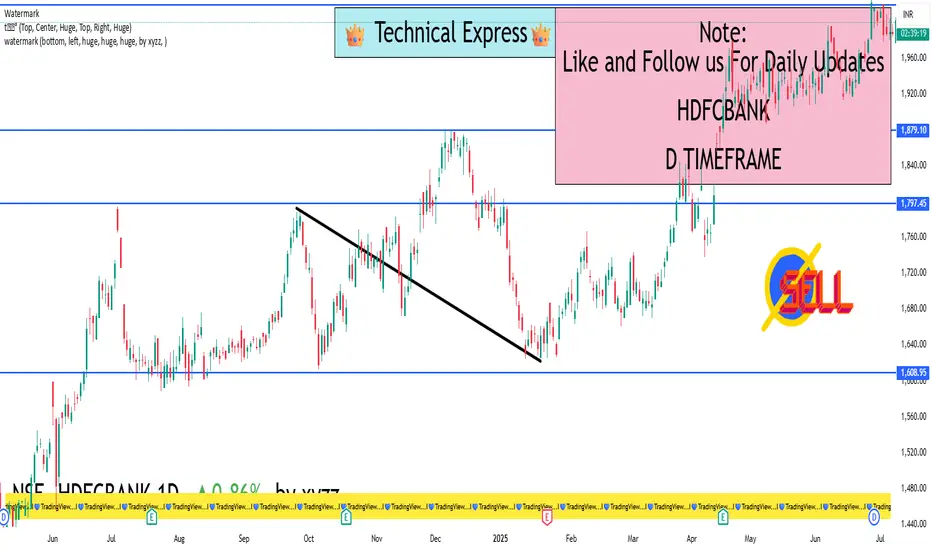
HDFCBANK 1D Timeframe📊 Current Snapshot
Price: Around ₹1,995 (~₹1,990–₹2,000 range)
52-week range: ₹1,588 – ₹2,027 — just below the recent high
✅ Technical Momentum
Overview: Daily technical summary is a "Strong Buy", with moving averages and indicators like RSI (55.3), Stoch, ADX, and CCI all in buy territory
Pivot Level Support: Standard pivots are around ₹1,995
RS Rating (ADR): Strong (83) — above the 80 mark, but extended — suggesting good trend; watch pullbacks
🛡️ Key Price Zones
Support / Buy-on-Dip Areas
₹1,995–₹1,998 – Daily pivot zone
₹1,982–₹1,990 – Standard S1 support
₹1,960–₹1,970 – Deeper Fibonacci/S2 pivot zone
₹1,932–₹1,940 – Strong long-term support (S3–S4 levels)
Resistance / Profit Exit Zones
₹2,007–₹2,015 – Immediate upside pivot resistance (R1–R2)
₹2,024–₹2,025 – R2 zone
₹2,030+ – R3/R4 zone — breakout territory
🧭 Action Plan
1. Currently Holding?
Stay invested — indicators are still bullish.
Think about taking partial profits in the ₹2,015–₹2,025 range, especially if the market overall gets choppy.
2. Planning to Buy?
Best entry: around ₹1,982–₹1,990 (safe zone).
If broader markets dip more, ideal accumulation range is ₹1,960–₹1,970.
Aggressive buying can start near ₹1,995 but keep stop-loss close.
3. Breakout Strategy
A clean, daily close above ₹2,025–₹2,030 on good volume opens up fresh upside toward all-time highs (~₹2,027+).
Can add more after breakout with confidence.
4. Risk Management
Entry around ₹1,982–₹1,990 → set stop-loss below ₹1,960.
If buying near ₹1,960–₹1,970 → stop-loss could be ₹1,930.
M-forex
SENSEX 1D Timeframe📊 Current Snapshot (As of July 15, 2025)
Recent Close: ~₹82,250
Downside Trend: Sensex has fallen ~1,459 points over the past four trading days, dragging along Nifty—mainly driven by global trade fears, foreign fund outflows, and weakness in IT stocks
Chart Context: The index is approaching its key support area, making now a crucial moment for decision-making
🛡️ Key Support Levels (Buy-on-Dips Zones)
₹82,000 – ₹82,100
A recent intraday low and a likely pivot for the index.
Buying dips here can be a conservative entry for risk-averse investors.
₹81,200 – ₹81,400
Deeper support zone: acts as a cushion in case of broader market drops.
₹80,000 – ₹80,500
Major psychological and technical floor.
Ideal for strong, long-term buying if global headwinds intensify.
🚧 Resistance Levels (Where Pressure May Build)
₹82,450 – ₹82,500
Immediate resistance zone.
A daily close above here could indicate a relief rally.
₹83,000 – ₹83,100
A significant hurdle.
Clearing this, with volume, could trigger a larger bounce.
₹83,400 – ₹83,500
Heavy resistance.
Crossing this opens potential moves toward previous highs (~₹84,000+).
✅ What You, the Investor, Should Do
1. Already Holding?
Stay invested. Trend remains broadly positive unless Sensex closes below ₹81,200.
Consider partial profit-taking near ₹83,000–₹83,100 if you're risk-conscious.
2. Thinking of Buying?
Best zone: ₹82,000–₹82,100 — go slow and buy in tranches.
If deeper pullback: accumulate more near ₹81,200–₹81,400.
3. Playing a Bounce?
If Sensex closes firmly above ₹82,500, that’s a sign of relief.
You could add exposure aiming for ₹83,000+, with a stop-loss below ₹82,000.
4. Protecting Your Position
Stop-loss: consider exiting if Sensex closes below ₹81,200, which would suggest deeper weakness.
🧭 Your Daily ABCs for Sensex
A (Add): Buy near ₹82k and ₹81.2k – ₹81.4k
B (Breakout): Watch for close above ₹82.5k → opens path to ₹83k
C (Cut-loss): Exit below ₹81.2k to avoid deeper downside

XAUUSD – Gold Sideways, Awaiting Key Economic DataXAUUSD – Gold Sideways, Awaiting Key Economic Data: Will We See a Correction or Continued Uptrend?
🌍 Macro Overview – Waiting for Key CPI Data from the US
Currently, Gold is moving sideways in a wide price range (from the 3x price levels to 4x), awaiting important economic data this week from USD, GBP, AUD, and EUR.
📊 Key Economic Data Today:
The US CPI report will be released during the US session, one of the most crucial reports of the month.
CPI forecast is positive at 0.3%, which is considered a good sign for the US economy.
This data is expected to align with the recent Nonfarm results and could lead to a strong price movement at the time of the announcement, potentially helping to sweep liquidity.
🔍 Technical Analysis – Uptrend with Key Resistance
The current trend is still upward, but the movement on larger timeframes is not as strong.
Key resistance lies between 337x and 339x, where SELL orders are currently dominant.
If price breaks through these levels, Gold may find support to move towards 3400.
📈 Short-Term Forecast:
A pullback to around 333x is expected, providing a good BUY opportunity.
Looking further, 331x could be a possible target as the price range remains wide.
🎯 Trading Strategy for Today
🟢 BUY ZONE: 3331 – 3329
SL: 3325
TP: 3335 → 3340 → 3345 → 3350 → 3360 → 3370 → ????
🔴 SELL ZONE: 3392 – 3394
SL: 3398
TP: 3388 → 3384 → 3380 → 3376 → 3370
⚠️ Important Notes:
Watch for support and resistance levels to set up suitable Scalping trades according to the trend.
Follow the TP and SL to protect your account, and avoid FOMO when there's no confirmation.
The 3350 – 3347 range is a key zone for entering BUY trades early.
💬 What do you think about Gold’s movement today? Do you believe it will break above the resistance, or will we see further correction? Drop your thoughts in the comments below and join the discussion with fellow traders!
👉 If you’re looking for more daily updates and live discussions, don’t forget to follow and be part of our community! Let’s make the most of these market opportunities together.

Gold Price Today: Uptrend or Correction?The price of gol today is showing mixed trends, with key factors affecting the market. Expectations around Federal Reserve monetary policy and important economic data, such as CPI and unemployment rate, are directly influencing the precious metals market. Additionally, global political tensions and the strengt continue to play a significant role in gold's direction.
Gold remains a safe-haven asset amid economic uncertainty, but fluctuating interest rates and market volatility could lead to unpredictable movements.
Current Trend: Gold may experience a slight correction if economic data turns positive and the USD strengthens, but it still remains an attractive long-term asset due to global uncertainty and inflation.

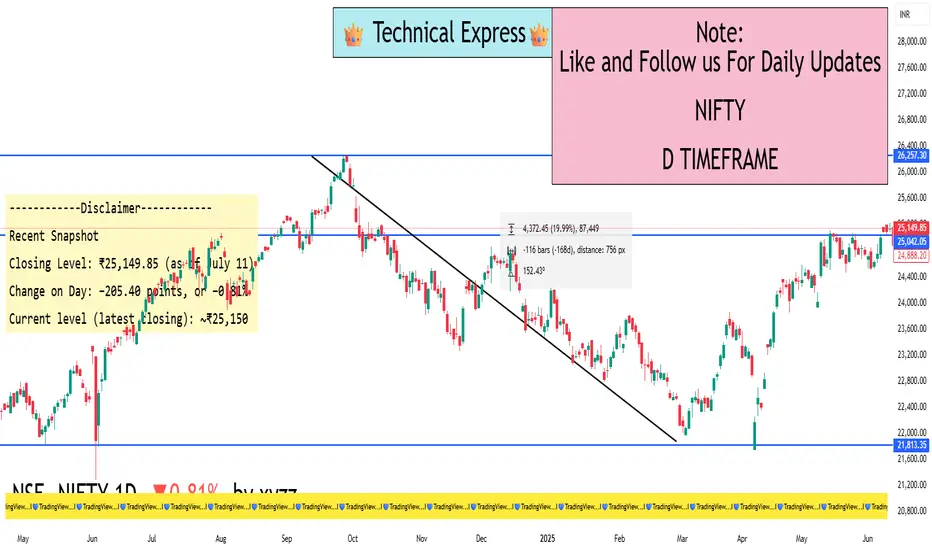
Nifty is consolidating just under ~25,500–25,600
Current Market Picture
Nifty is consolidating just under ~25,500–25,600, having pulled back a bit after last week's dip due to global market jitters and some profit booking
🛡️ Key Support Zones (Ideal Buy-on-Dip Areas)
₹25,000 – ₹25,050
This is the most critical support. A daily close below this could signal deeper weakness.
₹24,900 – ₹24,950
A secondary support zone based on pivot points—if Nifty falls here, it's potentially a good buying window.
₹24,600 – ₹24,700
A deeper backing level used if global or domestic markets take a leg lower.
🚧 Crucial Resistance Levels (Upside Barriers)
₹25,500 – ₹25,600
Near-term ceiling. A breakout and close above ₹25,600 could usher in momentum toward ₹26,000.
₹26,000
Psychological and technical landmark. A decisive move above this signals a strong bullish tilt.
📌 What You Can Do
Already Holding: Stay invested. The trend is constructive unless ₹25,000 is decisively broken.
Looking to Buy:
Watch for mild dips toward ₹25,000–₹25,050—a safe area to add quality index or ETF positions.
Or buy shares now if you believe the upward trend and institutional flows are intact.
Upside Play: A clean daily close above ₹25,600 opens the path to ₹26,000, then all-time highs.

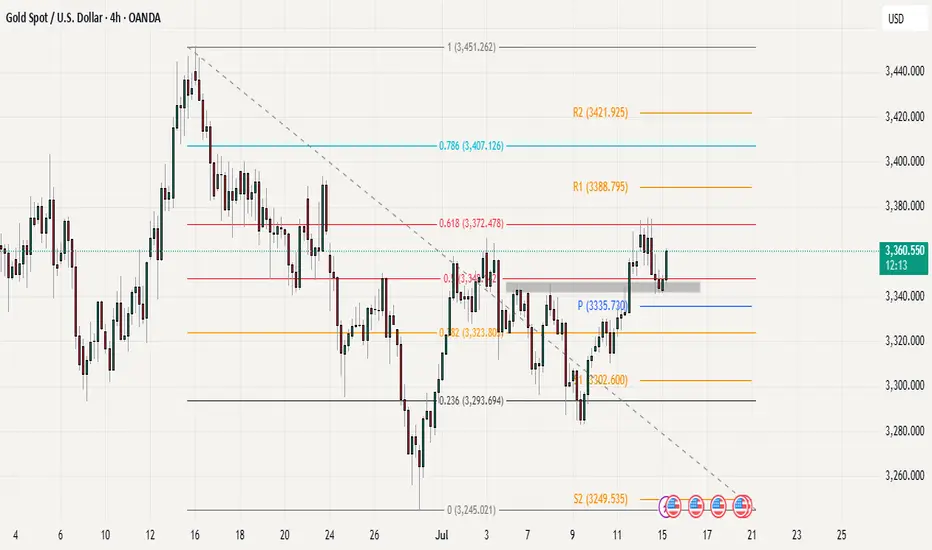
Gold at Critical Support After Fib Rejection CPI Day SetupGold has shown a rejection from the 60% Fibonacci resistance zone as we anticipated, and the price is now testing crucial support levels. The market is currently finding some stability around key areas that we need to monitor closely.
Our primary support zone remains at 3340-3345, which is particularly significant as this was the previous breakout area. This level has proven to be strong in the past and could provide the foundation for any potential bounce. Just below this, we have the 3335 pivot acting as additional support, creating a solid floor for the current price action.
What makes the current setup interesting is that price is attempting to reclaim the 3350 level. If we can see a successful breakout above Monday's high, this could trigger a strong bullish move as it would indicate that buyers are regaining control and pushing through previous resistance levels.
Today's CPI data release will be the main driver for gold's direction.
The trading scenario looks fairly straightforward a break above Monday's high with good volume would signal bullish momentum and could target higher resistance levels. we already seen a strong bounce from the 3340-3345 support zone in opening today,. However, if the 3335 pivot fails to hold, we might see further downside pressure.
BTCUSDT: Strong Uptrend, Targeting New HighsBTCUSDT is in a very strong uptrend, consistently setting new highs driven by overwhelming buying pressure and green Fair Value Gaps (FVGs).
Currently at $125,144, Bitcoin could reach $134,128 around July 21, 2025. This rally is fueled by ETF approvals, the Halving effect, a favorable macroeconomic environment (safe-haven, inflation hedge), and the expanding crypto ecosystem.
The preferred strategy is to buy on dips or breakout of resistance, always managing risk tightly.

Master Institutional TradingInstitutional trading refers to the buying and selling of financial assets—stocks, bonds, derivatives, commodities, currencies—by organizations that invest large sums of money. These trades are typically large in volume and value and are executed through private negotiations or electronic networks designed for block trading.
Key Characteristics:
High volume orders
Priority on stealth execution
Access to premium data
Quantitative modeling
Advanced algorithms

Advance Option Trading Why Institutions Prefer Options
Leverage – Control large positions with small capital
Risk Management – Protect portfolios
Cash Flow – Earn premium income
Volatility Play – Earn from IV rise/fall
Customization – Tailored exposure using exotic options
Core Strategies Used by Institutions
1. Protective Puts
Buy puts to insure large stock holdings against downside risk.
2. Covered Calls
Earn premium income on long-term stock holdings.
3. Calendar Spreads
Take advantage of time decay and volatility differences.
4. Straddles & Strangles
Bet on volatility movement, not direction.
Tools Used by Institutional Option Traders
Bloomberg Terminal – Real-time data, pricing models
Quantitative Models – Black-Scholes, Binomial Trees
Algo Execution – Smart order routing
Risk Management Software – VaR, Greeks analysis
Option Analytics Platforms – Orats, Trade Alert

Option Trading Part-1 What Is Institutional Option Trading?
Institutional Option Trading involves using derivatives (Options) for:
Hedging big equity portfolios
Speculating on volatility or price movement
Arbitrage opportunities
🔹 Key Techniques:
Volatility Arbitrage
Delta-Neutral Hedging
Covered Calls
Protective Puts
Iron Condors & Spreads
How Institutions Use Options Differently
✅ Retail Focus:
Naked calls/puts
Directional trades
Limited capital
✅ Institutional Focus:
Portfolio insurance
Complex multi-leg strategies
Implied Volatility arbitrage
Event-based hedging (like earnings or Fed news)

Institution Option Trading What Is Trading?
Trading refers to buying and selling financial instruments (stocks, options, futures) in financial markets for profit. It can be:
Retail Trading – Done by individual investors.
Institutional Trading – Conducted by large organizations like banks, mutual funds, hedge funds.
What Is Investing?
Investing involves allocating capital with the expectation of long-term wealth generation. It focuses on:
Value appreciation
Dividends or returns over time
Longer holding periods

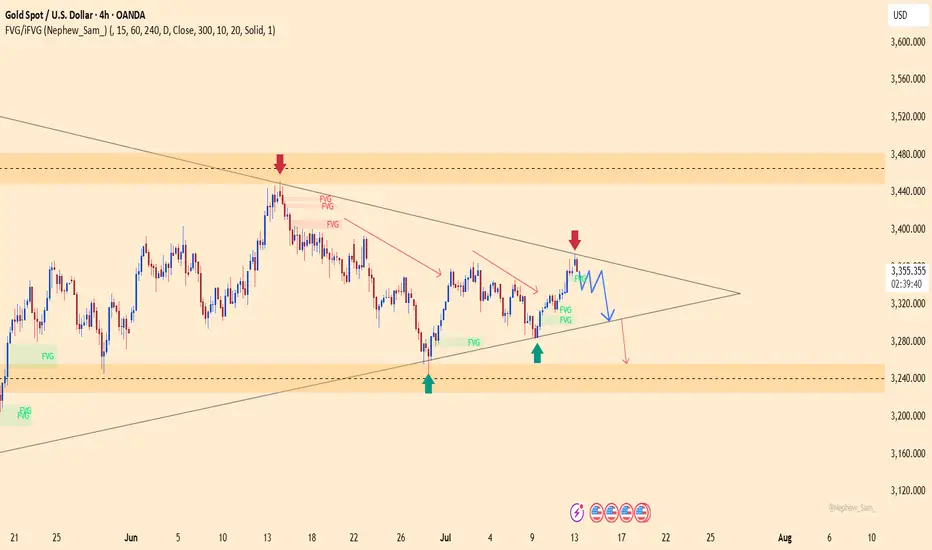
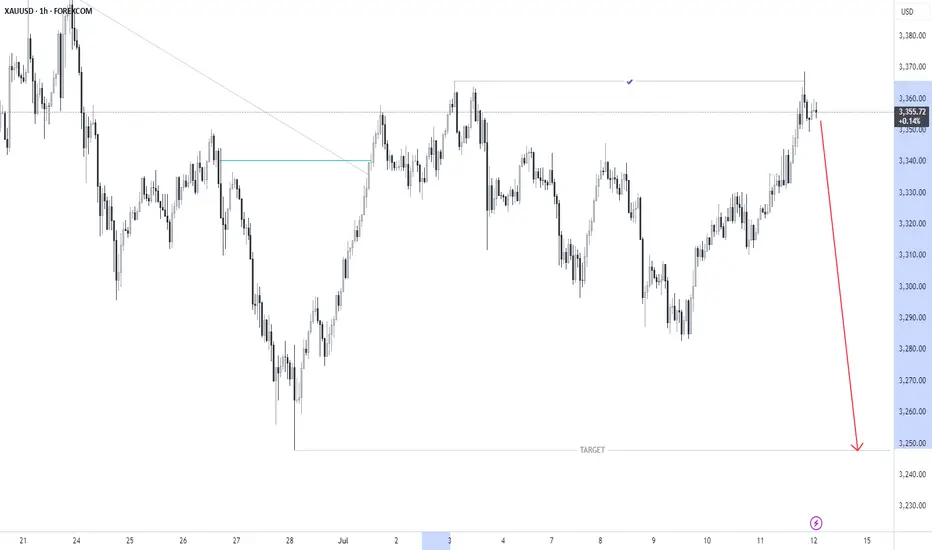
XAUUSD at risk of dropping – is gold going to fall further?XAUUSD is currently trading around 3,355, close to the resistance at 3,375. After a strong rally, gold is facing difficulty at this level and is likely to experience a correction. A symmetrical triangle pattern is forming, and if gold fails to break through the resistance, the price could drop to 3,301 or 3,255.
In terms of news, the USD and U.S. bond yields are holding steady, with stable U.S. employment data and no clear signals from the Fed on interest rate cuts. Additionally, the World Gold Council warns of a potential correction in gold if global political tensions ease or if USD and bond yields continue to rise.
Sellers are starting to take control, and if the support at 3,320 is broken, gold could fall further. Keep a close eye on the market!
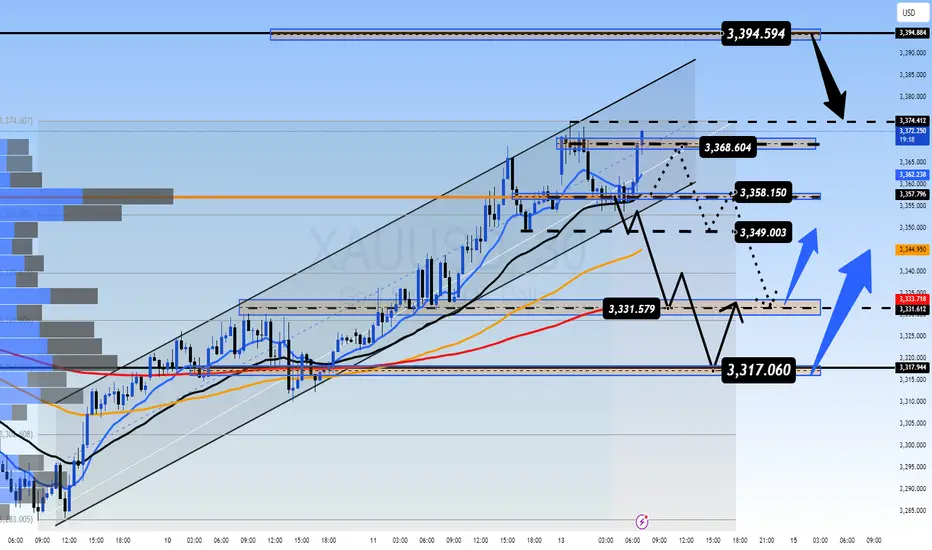
Early Week Correction Ahead of Heavy News Flow GOLD PLAN – July 14 | Early Week Correction Ahead of Heavy News Flow
📰 Macro Context – Volatile Week Expected
Gold opened this week with a sharp correction, retracing after sweeping liquidity from the previous 2-week FVG zone. This early reaction reflects investor caution ahead of key tariff-related announcements due later this week.
In addition to geopolitical factors, the market is also bracing for major US economic data, including:
📊 CPI (Consumer Price Index)
📊 PPI (Producer Price Index)
📊 Unemployment Claims
📊 Retail Sales Figures
These events combined make this a high-volatility week with potentially strong directional moves in the second half.
📉 Technical Outlook – M30 Timeframe
Price has taken out minor liquidity above recent highs
Currently retracing over $15 from the top
Price is now trading below the intraday VPOC (around 3358) — suggesting potential bearish momentum
If momentum continues, gold may dip into key demand zones:
🎯 333x
🎯 Possibly lower into 332x
This could provide a healthy retracement before resuming the broader uptrend.
🧭 Trading Strategy
✅ BUY ZONE: 3331 – 3329
Stop-Loss: 3325
Take-Profits:
TP1: 3335
TP2: 3340
TP3: 3344
TP4: 3350
TP5: 3360 – 3370+
🔍 This zone aligns with prior support, potential liquidity traps, and EMAs on higher timeframes — high-probability area for bounce trades if volume confirms.
⚠️ SELL ZONE: 3393 – 3395
Stop-Loss: 3399
Take-Profits:
TP1: 3390
TP2: 3386
TP3: 3382
TP4: 3378
TP5: 3374 – 3370 – 3360
📉 Great for short-term scalps if price re-tests the zone and shows rejection signs, especially around key news events.
📊 Key Levels to Watch
🔺 Resistance Zones
3358
3368
3374
3394
🔻 Support Zones
3349
3340
3331
3318
⚠️ Execution Notes & Sentiment
🕰️ At the time of writing, gold is consolidating near the M30 VPOC with no clear break in either direction.
🧘 Stay patient and wait for clear confirmation from European session volume
🚫 Avoid FOMO trades — stick to structure
✅ Respect all SL/TP levels to protect your capital
This week’s volatility will reward discipline, not speed.
📌 Summary
Gold is currently in a short-term pullback after reaching previous liquidity zones.
There’s potential for a deeper dip early this week before macro news pushes price decisively.
📌 3331–3329 remains the primary BUY zone to watch if price shows bullish confirmation.
📌 3393–3395 remains the key SELL zone for potential short-term rejections.
🔍 What’s your view this week? Are you looking to buy the dip or short the bounce?
💬 Drop your thoughts in the comments — let’s discuss setups!
✅ If this helped you, hit that like & follow for more daily plans.
📩 Want private signals & deeper trade setups? DM to join our premium group.
Gold Finds Strength in UncertaintyGold prices surged for the fourth consecutive session after U.S. President Donald Trump announced a new wave of tariffs — including a 35% import tax on Canadian goods and threats of 15–20% tariffs on other major trade partners. Previously, the U.S. had already imposed a 50% tariff on copper and Brazilian imports. These aggressive trade measures have reignited fears of a global economic slowdown, prompting investors to seek refuge in gold.
As a result, gold is increasingly viewed as a buying opportunity, with many prioritizing safety over chasing equity market highs.
Adding to the bullish case, expectations of a Federal Reserve rate cut — reinforced by comments from Fed officials Waller and Daly — have further boosted the metal’s appeal.
In summary, the mix of rising trade tensions and a dovish monetary outlook is providing strong short-term support for gold’s upward momentum.

EURUSD: are the bulls taking control?EURUSD is currently trading around 1.1691 and maintaining a bullish structure with consistently higher lows. On the H4 chart, a symmetrical triangle is forming, and price may break out toward the 1.1823 target if it can overcome the resistance trendline.
On the news front, the US dollar has weakened as the Fed has yet to provide a clear signal on rate cuts. Meanwhile, Eurozone economic sentiment is improving, supported by a slight uptick in manufacturing and services data. This reinforces the euro's recovery and keeps upward pressure on EURUSD.
If the 1.1660 support zone holds firm, the upcoming breakout could trigger a strong bullish move. Buyers are waiting for confirmation — are you in the game?

NIFTY Slips Below 25,200 The Nifty closed today at 25,149, down by around 205 points.
It has broken an important support level near 25,330, which could be a warning sign for traders and investors.
The market is showing signs of weakness – key technical indicators like RSI and MACD are also turning negative.
If Nifty slips below 25,000, we might see more downside movement in the coming days.
👉 For now, it’s better to stay cautious.
Long-term investors should wait for stability.
Short-term traders should manage risk and avoid over-trading.
Keep an eye on upcoming Q1 earnings and global market trends.
This is not the time to panic – it’s the time to stay informed and plan smartly.
Caption Highlights (optional for post tags or image text):
Nifty breaks 25,330 support
Watch 25,000 as next key level
Bearish signals on technical charts
Caution advised for traders
Market waiting for fresh cues
TRADER PSYCHOLOGY - Overtrading The Silent Killer of ConsistencyTRADER PSYCHOLOGY | EPISODE 1: Overtrading – The Silent Killer of Consistency
In the dynamic world of forex trading, success doesn't come from doing more — it comes from doing right. Yet many traders, especially full-time traders in India, unknowingly fall into a common psychological trap that slowly erodes both their capital and confidence: Overtrading.
Let’s break it down — what overtrading is, why it happens, and most importantly, how to stop it before it burns through your progress.
🧠 What Is Overtrading in Forex?
Overtrading refers to excessive trading – opening too many positions without clear signals or justification based on your strategy. In most cases, it’s driven by emotion, not logic.
It usually shows up in two forms:
Trading out of boredom or the urge to “do something”
Trying to recover from previous losses (a.k.a. revenge trading)
Over time, this behavior becomes a habit — and like most bad habits in trading, it’s expensive.
⚠️ Signs You Might Be Overtrading
If you answer "yes" to any of these, it’s time to check your discipline:
Do you feel uncomfortable when you’re not in a trade?
Do you enter trades even when your system says “no trade”?
Do you keep switching charts hoping to “find a setup”?
After a losing trade, do you jump right back in to recover?
Have you lost more to fees/spread than actual price movement?
🧩 Why Indian Traders Often Fall Into Overtrading
🔹 The Action Bias
Traders often feel they must "do something" to be productive. In reality, sitting out is a strategy — especially when markets are flat or unclear.
🔹 Pressure to Perform Daily
Many traders in India try to generate consistent income from trading — and assume they must win every day. That pressure leads to forcing trades just to “hit targets.”
🔹 Overconfidence After a Winning Streak
Success leads to confidence — but too much confidence without structure leads to impulsive trading. One good day shouldn’t convince you that you’ve mastered the market.
🔥 Consequences of Overtrading
Overtrading doesn’t just hurt your account — it breaks your mindset.
Capital Depletion: Small losses + transaction costs = big drawdown over time
Mental Burnout: You feel drained, frustrated, and reactive
Lack of System Trust: You abandon good strategies because you never followed them properly
Emotional Instability: You start making decisions based on fear or revenge, not analysis
✅ How to Control Overtrading – Practical Steps
1. Limit the Number of Trades Per Day
Set a clear rule — e.g., “Maximum 3 trades per day.” This forces you to choose the best setups and ignore mediocre ones.
2. Keep a Simple Trading Journal
Write down:
Why you took the trade
Whether it matched your plan
Your emotional state
Reviewing this weekly will reveal patterns you never noticed in real time.
3. Block Out Non-Active Trading Hours
For Indian traders, this might mean avoiding low-volume periods like mid-Asia session. Focus on London or US overlap hours — when liquidity and volatility are high.
4. Understand: Not Trading Is Still Trading
Being flat (no position) is a strategic decision. Markets reward patience, not impatience.
🎯 Final Thoughts
Overtrading is not a technical issue — it’s a mindset issue.
When you feel the urge to “do something,” remind yourself: the best traders don’t trade all the time. They wait, they observe, and they only act when everything aligns.
"The market doesn’t pay you for activity — it pays you for accuracy."
If you want to grow consistently, you must master the art of waiting, filtering, and executing with purpose.
📌 Next in the Series:
TRADER PSYCHOLOGY | EPISODE 2: FOMO – How Fear of Missing Out Destroys Good Decisions
Follow this page to get notified when it drops!

Banknifty 1day time frame📊 Current Status (as of today)
Bank Nifty is trading around: ₹56,750 – ₹56,800
It's just below its all-time high, which is around ₹57,628.
The trend is still positive (bullish), but it’s taking a breather after a big rally.
🛡️ Strong Support Zones (Buy on Dip Areas)
These are the price areas where Bank Nifty may bounce back if it falls:
₹55,500 – ₹55,700 → Minor support
₹54,300 – ₹54,500 → Stronger support zone (good for long-term entry)
₹52,500 – ₹53,000 → Very strong base; ideal for adding long-term positions if market corrects
🚀 Resistance Levels (Where Price Might Struggle)
These are areas where it might face selling pressure:
₹57,000 – ₹57,200 → Near-term resistance
₹57,600 – ₹57,800 → All-time high zone
Above ₹58,000 → Fresh breakout, could fly to new levels if crossed with volume
✅ What You Can Do (If You’re a Long-Term Investor)
If you already hold: Stay invested. Trend is still up.
If you want to buy:
Wait for a dip to around ₹54,300–₹55,000 for a safer long-term entry.
Or, buy small now and add more on dips.
Breakout Strategy: If Bank Nifty closes above ₹57,800, it may start a new rally.
📌 Summary in One Line:
“Bank Nifty is near its highs — still bullish, but don’t chase. Buy dips around ₹54,500 or add more only if it breaks above ₹57,800.”

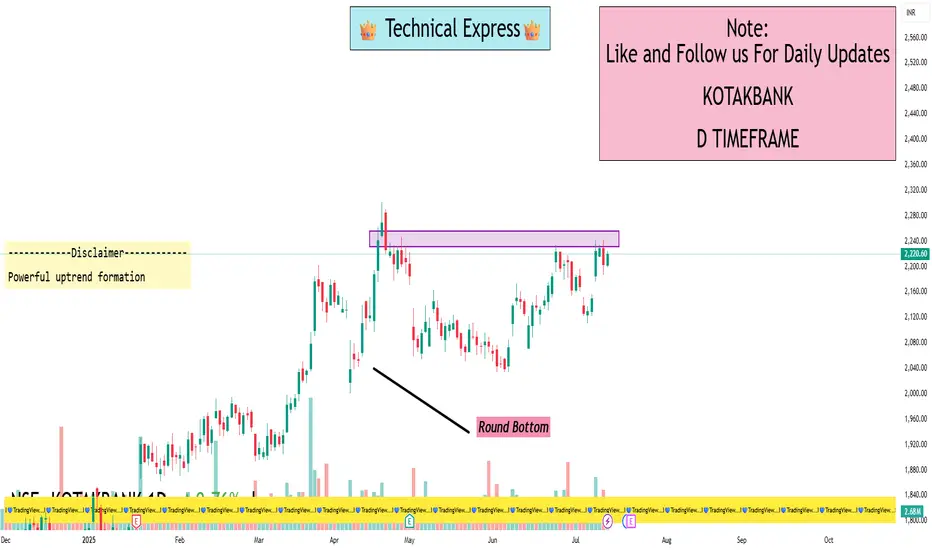
KOTAKBANKKotak Bank has been weak for a while but now it's trying to form a bottom. The stock is not yet in a strong uptrend, but it's showing early signs of a possible recovery.
Good Price to Invest
If you're looking to invest, a good range to start buying is around:
Here are the current daily price levels for Kotak Mahindra Bank (KOTAKBANK) on NSE:
Last traded price: ₹ 2,220.60, up
Today's range: ₹ 2,198.60 – ₹ 2,225.00
52‑week range: ₹ 1,679.05 – ₹ 2,301.90
Intraday Pivot Levels (Approximate)
According to Equity Pandit, today's pivot-based support and resistance likely fall at:
Immediate Supports:
• S1 ≈ ₹ 2,204
• S2 ≈ ₹ 2,188
• S3 ≈ ₹ 2,178
Resistances:
• R1 ≈ ₹ 2,231
• R2 ≈ ₹ 2,241
• R3 ≈ ₹ 2,257
Drilling deeper, a key intraday level is ₹ 2,184:
If the stock closes below ₹ 2,184, the short-term trend could weaken—potential signal to lighten downside risk.
As long as it stays above ₹ 2,184, the positive momentum may hold.
XAUUSD - 1H SHORT (GOLD)FOREXCOM:XAUUSD
Hello traders , here is the full multi time frame analysis for this pair, let me know in the comment section below if you have any questions, the entry will be taken only if all rules of the strategies will be satisfied. wait for more Smart Money to develop before taking any position . I suggest you keep this pair on your watchlist and see if the rules of your strategy are satisfied...
Keep trading
Hustle hard
Markets can be Unpredictable, research before trading.
Disclaimer: This trade idea is based on Smart money concept and is for informational purposes only. Trading involves risks; seek professional advice before making any financial decisions. Informational only!!!
XAUUSD Analysis – Bearish Pressure ReturnsGold is facing renewed bearish pressure, as the H4 chart shows a failed attempt to break above the resistance FVG zone around $3,339. The overall structure remains bearish, with a likely move toward the $3,264 support zone in the coming sessions.
On the news front, recent U.S. CPI data came in stronger than expected, supporting the USD. Additionally, hawkish comments from Fed officials like Musalem, along with FOMC minutes showing no rush to cut rates, have stalled gold’s upward momentum. Meanwhile, the 10-year Treasury yield remains elevated, reducing the appeal of non-yielding assets like gold.
If XAUUSD fails to hold above the $3,300 zone, a move down toward $3,265 is highly probable in the short term.

EURUSD – Failed Breakout, Bearish Momentum Takes OverEURUSD attempted to break out of the upper edge of a consolidation triangle but was swiftly rejected around the 1.17450 region, forming a classic “failed breakout” — a pattern that often precedes strong reversals. The pair is now pulling back and appears to be heading toward the 1.16800 support zone.
On the news front, the market is under pressure from rising expectations that the Federal Reserve will maintain higher interest rates for longer, following stronger-than-expected U.S. job data. This has driven a notable recovery in the U.S. dollar, putting downward pressure on the euro. In this context, EURUSD risks a deeper correction if the 1.1700 support fails to hold. Keep a close eye on price action — this pullback could be the start of a new bearish leg.

USDJPY – Is the Downtrend Taking Shape?On the H4 chart, USDJPY shows signs of weakening as it repeatedly fails to break above the long-term descending trendline. Despite a recent recovery toward the 147.000 level, buying momentum appears to be fading. The price structure suggests the possibility of a false breakout before a reversal toward the 144.300 support zone—an area with multiple unfilled FVGs.
From a news perspective, traders are awaiting today’s upcoming U.S. CPI report. If inflation data comes in hotter than expected, the USD may gain short-term strength. However, a weaker CPI reading could trigger a quick reversal in USDJPY, confirming the bearish setup. The 147.000 level remains the critical zone to watch for any potential rejection or breakout.
