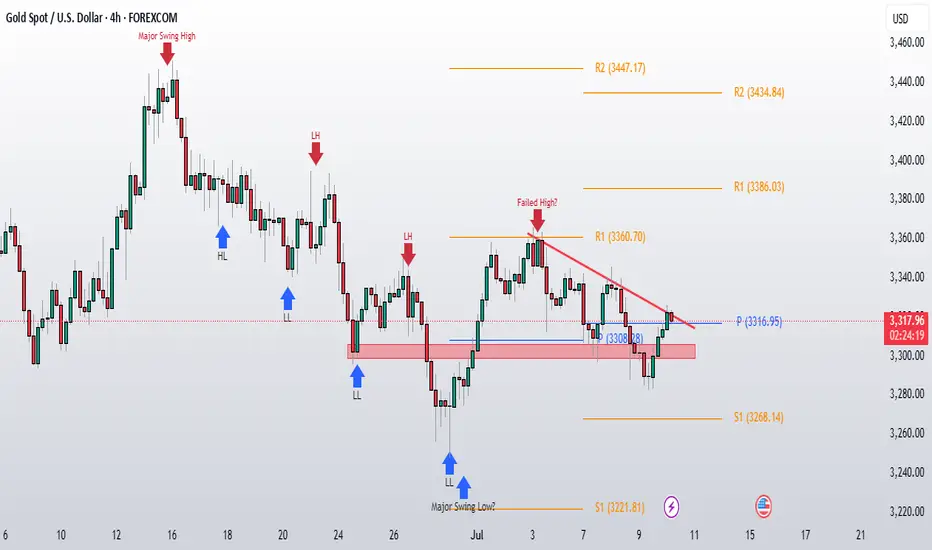
Gold Update - July 11th, 2025Gold is holding strong above 3300 on the daily close and today price breakout from the resistance trendline I mentioned yesterday. Also price is staying above the weekly pivot, which shows the bulls are getting more confident.
We're seeing some real momentum building up. The breakout from that trendline resistance is a good sign that buyers are ready to push higher.
Key Levels to Watch:
Upside Targets:
For intra day, watch 3340-45 as the next resistance area
For the bigger timeframe, we need to break and hold above 3355-60. That's the major level that will tell us if this is just a bounce or the start of something bigger.
Downside Support:
If things go wrong, the weekly pivot is our first support to watch
Also keep an eye on this week's low as backup support
Gold is finally picking a direction and it's pointing up. The breakout from the trendline gives us some confidence, but we're still in range on higher TF.
The real test will be if we can push through 3340-45 and then tackle that bigger 3355-60 area. If we can do that, then we might be back in business for the bulls.
M-forex

EUR/USD Slides as Trade Tensions WeighThe EUR/USD pair extended its steady decline on Thursday, approaching the weekly lows as global financial markets remained under pressure from aggressive U.S. tariff announcements. The U.S. President unveiled new tariffs on copper — a key industrial commodity — and signalled upcoming restrictions on the pharmaceutical sector.
A mix of inflation concerns, supply chain disruptions, and continued strength in the U.S. dollar has put the euro under visible pressure. From a technical standpoint, EUR/USD remains in a downward correction phase after pulling back from multi-year highs, with bearish momentum holding firm.
Unless a surprise emerges from economic data or monetary policy shifts, the short-term bias is likely to remain tilted to the downside.

Gold Finds Support as Tariff Tensions RiseHello everyone! What’s your take on XAUUSD today?
OANDA:XAUUSD is showing a mild recovery, currently trading around $3,323, gaining over 100 pips on the day. Despite this bounce, the short-term structure still leans in favour of the bears.
On July 9th, President Biden announced a 50% tariff on copper and a projected 200% tariff on pharmaceuticals, following earlier notices of 25–40% tariffs imposed on 14 countries including Japan, South Korea, Thailand, Laos, and Malaysia.
This escalation has led to a sharp rise in international copper prices and reignited fears of global inflation, supply chain disruptions, and slower economic growth. As consumers cut back and companies face contract renegotiations, financial risk is spreading across global markets.
In this climate, investors are returning to gold as a safe haven, seeking capital protection in anticipation of broader market instability.
📈 Outlook: Gold prices may continue to rally in the short term if the U.S. unveils further tariff measures or reveals new negotiation drafts in the coming days.

Gold Update - July 10th, 2025Yesterday we have seen breakdown below Monday's low , but bulls again stepped in at the lower levels and pushed gold back above 3300 by the daily close. This was actually a really encouraging sign that buyers are still willing to defend this level.Things are looking a bit better now. Gold is trading above the weekly pivot, which is a positive shift from yesterday's weakness.
What's in the way:
The immediate challenge is that dynamic trendline you can see on the chart
Bulls need to break through this first ....
After that, the next big test is around 3340 this is a high volume area where we've seen plenty of action before.
old is basically stuck in a range between 3280-85 on the bottom and 3335-40 on the top. Right now, there's no clear direction.
We need a decisive break from this range. Until then, we're just watching price bounce between these levels without any real commitment from either buyers or sellers.
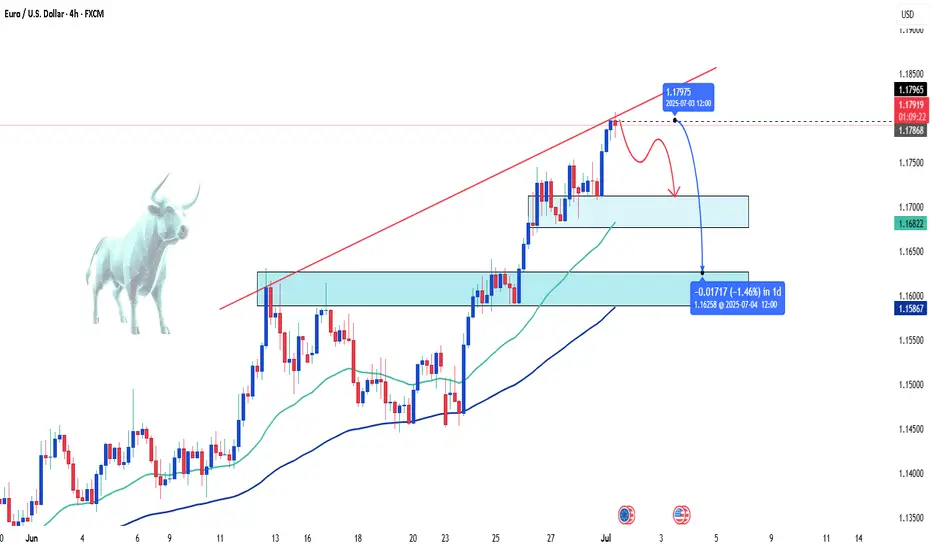
EURUSD – Rebounding from supportEURUSD is forming a small rounded bottom after testing the support zone around 1.1670. If this level holds and price breaks above the nearby FVG area, the pair may continue its recovery toward the 1.1820 target, as shown in the projected path.
Fundamentally, the euro is supported by stronger-than-expected Eurozone retail sales and rising inflation expectations ahead of this week’s CPI data (scheduled for July 10–11). Meanwhile, the USD is under pressure due to uncertainty over U.S.–EU trade policy and a lack of clarity from U.S. trade decisions, which favors a EURUSD rebound.
As long as EURUSD holds above 1.1670, the bullish outlook remains valid. However, a break below this zone could send the pair back toward the 1.1600 area.

XAUUSD – Gold Maintains Bullish Momentum Amid Trade TensionsGold continues to respect its long-term ascending trendline that started in September 2024. After a corrective move from the $3,450 resistance zone, price has just retested the trendline near $3,060 and bounced strongly — a clear sign that buyers still control the bullish structure.
Fundamentally, gold is supported by two major factors:
The U.S.–14-nation trade conflict, with a tariff deadline set for August 1st, is fueling risk-off sentiment and driving safe-haven demand — pushing gold above $3,300.
The global de-dollarization trend and over $38 billion flowing into gold ETFs in H1 2025 are strengthening gold’s role as a USD alternative.
Looking ahead: If XAUUSD holds above the $3,060 support zone, it may head toward $3,211 and possibly $3,350. The bullish outlook remains intact as long as the trendline is respected.

Bad News Piling Up – EURUSD Under Heavy PressureEURUSD is slipping fast as a wave of negative news hits the Eurozone. Service PMIs in both Germany and France have weakened, signaling a clear slowdown in the region’s economy. This has sharply reduced expectations of further rate hikes from the ECB.
Meanwhile, Fed officials are doubling down on their hawkish tone, stressing that U.S. inflation remains sticky and interest rates may need to stay higher for longer.
The growing policy divergence between the ECB and the Fed is becoming undeniable – and that’s exactly why EURUSD continues to slide.

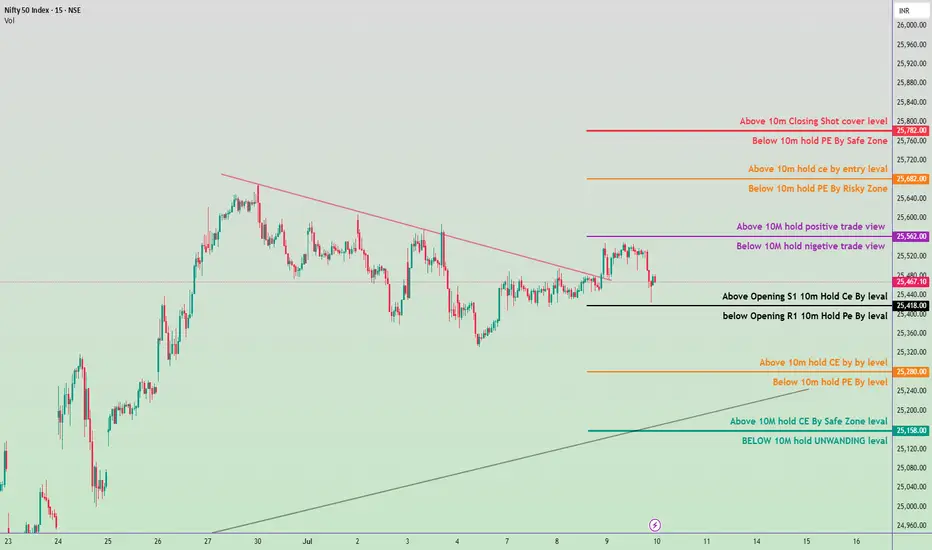
Nifty 50 Intraday Trade Plan 10 july 2025🟣 1. Trend Confirmation Zone (Level: 25,562.00)
Above 25,562.00 → Positive View Active
If Nifty sustains above this level for more than 10 minutes, it indicates bullish momentum. Call Option (CE) traders can stay in the trade or consider new entries.
Below 25,562.00 → Negative View Active
If Nifty stays below this level, bearish momentum is likely. Put Option (PE) trades are favorable.
⚫ 2. Opening Range Levels
Above 25,467.10 (Opening S1) → Hold CE (Call Option)
If the market holds above this after the opening 10-minute candle, you can go long (buy CE).
Below 25,418.00 (Opening R1) → Hold PE (Put Option)
If Nifty breaks this level on the downside, and sustains for 10 mins, it suggests weakness – PE trade is favorable.
🟠 3. Entry-Level Zone
Above 25,682.00 → Entry for CE (Call Option)
Bullish breakout level – good for fresh buying positions if sustained above.
Below 25,682.00 → Risky PE (Put Option) Zone
Aggressive traders may consider short trades, but this is a risky area.
🔴 4. Safe Zone for Positional Traders
Above 25,782.00 → Closing Shot / Cover Level
Indicates overbought or strong bullish continuation – exit PE positions if short.
Below 25,760.00 → Safe Zone for PE
A good place to hold PE (put) positions, as the market is weak below this.
🟠 5. Support Resistance Flip Zone
Above 25,280.00 → CE Hold Level
Support for intraday buyers. A bounce from here can give a CE opportunity.
Below 25,280.00 → PE Hold Level
Breaking this means more downside is likely – favorable for PE.
🟢 6. Strong Support / Breakdown Level
Above 25,158.00 → CE Safe Zone Level
Indicates strong buying support. If held, expect intraday recovery.
Below 25,158.00 → Unwinding Level
Panic selling or unwinding of long positions may start. Avoid CE, prefer PE.
Gold at a Crossroads – Rebound or Breakdown?Gold just faced a sharp sell-off as optimism surged around a potential trade truce. After President Trump announced a 25% tariff on Japan and South Korea, the deadline was surprisingly pushed to August 1st, giving countries room to negotiate. That pause eased market fears and triggered a short-term risk-on sentiment.
But the real pressure came from a stronger US Dollar and 10-year Treasury yields hitting a two-week high – a deadly combo for gold, which offers no yield. The shift in capital flow toward safer, interest-bearing assets pushed gold further into the red.
Now, all eyes are on the upcoming Fed minutes and speeches from key officials this week. If the tone is hawkish, gold could lose further ground. But a dovish hint might spark a bounce from the $3,290 support zone.

Gold Price Action Update - July 9th, 2025We have seen that gold retested crucial 3300 support level once again yesterday and managed to bounce back, closing above it by day's end. This suggesting that the bulls were still in control.
but again in eary asian session today Gold broke below 3300 and is now trading under Monday's low(3295-96).This is definitely a shift in momentum that we need to watch carefully.
If we stay below Monday's low (3295-96) and can't reclaim the weekly pivot, more downside pressure possible,
The next logical target /support would be the weekly S1 at 3268.
For any bullish recovery, we NEED to reclaim that weekly pivot at 3316,and 3345 our next major hurdle to overcome,while today's action looks bearish on the shorter timeframes, the daily close is still favoring the bulls for now. This creates an interesting dynamic where we're seeing some short-term weakness within what's still technically a bullish structure.

EURUSD - Sideways Action Sparks Reversal SpeculationHello traders, what are your expectations for EUR/USD?
Today, EUR/USD continues to move sideways around the 1.1800 mark during Thursday’s European session. The pair is showing signs of caution as the US Dollar gains ground amid optimism over a US–Vietnam trade deal.
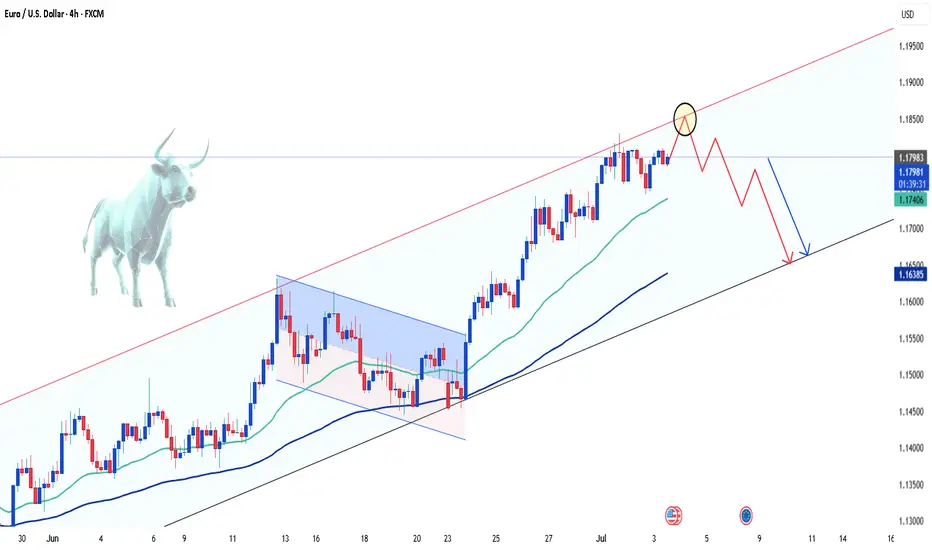
From a technical perspective, the bullish trend still dominates as the price remains within an upward channel. However, a short-term pullback could be on the horizon, especially with buying momentum fading as EUR/USD approaches the upper boundary of the channel.
What do you think—could a reversal be forming from this zone?
Drop your thoughts in the comments!
Happy trading, everyone!
EURUSD – Rebounding from Trendline, Targeting 1.18500EURUSD has bounced off the ascending trendline and key support zone around 1.16900. The price action suggests a potential continuation of the uptrend, with the next target near the 1.18500 resistance zone.
The current structure is forming higher lows, indicating bullish momentum. As long as the price holds above 1.16900, the bullish scenario remains valid.
From a fundamental perspective, the euro is supported by expectations that the ECB will keep interest rates steady, while the USD faces pressure if the upcoming FOMC minutes strike a less hawkish tone. This creates a favorable backdrop for the EURUSD uptrend.

Caution Prevails as EUR/USD Tests Downtrend LimitsToday, EUR/USD continues to hover around 1.1780, following a mild downtrend amid ongoing economic uncertainty. With a light economic calendar and looming deadlines surrounding U.S. trade tensions—particularly with Europe—traders are steering clear of aggressive positions.
Despite the structurally weak U.S. dollar due to expectations that the Federal Reserve may cut interest rates, there is no clear bullish momentum for the euro, largely because of mixed signals from the European Central Bank (ECB).
As long as the pair fails to break through the technical resistance near 1.1760—the upper boundary of the current price channel—sellers maintain the upper hand.

XAUUSD Long Idea – Inverse Head & Shoulders ReversalTechnical Overview:
I’m observing a clean Inverse Head & Shoulders pattern forming on the 4-hour chart:
✅ Left Shoulder: Formed around 3,270
✅ Head: Rejection and reversal near 3,190
✅ Right Shoulder: Higher low around 3,300
✅ Neckline: Approx. 3,350 zone
Price has broken above the neckline area and is currently retesting it as support, which strengthens the bullish case.
Trade Plan:
🔹 Entry: Current zone near 3,340–3,350 retest
🔹 Targets:
🎯 TP1: ~3,400 (recent structural high)
🎯 TP2: ~3,450–3,460 (major resistance block)
🔹 Stop Loss:
Below the right shoulder area at ~3,290 for risk containment
Rationale:
1. Inverse Head & Shoulders is a classic bullish reversal pattern
2. Break and retest of neckline suggests buyers stepping in
3. Momentum shift confirmed by higher low structure
Potential Path:
I expect price to bounce from the neckline retest and push towards the 3,400 psychological level. If momentum persists, continuation to the 3,450 resistance block is likely.
📊 Risk to Reward Estimate:
Approx. 1:2 to 1:3 depending on target selection
📝 Note:
This analysis is for educational purposes—always manage your risk and validate entries with your own confirmations.

Gold Rebounds Sharply Amid Fed Bets and Risk-Off ShiftsYesterday, the precious metal faced selling pressure as investor risk appetite improved following record highs in major U.S. stock indices.
However, that bearish trend is quickly reversing due to renewed dip-buying activity. Early this morning, gold is trading around $3,335, marking a sharp rebound of over $40 from the previous session.
Expectations of Fed rate cuts and concerns over U.S. fiscal health continue to weigh on the USD, while geopolitical risks may further support the safe-haven appeal of gold.
📊 Key Economic Events to Watch This Week
Tuesday: Reserve Bank of Australia’s monetary policy meeting
Wednesday: FOMC minutes from June’s Fed meeting
Thursday: U.S. weekly jobless claims data
Stay alert – volatility may rise as these events unfold.

Gold Bounces Back: Quick Recovery from 3300 SupportGold is now trading above this week's pivot at 3316, which is a positive development. This suggests the bulls are regaining control after yesterday's decline, Rather than breaking down after the failed attempt at 3360, gold is showing it can hold key support and bounce back quickly. This resilience is encouraging for the medium-term outlook.
Key Levels Moving Forward:
Support: 3300 (now proven)
Pivot: 3316 (currently holding above)
Resistance: 3360 (still the key level to break)

EUR/USD: Waiting for the Next Move – What’s Your Take?Hello traders, let’s dive into EUR/USD with Kevinn!
📈 Market Update:
The euro is currently under pressure following dovish remarks from ECB officials, which have increased expectations that interest rates will remain unchanged for a prolonged period. Meanwhile, the US dollar is showing mild weakness as markets begin pricing in potential Fed rate cuts later this year — though the shift hasn't been strong enough to trigger a breakout in EUR/USD.
Upcoming CPI reports will be crucial in shaping future monetary policy expectations and could define the short-term direction of this currency pair.
🧠 Personal Take:
EUR/USD is trading around the 1.0720 zone, with market momentum currently lacking. A short-term pullback toward the support zone near the 34 and 89 EMA is possible. However, from a technical standpoint, the long-term bullish structure remains intact — at least for now.
So what do you think about EUR/USD's direction? Drop your opinion below!
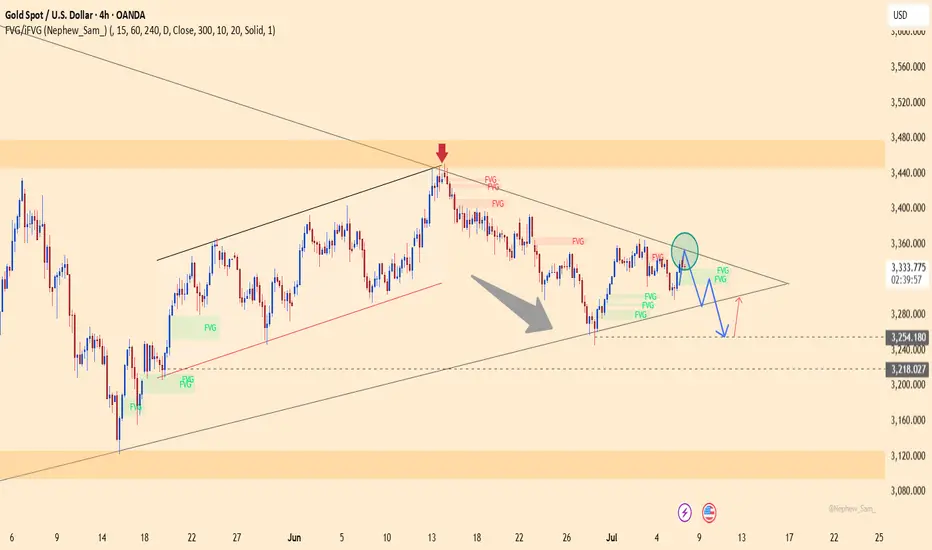
XAUUSD – Downtrend broken, bullish momentum returnsXAUUSD has broken above the descending trendline and is currently retesting the breakout zone around $3,330. If this area holds, price may continue to rise toward $3,352 and potentially $3,380.
Current price action suggests a bullish continuation pattern is forming. The bullish outlook would be invalidated if price drops below $3,255.
From a fundamental perspective, gold is supported by HSBC’s upward revision of its 2025 forecast, strong central bank demand, and rising geopolitical tensions – all reinforcing a medium-term bullish outlook.
Institutional Master classOption Trading Basics
Call vs Put Options Detailed
In-the-Money (ITM), At-the-Money (ATM), Out-of-the-Money (OTM)
Options Greeks: Delta, Gamma, Theta, Vega, Rho – controlling price sensitivity.
Understanding Option Premium Breakup
Option Strategies
Single-Leg Strategies: Buying Calls, Buying Puts
Multi-Leg Strategies:
Bull Call Spread
Bear Put Spread
Iron Condor
Straddle and Strangle
Hedging Techniques: How institutions and traders use options to hedge positions.
Option Chain Analysis
Reading Option Chain Data
Open Interest (OI) & Change in OI
IV (Implied Volatility) Impact
PCR (Put-Call Ratio) Analysis for Market Sentiment

Option Trading ClassThe Institutional Trading Process is highly strategic and complex, combining deep research, advanced technology, and strict compliance. Institutions leverage their size and tools to execute efficiently without heavily impacting the market.
Introduction to Option Trading
What are Options?
Options are contracts giving the right, but not the obligation, to buy (Call) or sell (Put) an underlying asset at a predetermined price within a specific time.
Types of Options:
Call Option: Right to buy
Put Option: Right to sell
Key Terms:
Strike Price, Premium, Expiry Date, Lot Size, Intrinsic Value, Time Value

Trading Master ClassPost-Trade Processing
Clearing and Settlement: Trades are cleared by clearing houses and settled typically on T+1 or T+2 basis.
Regulatory Reporting: All trades must be reported for transparency and compliance.
Performance Review and Compliance
Evaluation: Execution quality, cost efficiency, and market impact are reviewed.
Audit Trails: Maintain detailed records for regulatory bodies like SEBI, SEC, etc.
Continuous Improvement: Algorithms and strategies are refined based on trade performance.
Key Components in Institutional Trading
Liquidity Management: Large trades need sufficient liquidity to avoid market disruption.
Algorithmic Support: Automated systems manage trade slicing and timing.
Risk Control: Continuous monitoring of exposure, slippage, and adverse market moves.

Institutional Trading 1. Investment Idea Generation
How it Starts: Analysts, portfolio managers, or quantitative teams identify potential trades based on in-depth research, financial models, or market events.
Key Drivers: Economic indicators, earnings reports, sector performance, geopolitical news, or algorithmic signals.
2. Pre-Trade Analysis and Risk Assessment
Objective: Assess liquidity, volatility, and execution risks.
Tools Used: Option chains, order books, volume profiles, VWAP (Volume Weighted Average Price), and market depth analysis.
Risk Teams: Ensure the trade aligns with the fund’s risk appetite and regulatory requirements.

Option Trading Order Strategy Design
Execution Planning: Institutions cannot place large orders directly; they split trades into smaller lots to avoid price impact.
Techniques:
Algorithmic Trading (TWAP, VWAP, Iceberg orders)
Dark Pool Execution
Block Trades via Brokers
Trade Execution
Methods: Trades are routed through brokers, electronic communication networks (ECNs), or proprietary trading desks.
Real-Time Monitoring: Institutions monitor slippage, transaction costs, and market reaction continuously.
