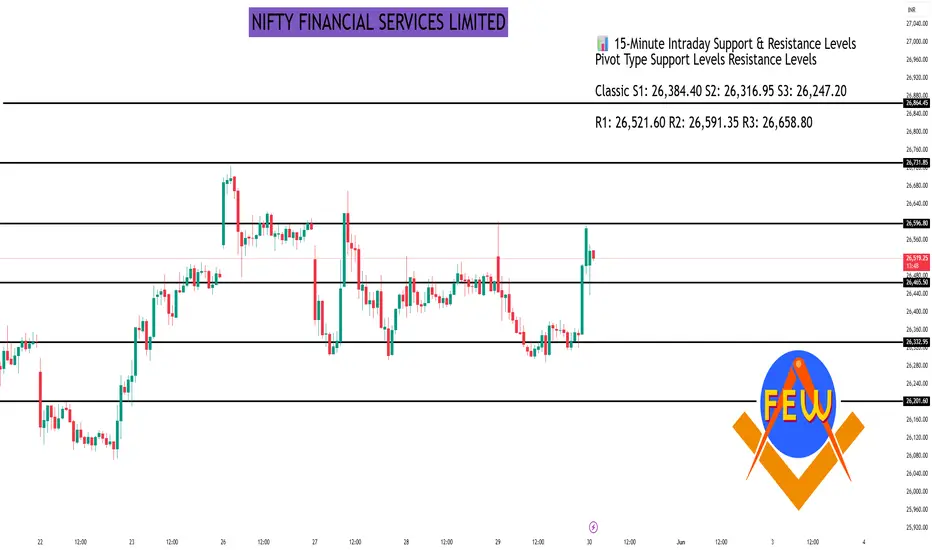
NIFTY FINANCIAL SERVICES LIMITED#FINNIFTY : INSTITUTIONAL LEVELS FOR 30/05/2025
• Overview
A simple yet powerful trading system for active 5-minute timeframe traders, built for quick, confident decisions in fast markets.
• Key Guidelines
Retest Entries: Prefer retests over breakouts.
Multiple Confirmations: Validate trades with 2+ signals.
ATM Options: Stick to at-the-money (ATM) or above for better liquidity and risk control.
• System Logic
Uses volume, historical price action, and ranges to find high-probability entries and exits, reducing guesswork and keeping trading consistent.
• Entry & Exit Signals
Blue Line: Possible long entry.
Red Line: Possible short entry.
Always align with extra confirmations for best results.
• Stop Loss & Target
Long SL: Below the nearest red line.
Short SL: Above the nearest blue line.
Long Target: Next red line above.
Short Target: Next blue line below.
Timeframe
Best for the 5-minute chart.
• Risk Note
▲ Trade responsibly. Use only capital you can afford to lose.
• Community
#Join discussions, share ideas, and grow with like-minded traders!
• Original System
* 100% original, tested in real markets for a true trading edge.
M-forex
Gold stuck inside range : No clear direction as of now Yesterday, we have seen a strong bounce from the major support zone around 3260–3280 (marked as major support on chart), reclaiming the lost ground after the initial breakdown from the trendline (green line on chart). On daily time frame price seems to be stuck in a tight consolidation range and reflects a choppy environment where neither bulls nor bears have taken decisive control.
It's worth noting that we're right at the dynamic resistance zone ( the red trendline),which continues to cap any upside attempts. On the flip side, the major support area seems to be doing a decent job of holding the floor, at least for now.
With monthly and weekly closing candles coming up today, I’m still in "wait and watch" approach, just like yesterday. The price action around this consolidation zone isn’t giving any clear, high conviction directional clues.

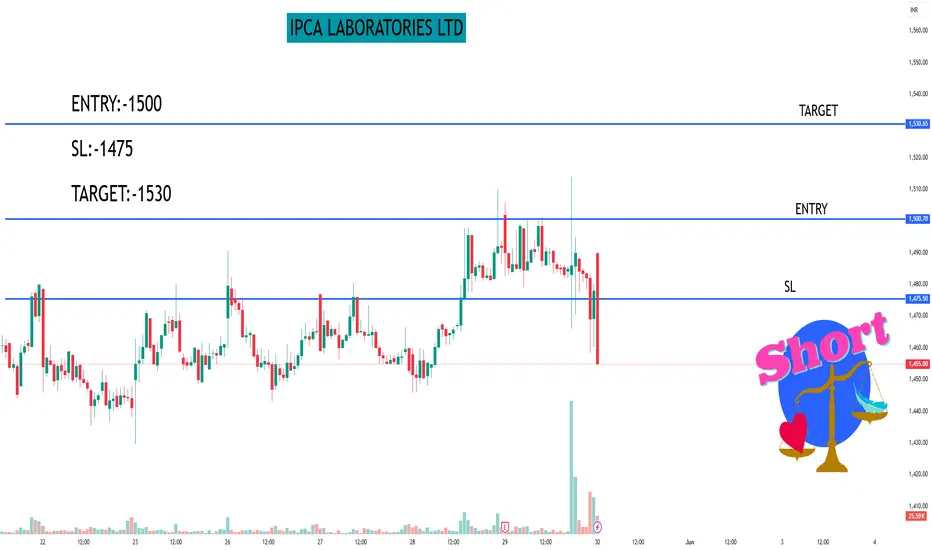
IPCA LABORATORIES LTD#IPCALAB
Intraday stock for 30/05/2025
BUY
ENTRY:-1500
SL:-1475
TARGET:-1530
Disclaimer:-All views are my personal and only for educational purpose.
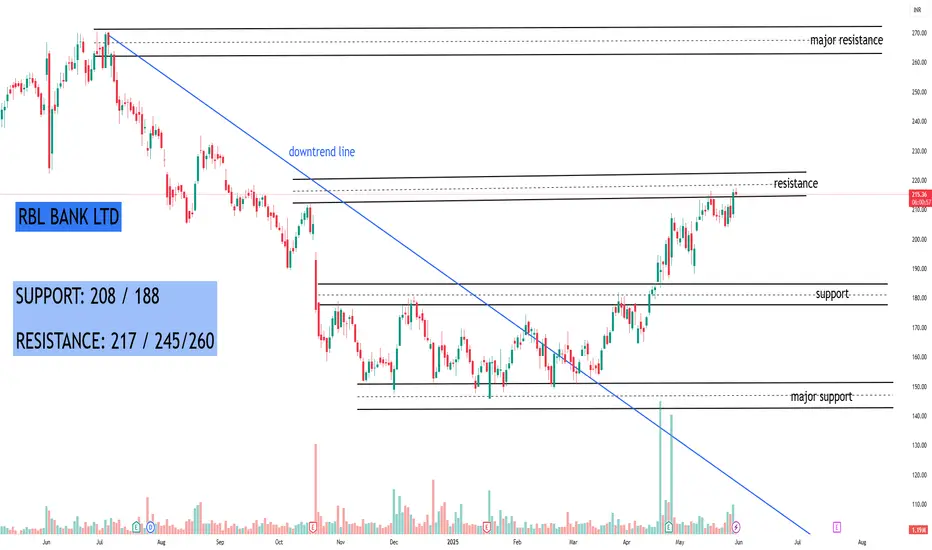
RBL BANK LTD#RBLBANK
STOCK NAME: RBL BANK LTD (NSE)
CHART ANALYSIS: Rounding Bottom breakout with bullish volume. Trend reversal confirmed.
Trading above resistance - next move can be explosive!
TREND: Bullish
SUPPORT: 208 / 188
RESISTANCE: 217 / 245/260
TRADE SETUP:
BUY above 217 | SL 208 | Targets 230 / *245 / *260
X SELL below *205 (if fails) | SL 215 | Target *190
▲ I AM NOT SEBI REGISTERED. THIS IS ONLY FOR EDUCATIONAL PURPOSE.
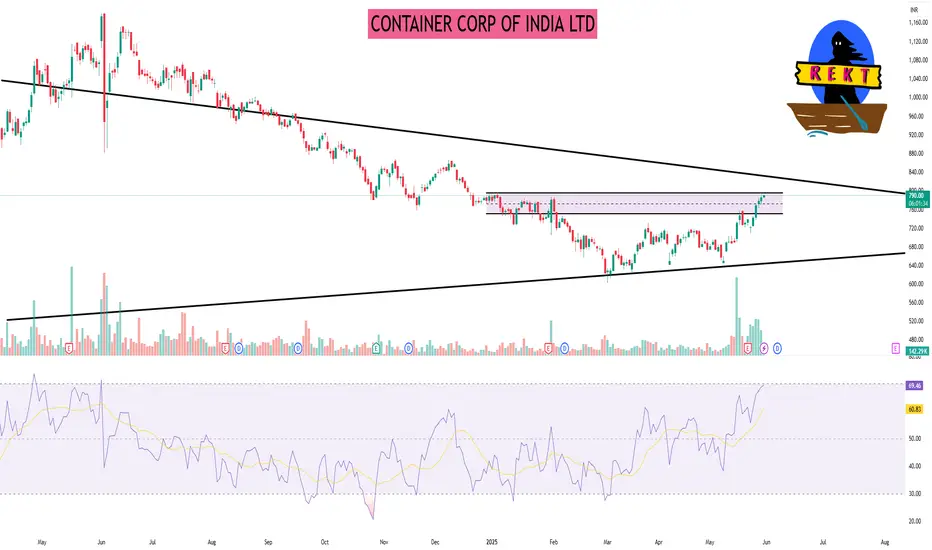
CONTAINER CORP OF INDIA LTDAs of May 30, 2025, Container Corporation of India Ltd. (NSE: CONCOR) is trading around ₹778.10. Based on daily technical analysis, here are the key support and resistance levels:
📊 Daily Support & Resistance Levels
Pivot Type Support Levels (S) Resistance Levels (R) Pivot Point (P)
Classic S1: ₹773.70S2: ₹761.45S3: ₹752.80 R1: ₹794.60R2: ₹803.25R3: ₹815.50 ₹782.35
Fibonacci S1: ₹774.37S2: ₹769.43S3: ₹761.45 R1: ₹790.33R2: ₹795.27R3: ₹803.25 ₹782.35
Camarilla S1: ₹784.03S2: ₹782.12S3: ₹780.20 R1: ₹787.87R2: ₹789.78R3: ₹791.70 ₹782.35
Note: These levels are derived from pivot point calculations and can vary based on market conditions.
🔍 Technical Overview
Trend Outlook: The stock is exhibiting a neutral to slightly bullish trend.
Key Observations:
The price is hovering around the pivot point, indicating potential consolidation.
A breakout above R1 (₹794.60) may signal bullish momentum, while a drop below S1 (₹773.70) could indicate bearish pressure.
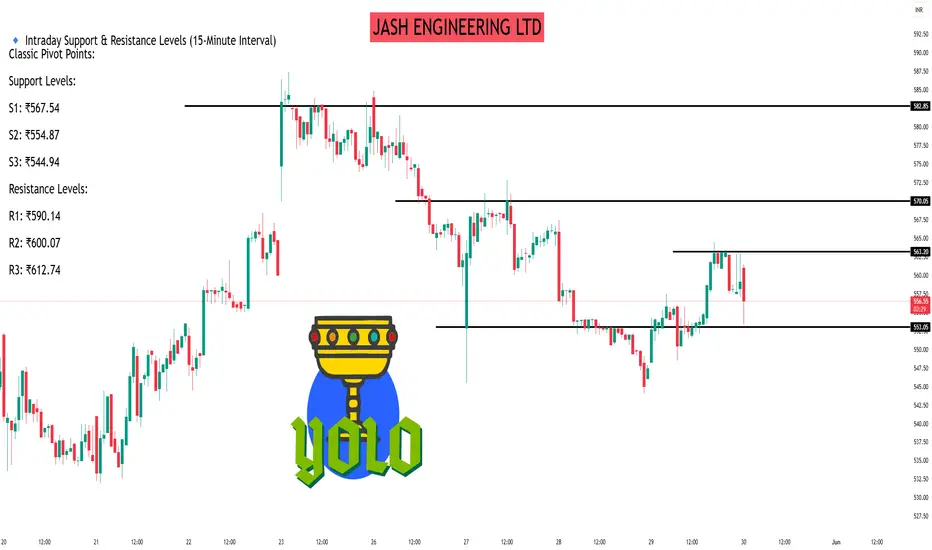
JASH ENGINEERING LTDAs of May 30, 2025, Jash Engineering Ltd. (NSE: JASH) is trading at approximately ₹559.40. Based on recent technical analyses, here are the 15-minute intraday support and resistance levels:
🔹 Intraday Support & Resistance Levels (15-Minute Interval)
Classic Pivot Points:
Support Levels:
S1: ₹567.54
S2: ₹554.87
S3: ₹544.94
Resistance Levels:
R1: ₹590.14
R2: ₹600.07
R3: ₹612.74
Fibonacci Pivot Points:
Support Levels:
S1: ₹568.84
S2: ₹563.50
S3: ₹554.87
Resistance Levels:
R1: ₹586.10
R2: ₹591.44
R3: ₹600.07
Camarilla Pivot Points:
Support Levels:
S1: ₹578.13
S2: ₹576.06
S3: ₹573.99
Resistance Levels:
R1: ₹582.27
R2: ₹584.34
R3: ₹586.42
Note: These levels are derived from pivot point calculations and can vary based on market conditions.
📊 Technical Indicators
Moving Averages: The stock is currently below both short-term and long-term moving averages, indicating a bearish trend.
MACD: A bullish crossover has been observed, suggesting potential upward momentum.
RSI: The Relative Strength Index is in the neutral zone, indicating neither overbought nor oversold conditions.
🔍 Observations
The stock has recently tested the support level around ₹539.50, which may act as a strong base.
Resistance is observed near ₹554.05, and a breakout above this level could signal further upside.
The stock's volatility is moderate, with a daily average movement of approximately 4.39%.
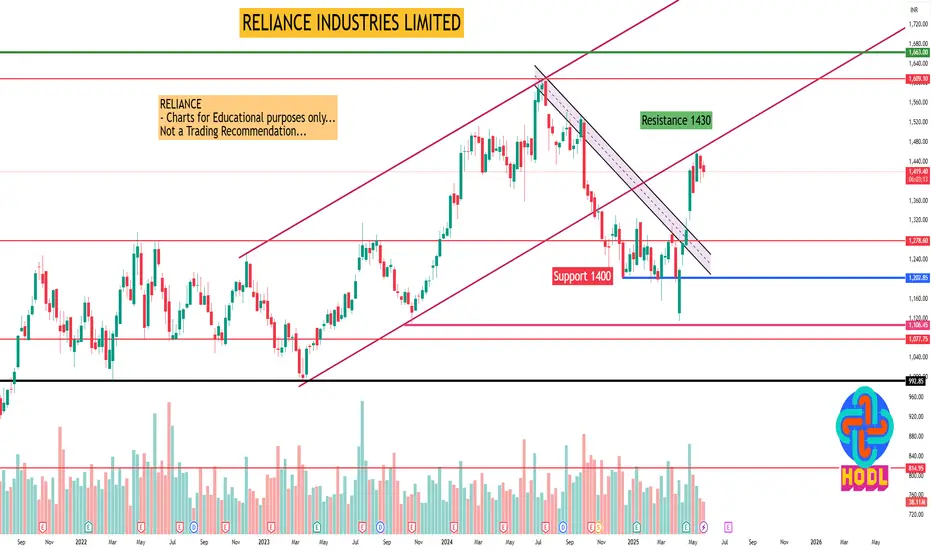
RELIANCE INDUSTRIES LIMITEDReliance Industries Ltd view for Intraday 29th May #RELIANCE
Resistance 1430 Watching above 1432 for upside momentum.
Support area 1400 Below 1410 ignoring upside momentum for intraday
Watching below 1397 for downside movement...
Above 1410 ignoring downside move for intraday
Charts for Educational purposes only.
Please follow strict stop loss and risk reward if you follow the level.
Thanks....
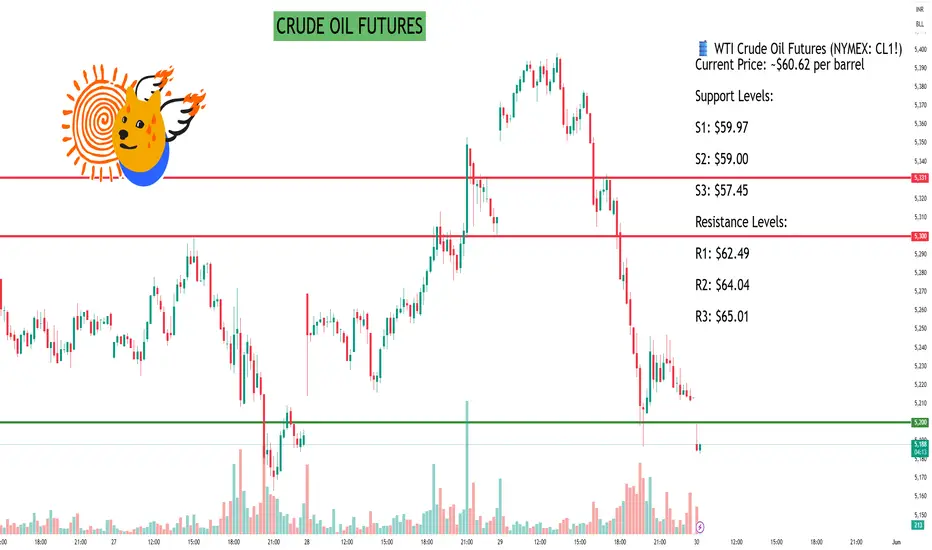
CRUDE OIL FUTURESAs of May 30, 2025, here are the latest 15-minute support and resistance levels for Crude Oil Futures:
🛢️ WTI Crude Oil Futures (NYMEX: CL1!)
Current Price: ~$60.62 per barrel
Support Levels:
S1: $59.97
S2: $59.00
S3: $57.45
Resistance Levels:
R1: $62.49
R2: $64.04
R3: $65.01
🇮🇳 MCX Crude Oil Futures (INR)
Current Price: ~₹5,191 per barrel
Support Levels:
S1: ₹5,153.33
S2: ₹5,092.67
S3: ₹5,031.33
Resistance Levels:
R1: ₹5,231.67
R2: ₹5,292.33
R3: ₹5,353.67
📊 Technical Outlook
Trend: Neutral to slightly bearish
Indicators: The 15-minute chart shows a potential for a bullish reversal, but confirmation is needed.
Strategy: Traders may consider watching for a breakout above resistance levels for potential long positions, or a breakdown below support levels for short positions.
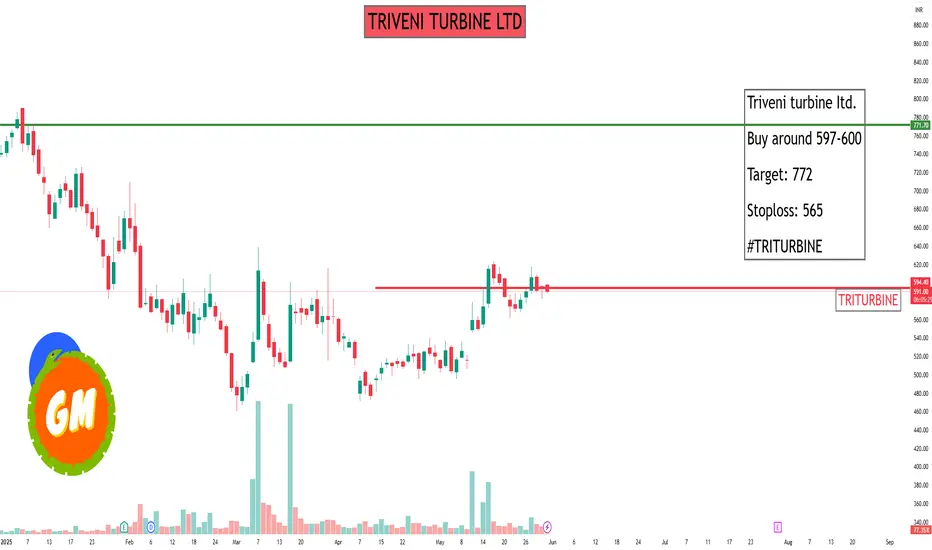
TRIVENI TURBINE LTDAs of May 30, 2025, Triveni Turbine Ltd. (NSE: TRITURBINE) is trading at approximately ₹595.40 . Based on the latest technical data, here are the intraday support and resistance levels:
🔹 Intraday Support & Resistance Levels
Standard Pivot Points:
Support Levels:
S1: ₹597.12
S2: ₹584.98
S3: ₹577.87
Resistance Levels:
R1: ₹616.37
R2: ₹623.48
Fibonacci Pivot Points:
Support Levels:
S1: ₹597.12
S2: ₹589.76
S3: ₹585.22
Resistance Levels:
R1: ₹604.47
R2: ₹609.01
R3: ₹616.37
Camarilla Pivot Points:
Support Levels:
S1: ₹590.34
S2: ₹588.57
S3: ₹586.81
Resistance Levels:
R1: ₹593.86
R2: ₹595.63
R3: ₹597.39
Note: These levels are derived from pivot point calculations and can vary based on market conditions.
🔹 Technical Indicators
Relative Strength Index (RSI): The RSI is currently between 45 and 55, indicating a neutral condition.
Stochastic Oscillator: The Stochastic Oscillator is in the bullish range, suggesting potential upward momentum.
🔹 Recent Price Action
Triveni Turbine's stock has experienced significant volatility recently. After reaching a high of ₹885.00 on November 26, 2024, the stock declined to a low of ₹460.30 on March 3, 2025. Since then, it has rebounded, trading around ₹595.40 as of May 30, 2025.
Institutional Intraday Trading Part -7Options Type: Understand whether you're dealing with Call Options (bullish) or Put Options (bearish).
Strike Price: This is the agreed price for exercising the contract. ...
Open Interest (OI): Indicates the number of active contracts for a strike price.

Divergence SecretsDivergence trading identifies potential trend reversals or continuations by comparing price action with technical indicators. When an asset's price moves in one direction, but a related indicator moves in the opposite direction, it suggests a possible shift in momentum. Traders can use this information to spot potential entry points for trades.

Support and Resistance part 2ASupport is a price point below the current market price that indicate buying interest. Resistance is a price point above the current market price that indicate selling interest. S&R can be used to identify targets for the trade. For a long trade, look for the immediate resistance level as the target.

Advanced Trading part 2The first step should be to approach trading as a business: draft a business plan, create a budget, determine the necessary tools, and determine the markets and strategies you'll trade. Organize and keep on file all important documents: trading plans, brokerage statements, trading journals, and other resources.

GOLD RETESTING KEY ZONES AHEAD OF INFLATION DATA XAUUSD PLAN – MAY 29 | GOLD RETESTING KEY ZONES AHEAD OF INFLATION DATA | HOLDING OR BREAKING?
After yesterday’s sharp decline, GOLD is showing signs of stabilization around the 3,270 region. This appears to be a consolidation phase before the market reacts to key macro events — particularly the upcoming Core PCE inflation report and a string of Fed speeches this week.
🌍 MACRO LANDSCAPE:
US 10-year yields are holding steady near 4.5%, continuing to pressure gold in the short term.
Fed officials remain cautious about rate cuts, pushing back against dovish expectations.
However, concerns over structural fiscal pressure (including Fed losses and budget cuts) support the long-term bullish case for gold.
➡️ In the short term, the market remains range-bound, and tactical entries near key zones offer the best opportunities.
📈 TECHNICAL OUTLOOK (H1):
Gold is consolidating below a major resistance zone at 3,308–3,310, which aligns with the descending trendline and 200 EMA.
Fibonacci retracement zones (0.5–0.618) also highlight strong resistance around 3,297–3,309.
On the downside, support at 3,263 is key; a break below may expose the broader demand zone near 3,246.
🔍 TRADE SETUPS – MAY 29:
🔵 BUY ZONE: 3,247 – 3,245
Stop Loss: 3,241
Take Profit Targets:
3,251 – 3,255 – 3,260 – 3,264 – 3,270 – 3,275 – 3,280
🔵 BUY SCALP: 3,263 – 3,261
Stop Loss: 3,257
Take Profit Targets:
3,266 – 3,270 – 3,275 – 3,280 – 3,290 – 3,300
🔻 SELL SCALP: 3,294 – 3,296
Stop Loss: 3,300
Take Profit Targets:
3,290 – 3,286 – 3,282 – 3,278 – 3,274 – 3,270 – 3,260
🔻 SELL ZONE: 3,308 – 3,310
Stop Loss: 3,314
Take Profit Targets:
3,304 – 3,300 – 3,296 – 3,292 – 3,288 – 3,280
📌 STRATEGY TIP:
Price is range-bound ahead of key data. Avoid entering mid-range. Wait for price to reach the edges (BUY/SELL zones) and look for clear rejection or confirmation candles. Stick to strict risk management.

Advanced Trading part 1Advanced trading encompasses sophisticated strategies, tools, and techniques used by experienced traders to navigate complex market dynamics and potentially maximize profits. It involves utilizing a range of analytical tools, including technical indicators, chart patterns, and quantitative analysis, as well as employing instruments like options and futures.

What is Divergence?In technical trading, divergence refers to when an asset's price and a technical indicator move in opposite directions. This discrepancy can signal a potential trend reversal or a weakening trend, prompting traders to consider a change in the direction of their trades.

Technical Trading Technical trading is a broader style that is not necessarily limited to trading. Generally, a technician uses historical patterns of trading data to predict what might happen to stocks in the future. This is the same method practiced by economists and meteorologists: looking to the past for insight into the future.

Database Trading **Database trading**, often referred to as **algorithmic trading** or **quantitative trading**, involves using large sets of structured data to make trading decisions and execute trades automatically. It relies heavily on databases to store, process, and analyze market data (historical prices, volumes, order books, etc.) and other relevant information (like economic indicators, news, etc.). The goal is to identify patterns, trends, or anomalies that can be leveraged for profitable trading strategies.

XAUUSD PLAN – MAY 28 |WATCHING FOMC + EU TRADE TENSIONS XAUUSD PLAN – MAY 28 | GOLD REBOUNDS SLIGHTLY BUT REMAINS UNDER PRESSURE | WATCHING FOMC + EU TRADE TENSIONS
Gold staged a mild technical recovery after last week’s heavy sell-off of nearly $100. While the bounce offers short-term opportunities, overall structure remains under bearish pressure unless bulls can reclaim the upper distribution zone.
🌍 MACRO CONTEXT – TRADE POLICY & MONETARY UNCERTAINTY:
Trump has delayed the 50% tariff on EU goods until July, calling recent trade talks “positive.”
In response, US 10-year yields spiked back above 4.55%, signaling market expectations for prolonged high interest rates.
Meanwhile, the Fed has announced a 10% workforce cut due to ongoing operational losses from interest payments — a rare move that underscores deeper fiscal constraints.
➡️ With mixed risk sentiment and no clear policy direction, Gold remains a safe-haven focus — but vulnerable in the short-term if yields and the dollar continue to rise.
📈 TECHNICAL OUTLOOK (H1):
Gold is currently trading below the 3,335–3,346 resistance zone, which has repeatedly rejected bullish attempts.
If price fails to reclaim this zone, we could see renewed bearish momentum toward the lower FVG support.
The Fair Value Gap near 3,248 remains a major zone of interest if sellers regain control.
🔍 TRADE PLAN – UPDATED LEVELS:
🔻 SELL ZONE: 3,344 – 3,346
Stop Loss: 3,350
Take Profit: 3,340 – 3,336 – 3,332 – 3,328 – 3,324 – 3,320
🔻 SELL SCALP: 3,326 – 3,328
Stop Loss: 3,332
Take Profit: 3,322 – 3,318 – 3,314 – 3,310 – 3,305 – 3,300
🔵 BUY SCALP: 3,278 – 3,276
Stop Loss: 3,272
Take Profit: 3,282 – 3,286 – 3,290 – 3,294 – 3,298 – 3,302 – 3,310
🔵 BUY ZONE: 3,246 – 3,244
Stop Loss: 3,240
Take Profit: 3,250 – 3,254 – 3,258 – 3,262 – 3,266 – 3,270 – 3,280
📌 STRATEGY TIP:
Avoid mid-range entries. Let price come to your zones. Prioritize confirmed reactions, especially near structural levels like 3,335 and 3,248.

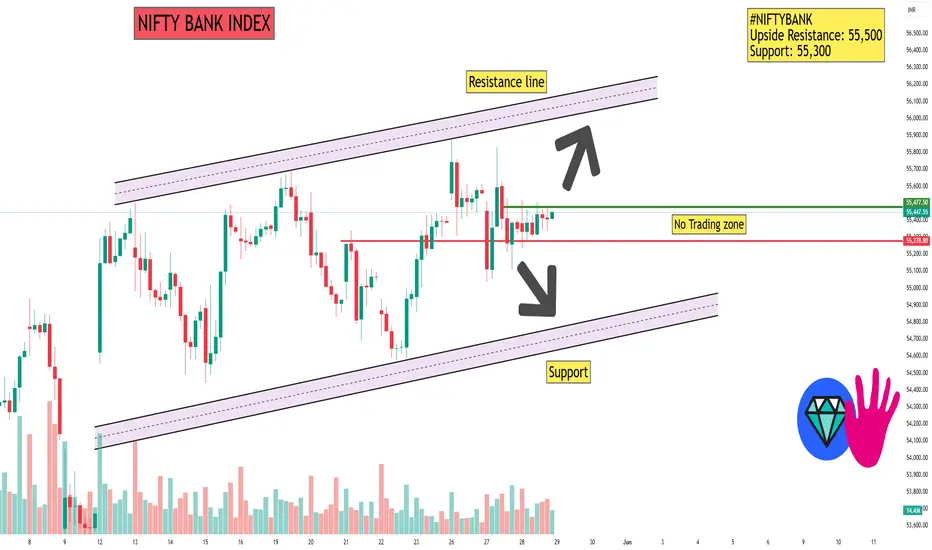
NIFTY BANK INDEX📊 1-Hour Support & Resistance Levels (Classic Pivot Points)
Based on the latest technical analysis, the key support and resistance levels for the Nifty Bank Index on a 1-hour timeframe are:
Support Levels:
S1: ₹55,261.10
S2: ₹55,105.20
S3: ₹54,974.85
Resistance Levels:
R1: ₹55,547.35
R2: ₹55,677.70
R3: ₹55,833.60
These levels are derived from the price range of the previous trading day.
🔍 Technical Indicators Overview
Relative Strength Index (RSI): Currently, the RSI is hovering around 60, indicating a neutral to slightly bullish momentum.
Moving Averages: The index is trading above its 5-day and 10-day simple moving averages, suggesting a short-term bullish trend.
MACD (12,26): The MACD line is above the signal line, indicating positive momentum.
📈 Market Sentiment
The technical indicators collectively suggest a cautiously bullish sentiment for the Nifty Bank Index. However, the RSI indicates that the index is approaching overbought territory, which may lead to a short-term correction. Investors should monitor the support and resistance levels closely for potential breakout or pullback scenarios.
Please note that stock market investments are subject to market risks, and it's essential to conduct thorough research or consult with a financial advisor before making investment decisions.
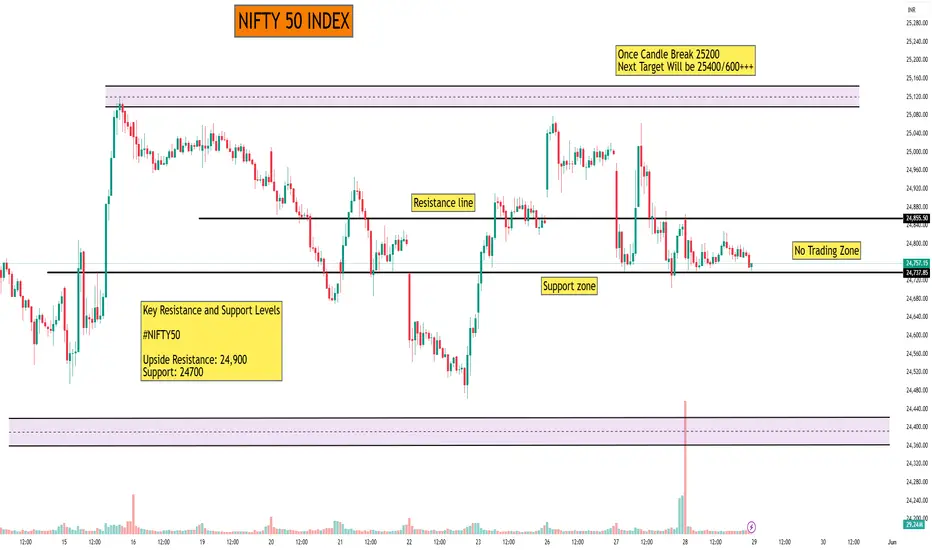
NIFTY 50 INDEXAs of May 29, 2025, the Nifty 50 Index is trading at 24,752.45, reflecting a 0.00% change from the previous close.
📊 15-Minute Support & Resistance Levels (Classic Pivot Points)
Based on the latest technical analysis, the key support and resistance levels for the Nifty 50 Index on a 15-minute timeframe are:
Support Levels:
S1: 24,784.57
S2: 24,704.93
S3: 24,657.47
Resistance Levels:
R1: 24,911.67
R2: 24,959.13
R3: 25,038.77
These levels are derived from the price range of the previous trading day.
🔍 Market Sentiment
The technical indicators suggest that the Nifty 50 Index is currently in a consolidation phase. Traders should monitor the support and resistance levels closely for potential breakout or pullback scenarios. A sustained move above the resistance levels may indicate bullish momentum, while a drop below the support levels could signal bearish sentiment.
Please note that stock market investments are subject to market risks, and it's essential to conduct thorough research or consult with a financial advisor before making investment decisions.
SIGACHI INDUSTRIES LTDAs of May 29, 2025, Sigachi Industries Ltd. (NSE: SIGACHI) is trading at ₹50.35, reflecting a 6.95% increase over the previous close.
📊 Daily Support & Resistance Levels
Based on the latest technical analysis, the key support and resistance levels for Sigachi Industries Ltd. are as follows:
Support Levels:
S1: ₹49.60
S2: ₹48.11
S3: ₹45.88
Resistance Levels:
R1: ₹53.32
R2: ₹55.55
R3: ₹58.00
These levels are derived from pivot point calculations based on the previous trading day's price range.
🔍 Technical Indicators Overview
Relative Strength Index (RSI): The RSI is currently at 87, indicating that the stock is in overbought territory. This suggests that the stock may be due for a short-term correction.
Moving Averages: Sigachi Industries is trading above its 5-day, 10-day, 20-day, 50-day, 100-day, and 200-day simple and exponential moving averages, indicating a strong bullish trend.
MACD (12,26): The MACD is currently at 2.15, suggesting bullish momentum.
📈 Market Sentiment
The technical indicators collectively suggest a strong bullish sentiment for Sigachi Industries Ltd. However, the RSI indicates that the stock is in overbought territory, which may lead to a short-term correction. Investors should monitor the support and resistance levels closely for potential breakout or pullback scenarios.
Please note that stock market investments are subject to market risks, and it's essential to conduct thorough research or consult with a financial advisor before making investment decisions.

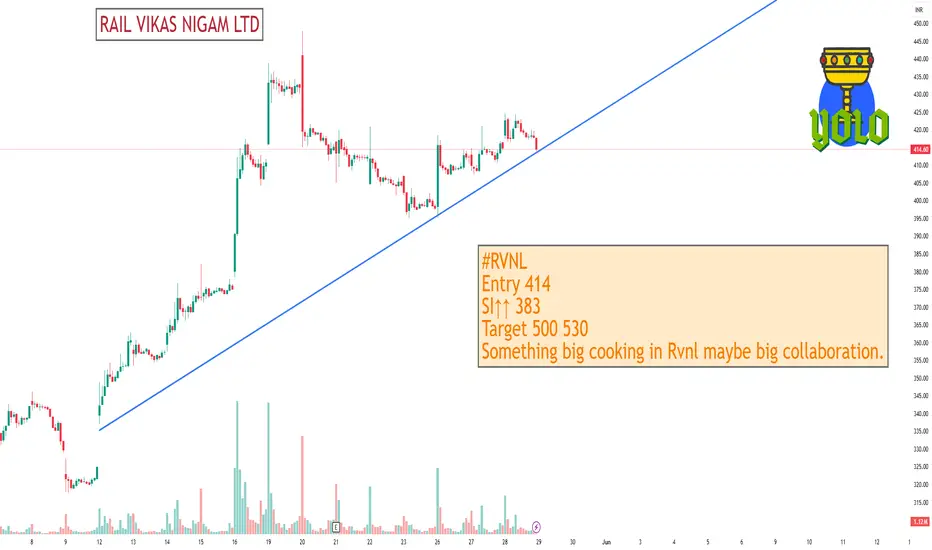
RAIL VIKAS NIGAM LTDAs of May 29, 2025, Rail Vikas Nigam Ltd. (NSE: RVNL) is trading at approximately ₹416.15, reflecting a 0.85% increase over the previous close.
📊 30-Minute Support & Resistance Levels
Based on recent technical analysis and pivot point calculations, the following support and resistance levels are identified for RVNL:
Support Levels:
S1: ₹411.93
S2: ₹407.72
S3: ₹401.43
Resistance Levels:
R1: ₹422.43
R2: ₹428.72
R3: ₹432.93
These levels are derived from the price range of the previous trading day.
🔍 Technical Indicators Overview
Relative Strength Index (RSI): The RSI is currently hovering around 70, indicating that the stock is approaching overbought territory.
Moving Averages: RVNL is trading above its 5-day, 10-day, 20-day, 50-day, 100-day, and 200-day simple and exponential moving averages, indicating a strong bullish trend.
📈 Market Sentiment
The technical indicators collectively suggest a strong bullish sentiment for Rail Vikas Nigam Ltd. However, the RSI indicates that the stock is approaching overbought territory, which may lead to a short-term correction. Investors should monitor the support and resistance levels closely for potential breakout or pullback scenarios.
Please note that stock market investments are subject to market risks, and it's essential to conduct thorough research or consult with a financial advisor before making investment decisions.