Learn Institutional Level Trading part 6Institutional trading involves the buying and selling of financial instruments for large organizations and entities, like mutual funds, pension funds, and insurance companies, on behalf of their clients or members. These entities trade large volumes, potentially influencing market prices and liquidity.
M-forex

Learn Institutional Level Trading part 3Trading institutions operate through entities which combine multiple investment funds from investors to invest in financial markets. These firms operate differently from people who maintain brokerage accounts since they oversee massive asset portfolios while their market-shaping trading volume defines their operations.

Gold What’s Happening on Monthly Price Action:What’s Happening on Monthly Price Action:
Parabolic rally: Gold has gone nearly vertical since mid-2023 a textbook parabolic curve.
Zero rejection wicks: Current and previous candles show strong-bodied closes near the highs, suggesting very little distribution.
RSI is overbought: Hovering well above 70, but still rising, meaning the momentum is intact and buyers are still in full control.
This move still has no exhaustion signal on the monthly.
No long upper wicks
No bearish engulfing
No divergence on RSI yet
We are likely in Phase 2 of the bull run where price accelerates with institutional momentum, not retail euphoria.
We are due for a healthy correction, but calling a top here is premature. A market can stay irrational longer than you can stay solvent.
"Overbought and staying overbought” is a sign of strength, not weakness. Until price shows a rejection the bulls are driving this train. We ride the wave, not fight it

PCR Trading Strategy part 2Typically, a put-call ratio is a derivative indicator. It is designed to enable traders to determine the sentiment of the options market effectively. This ratio is computed either by factoring in the open interest for a given period or based on the volume of options trading

PCR Trading Strategy part 1The Put-Call Ratio (PCR) is a technical indicator used by traders to gauge market sentiment and identify potential trend reversals. It's calculated by dividing the total open interest of put options by the total open interest of call options. A high PCR (above 1) suggests bearish sentiment, while a low PCR (below 1) indicates bullish sentiment. Traders often use PCR as a contrarian indicator, meaning they might look to buy when the PCR is high, anticipating a reversal, or sell when it's low, expecting a downturn.

Option and Database TradingIn financial terms, "option trading" and "database trading" refer to distinct activities. Option trading involves buying and selling contracts that grant the right, but not the obligation, to buy or sell an underlying asset at a specific price within a certain timeframe. Database trading, on the other hand, is not a standard financial term. It likely refers to trading or managing data within databases, which could include activities like data analysis, querying, or manipulation.

RSI and RSI Divergence RSI: Divergence appears when the RSI's highs or lows diverge from price. For example, if the price makes new lows but the RSI bottoms at higher levels, it signals bullish divergence; if the price makes new highs but the RSI peaks at lower levels, it signals bearish divergence.

Technical Concept A "technical concept" refers to a term or idea that has a specific meaning within a particular technical field, often different from its everyday meaning. These concepts are fundamental to understanding and working within that field.

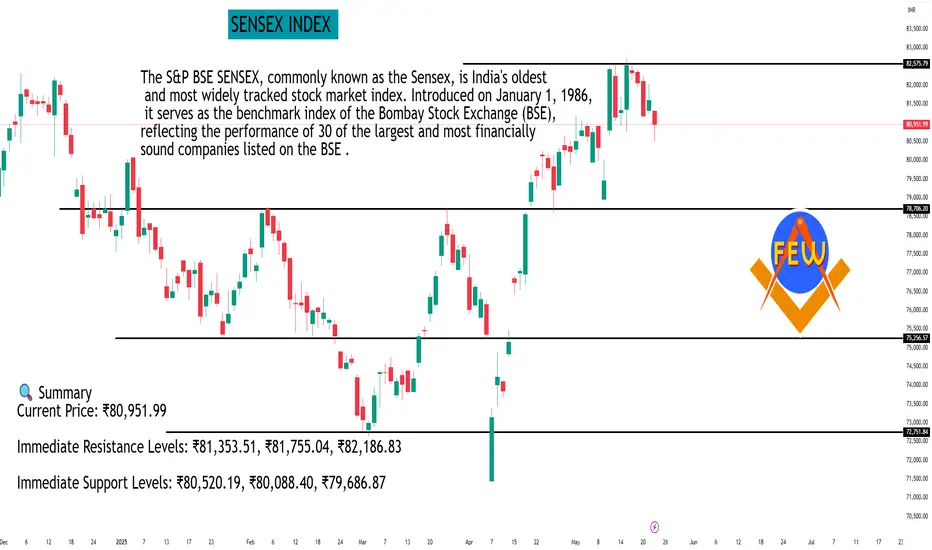
SENSEX INDEX As of the close on May 22, 2025, the BSE Sensex stood at 80,951.99, marking a decline of 0.79% from the previous session.
📊 Daily Support and Resistance Levels
Based on technical analysis, the following support and resistance levels have been identified for the BSE Sensex:
Classic Pivot Points:
Pivot Point: ₹80,921.72
Resistance Levels:
R1: ₹81,353.51
R2: ₹81,755.04
R3: ₹82,186.83
Support Levels:
S1: ₹80,520.19
S2: ₹80,088.40
S3: ₹79,686.87
Fibonacci Pivot Points:
Resistance Levels:
R1: ₹81,240.04
R2: ₹81,436.71
R3: ₹81,755.04
Support Levels:
S1: ₹80,603.39
S2: ₹80,406.72
S3: ₹80,088.40
Camarilla Pivot Points:
Resistance Levels:
R1: ₹81,028.38
R2: ₹81,104.77
R3: ₹81,181.15
Support Levels:
S1: ₹80,875.60
S2: ₹80,799.21
S3: ₹80,722.83
📈 Technical Outlook
The Sensex has entered a negative trend in the last trading session. It is considered bearish until it trades above ₹81,974 on a daily closing basis.
🔍 Summary
Current Price: ₹80,951.99
Immediate Resistance Levels: ₹81,353.51, ₹81,755.04, ₹82,186.83
Immediate Support Levels: ₹80,520.19, ₹80,088.40, ₹79,686.87
Bearish Threshold: A daily close below ₹81,974 indicates a bearish trend.
Traders should monitor these levels closely and consider broader market trends and economic indicators when making investment decisions.
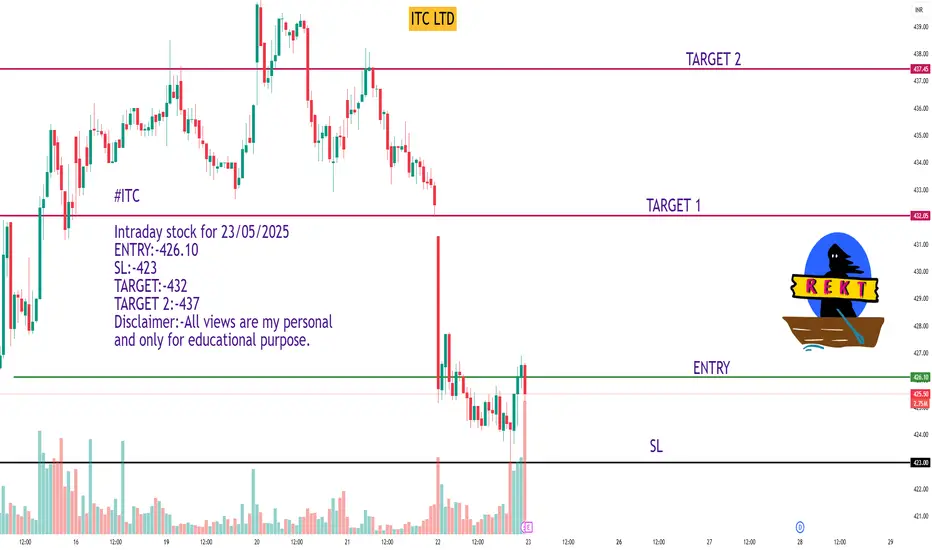
ITC LTD#ITC
Intraday stock for 23/05/2025
ENTRY:-426.10
SL:-423
TARGET:-432
TARGET 2:-437
Disclaimer:-All views are my personal and only for educational purpose.
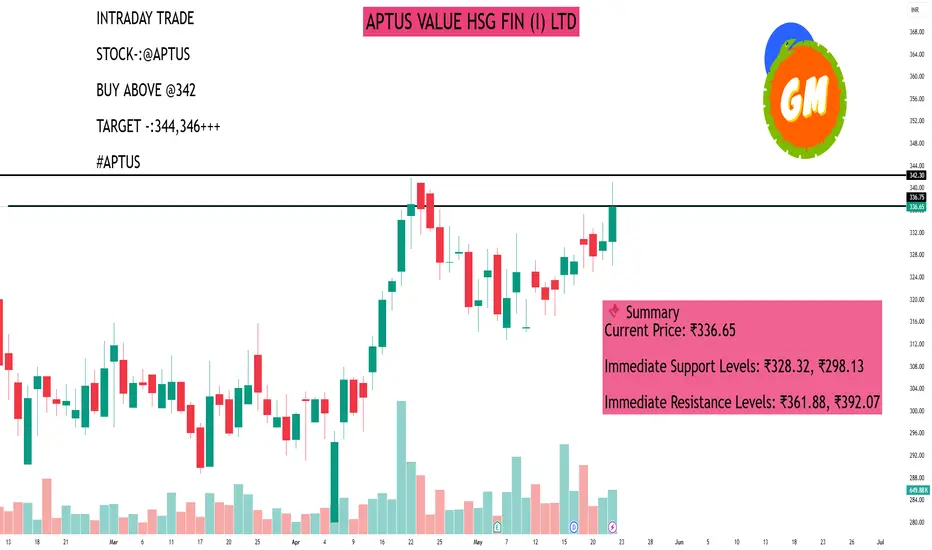
APTUS VALUE HSG FIN (I) LTDAs of May 22, 2025, Aptus Value Housing Finance India Ltd (NSE: APTUS) closed at ₹336.65, marking a 1.89% increase from the previous session.
📊 Daily Support and Resistance Levels
Based on technical analysis, the following support and resistance levels have been identified for Aptus Value Housing Finance India Ltd:
Classic Pivot Points:
Pivot Point: ₹328.32
Support Levels:
S1: ₹298.13
S2: ₹264.57
S3: ₹234.38
Resistance Levels:
R1: ₹361.88
R2: ₹392.07
R3: ₹425.63
Fibonacci Retracement Levels (from recent downtrend):
Resistance Levels:
23.6%: ₹319.49
38.2%: ₹323.75
50%: ₹327.20
61.8%: ₹330.65
76.4%: ₹334.91
📈 Technical Indicators Overview
Relative Strength Index (RSI): 43.56 (indicates a bearish trend)
Stochastic RSI: 11.05 (oversold condition)
MACD: 0.47 (bullish crossover)
Average Directional Index (ADX): 31.01 (indicates a strong trend)
Commodity Channel Index (CCI): -165.91 (suggests the stock is oversold)
📌 Summary
Current Price: ₹336.65
Immediate Support Levels: ₹328.32, ₹298.13
Immediate Resistance Levels: ₹361.88, ₹392.07
Given the current technical indicators and support/resistance levels, traders should exercise caution. Monitoring the stock's movement around these key levels can provide insights into potential trading opportunities. It's advisable to consider these technical factors in conjunction with broader market trends and fundamental analysis before making investment decisions.
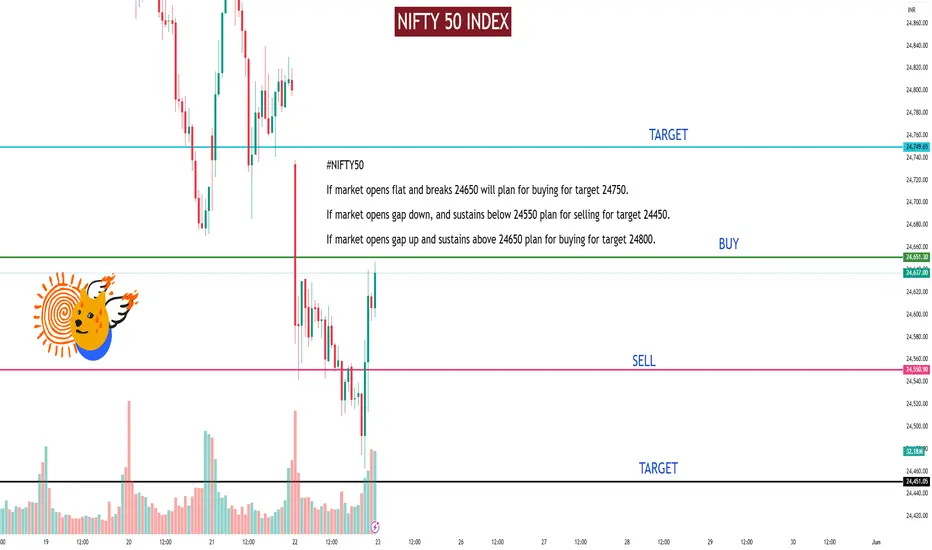
NIFTY 50 INDEXPre Market analysis for 23/05/2025
#NIFTY50
If market opens flat and breaks 24650 will plan for buying for target 24750.
If market opens gap down, and sustains below 24550 plan for selling for target 24450.
If market opens gap up and sustains above 24650 plan for buying for target 24800.
Disclaimer:-All views are my personal and only for educational purpose.
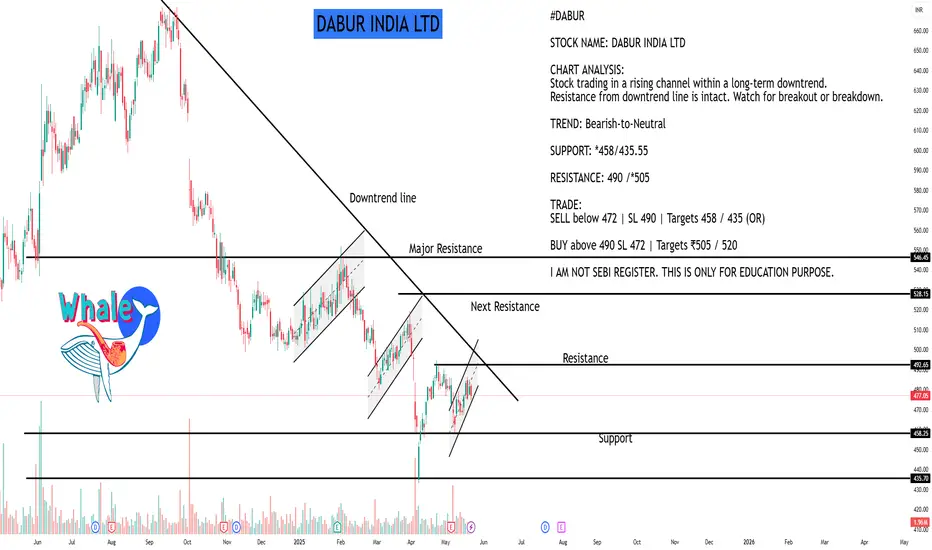
DABUR INDIA LTDAs of May 22, 2025, Dabur India Ltd (NSE: DABUR) closed at ₹477.05, reflecting a 0.98% decline from the previous session.
📊 Daily Support and Resistance Levels
Based on technical analysis, the following support and resistance levels have been identified for Dabur India Ltd:
Classic Pivot Points:
Pivot Point: ₹476.48
Support Levels:
S1: ₹474.61
S2: ₹473.23
S3: ₹471.36
Resistance Levels:
R1: ₹477.86
R2: ₹479.73
R3: ₹481.11
Additional Support and Resistance Levels:
Support: ₹470.28, ₹473.67, ₹478.38
Resistance: ₹481.77, ₹486.48, ₹489.87
📈 Technical Indicators Overview
The current technical indicators suggest a bearish outlook for Dabur India Ltd:
Relative Strength Index (RSI): 43.56 (indicates a bearish trend)
Stochastic RSI: 11.05 (oversold condition)
MACD: 0.47 (bullish crossover)
Average Directional Index (ADX): 31.01 (indicates a strong trend)
Commodity Channel Index (CCI): -165.91 (suggests the stock is oversold)
📌 Summary
Current Price: ₹477.05
Immediate Support Levels: ₹474.61, ₹473.23, ₹471.36
Immediate Resistance Levels: ₹477.86, ₹479.73, ₹481.11
Given the current technical indicators and support/resistance levels, traders should exercise caution. Monitoring the stock's movement around these key levels can provide insights into potential trading opportunities. It's advisable to consider these technical factors in conjunction with broader market trends and fundamental analysis before making investment decisions.
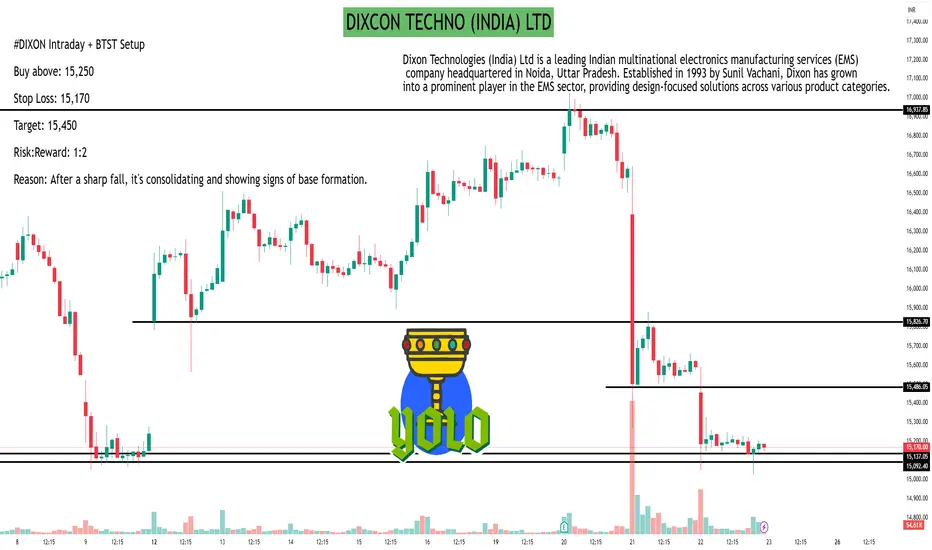
DIXCON TECHNO (INDIA) LTDAs of May 22, 2025, Dixon Technologies (India) Ltd (NSE: DIXON) closed at ₹15,170.00, reflecting a 2.84% decline from the previous close of ₹15,612.00.
30-Minute Support and Resistance Levels
Based on the 30-minute technical analysis, the following pivot points have been identified:
Classic Pivot Points:
Resistance Levels:
R1: ₹15,184.66
R2: ₹15,305.33
R3: ₹15,383.66
Support Levels:
S1: ₹14,985.66
S2: ₹14,907.33
S3: ₹14,786.66
Pivot Point: ₹15,106.33
Fibonacci Pivot Points:
Resistance Levels:
R1: ₹15,182.35
R2: ₹15,229.31
R3: ₹15,305.33
Support Levels:
S1: ₹15,030.31
S2: ₹14,983.35
S3: ₹14,907.33
Pivot Point: ₹15,106.33
Camarilla Pivot Points:
Resistance Levels:
R1: ₹15,082.24
R2: ₹15,100.48
R3: ₹15,118.73
Support Levels:
S1: ₹15,045.76
S2: ₹15,027.52
S3: ₹15,009.27
Pivot Point: ₹15,106.33
These levels can serve as reference points for intraday trading strategies.
Technical Indicators Overview
The current technical indicators suggest a bearish outlook:
Relative Strength Index (RSI): 30.31, indicating the stock is approaching oversold territory.
Moving Average Convergence Divergence (MACD): -311.32, signaling downward momentum.
Average Directional Index (ADX): 53.38, suggesting a strong trend.
Commodity Channel Index (CCI): -112.93, indicating a potential oversold condition.
Rate of Change (ROC): -8.43, reflecting negative momentum.
Bull/Bear Power: -681.10, emphasizing bearish dominance.
Overall, the technical analysis points to a strong sell signal.
Analyst Ratings
Analyst consensus on Dixon Technologies is mixed:
Strong Buy: 8 analysts
Buy: 8 analysts
Hold: 3 analysts
Sell: 6 analysts
Strong Sell: 1 analyst
This distribution indicates a cautious stance among analysts, with a notable number recommending buying the stock, while others advise selling.
Is Gold Set to Explode or Fake Out at 3400?GOLD PLAN 22/05 – TERROR ATTACK SHOCKS MARKETS | Is Gold Set to Explode or Fake Out at 3397?
Markets have just been hit by fresh geopolitical tension:
An Israeli diplomat was shot dead in Washington D.C. during a high-profile Jewish community event near the Holocaust Museum. The shooter allegedly shouted political slogans, and the FBI is now treating the case as a potential anti-Semitic terrorist act.
Former President Donald Trump called the event “disgusting” and urged the U.S. to stand strong against extremism.
🟡 This incident triggered a wave of risk aversion, pushing safe-haven assets like GOLD into the spotlight once again.
🌐 FUNDAMENTAL CONTEXT:
The USD remains under pressure due to weak U.S. economic data (housing, manufacturing, retail).
Despite the Fed’s “higher for longer” tone, markets are pricing in potential rate cuts by Q3.
Rising geopolitical tensions in the Middle East & U.S. soil may fuel further gold demand in the short term.
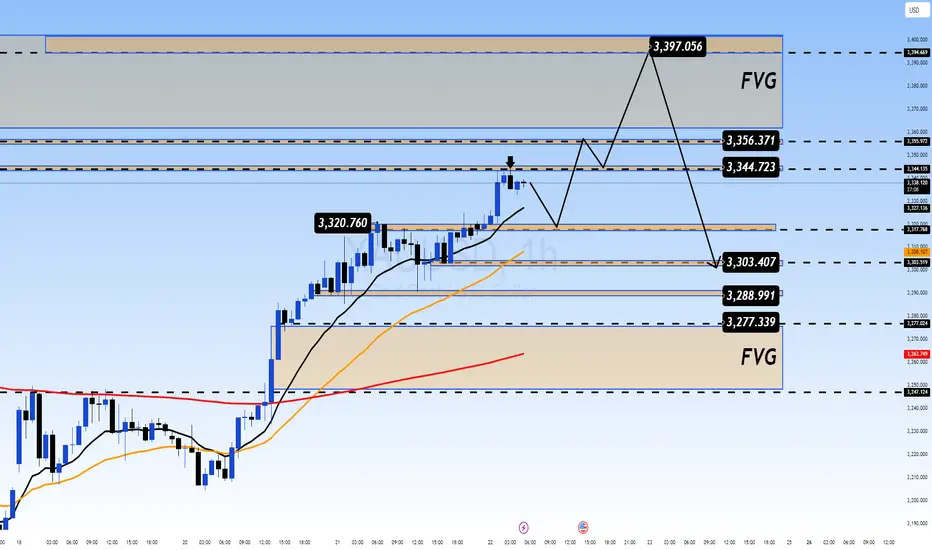
📈 TECHNICAL OUTLOOK (H1 Chart):
Price is nearing FVG resistance at 3395–3397, which could serve as a liquidity trap for breakout traders.
Key mid-zone resistance: 3344–3356, where price might stall or reverse if upward momentum weakens.
Strong support levels: 3303 – 3288 – 3277, aligned with previous structure and demand zones.
📌 TRADE PLAN:
Buy zone: 3296 - 3294
SL: 3290
TP: 3300 - 3304 - 3308 - 3315 - 3320 - 3330 - ???
Buy Scalp: 3316 - 3314
SL: 3310
TP: 3320 - 3324 - 3328 - 3332 - 3340 - 3350
Look for bullish reaction from the support zone and enter with proper risk management.
🔻 Sell zone: 3395 – 3397
SL: 3401
TP: 3390 - 3386 - 3380 - 3376 - 3370
🔻 Sell Scalp: 3358 - 3360
SL: 3364
TP: 3354 - 3350 - 3346 - 3342 - 3338 - 3330
If price spikes into FVG and shows exhaustion or bearish reversal, short setup is valid.
⚠️ Warning: Due to geopolitical headlines and gold trading near psychological resistance, expect high volatility and potential for traps.
🎯 Stick to your zones. Manage TP/SL properly. Do not chase price!
Gold Holding Strong New Highs Loading? After a solid rejection from the 3130–3160 major support zone, gold has shown real strength and bounced back above the 3280–3300 region, which was a key retracement level (0.5–0.618 Fib zone). Initially, I was expecting a deeper correction possibly towards the 3000 area, but price action has flipped the script. Bulls have stepped in strongly.
With the updated projection, we’re now looking at the following bullish path:
Updated Bullish Projection Path
Immediate resistance at 3436-40 (100% Fib extension)
Next targets:
ATH :3500
3520 – 1.272 Fib
3565 – 1.414 Fib
3628 – 1.618 Fib (Major extension target)
Major support to watch 3260-75 area
If price continues to respect the trendline and higher lows, this bullish momentum could stretch further....

The uptrend is being tested at the resistance of 3,305 USDAfter a strong recovery from the bottom around 3,140 USD, the world gold price is touching the important resistance zone at 3,305 USD/ounce in the trading session on May 21. On the 4H chart, the short-term uptrend is reinforced when the price breaks above the EMA 34 and EMA 89, creating a golden cross pattern - a sign that often signals the continuation of the uptrend.
However, the 3,305–3,325 area is currently acting as a short-term resistance - where many reversals have been recorded in the past. The price is showing signs of slowing down when approaching this area, with small candles and narrow bodies, indicating that buying power is temporarily slowing down.
If gold breaks and closes clearly above 3,325, the price will likely continue to move towards 3,375 and further to 3,400 USD. On the contrary, if the price fails to break above the current resistance zone and reverses, the support zone to watch is the confluence between EMA34 and EMA89 around 3,250–3,260.
With market sentiment still dominated by geopolitical factors and US credit risks, gold continues to maintain its safe-haven role. However, investors should monitor the price reaction at the 3,305 area to confirm the next momentum – whether it is a breakout or a technical correction.

Institution Trading Strategies part 5Institutional traders incorporate strategies that emphasize both long-term value and diversification in their trading practices. They leverage significant amounts of capital to build portfolios diversified across multiple assets, which helps reduce risk while seeking improved market prices.

Institution Trading part 4Institutional trading involves the buying and selling of large quantities of financial assets, typically conducted by institutional investors like hedge funds, mutual funds, and pension funds. These entities manage money for others and trade in securities, including stocks, bonds, and derivatives.

Support and Resistance part 2Support is a price point below the current market price that indicate buying interest. Resistance is a price point above the current market price that indicate selling interest. S&R can be used to identify targets for the trade. For a long trade, look for the immediate resistance level as the target.

FED HAWKISHNESS VS TECHNICAL FAIR VALUE GAPS – BIG MOVE COMING?GOLD PLAN 21/05 – FOMC HAWKISHNESS VS TECHNICAL FAIR VALUE GAPS – BIG MOVE COMING?
The recent surge in gold has paused just as traders digest the latest Federal Reserve signals. Despite rising geopolitical risks and weakening U.S. economic data, Fed officials continue to project a “higher-for-longer” rate stance, keeping the dollar afloat and adding pressure on gold’s rally.
📉 However, the technical structure tells another side of the story.
⚙️ TECHNICAL OUTLOOK: Bearish Trap or Hidden Bullish Opportunity?
On the 1H timeframe, XAU/USD is showing signs of consolidation after tapping into a major Fair Value Gap (FVG) around the 3328–3356 area. We now observe two key FVG zones above and below current price, highlighting high volatility and potential liquidity grabs.
🔍 A short-term bullish scenario is forming if gold retraces towards 3250–3252 support, where trendline confluence and dynamic support suggest strong demand.
Conversely, any strong rejection from 3354–3356 SELL ZONE could activate a bearish play back towards the lower structure levels.
💹 TRADE SETUPS FOR TODAY:
🔵 BUY ZONE:
Entry: 3252–3250
Stop Loss: 3246
Take Profit Targets:
3256 – 3260 – 3264 – 3268 – 3272 – 3280 – 3300 – ???
🔵 BUY SCALP:
Entry: 3277–3275
Stop Loss: 3272
Take Profit Targets:
3280 – 3284 – 3288 – 3292 – 3296 – 3300
🔻 SELL ZONE:
Entry: 3354–3356
Stop Loss: 3360
Take Profit Targets:
3350 – 3346 – 3342 – 3338 – 3334 – 3330 – 3320
🔻 SELL SCALP:
Entry: 3328–3330
Stop Loss: 3334
Take Profit Targets:
3324 – 3320 – 3316 – 3310 – 3305 – 3300
🌍 MACRO INSIGHT:
Fed’s hawkish tone is weighing on precious metals, but gold remains attractive under geopolitical uncertainty and de-dollarization trends.
China and other central banks continue their accumulation, suggesting long-term bullish pressure is intact.
Watch for U.S. data this week – especially PMI and jobless claims – which could provide short-term catalysts.
📌 Stay cautious and disciplined. Stick to your zones and manage risk tightly – volatility is increasing.
👉 If you found this useful, don’t forget to like, comment and follow for daily gold insights!

Basic to Advance Trading The very best way to get into trading is to find a platform you trust, learn as much as you can about trading beforehand and then practise to get your skill, technique and strategies right. Thereafter, all that remains to be done is to create a trading plan and open a live account.

Divergence Trading Divergence occurs when the stochastic oscillator's peaks or troughs disagree with the price. For instance, if the stochastic makes lower highs while the price is rising, it indicates a bearish divergence. Likewise, higher stochastic lows against lower price lows indicate a bullish divergence.
