No trades for now… letting gold show its next moveYesterday, gold closed above 3282 level, which we’ve been tracking closely as the 0.50 Fibonacci level from the 3440–3120 decline. This was a key technical level and with that break, I’ve closed all my short positions initiated from the 3385 area(with a good profit overall), as shared earlier.
With that exit, I’m currently flat and not holding any active positions.
From an intraday perspective, price is now inching toward the next resistance at 3319, which corresponds to the 0.618 Fib retracement a typical zone where reactions or pullbacks possible.
The trend has shifted from a clean corrective phase into a potential BIG RANGE CONSOLIDATION structure(for range we have to wait for weekly close confirmations)
I’ll wait for more clarity in price action near 3319–3345, and reassess if fresh selling opportunities or continuation setups emerge.I prefer to stay on the sidelines and observe how price behaves around the next resistance cluster before jumping into the next move.
M-forex

Put and Call RatioThe put-call ratio (PCR) is a technical indicator in options trading that reflects the overall sentiment of the market. It compares the volume of put options traded to the volume of call options traded. Put options give the holder the right to sell an asset at a specific price, while call options give the right to buy it.

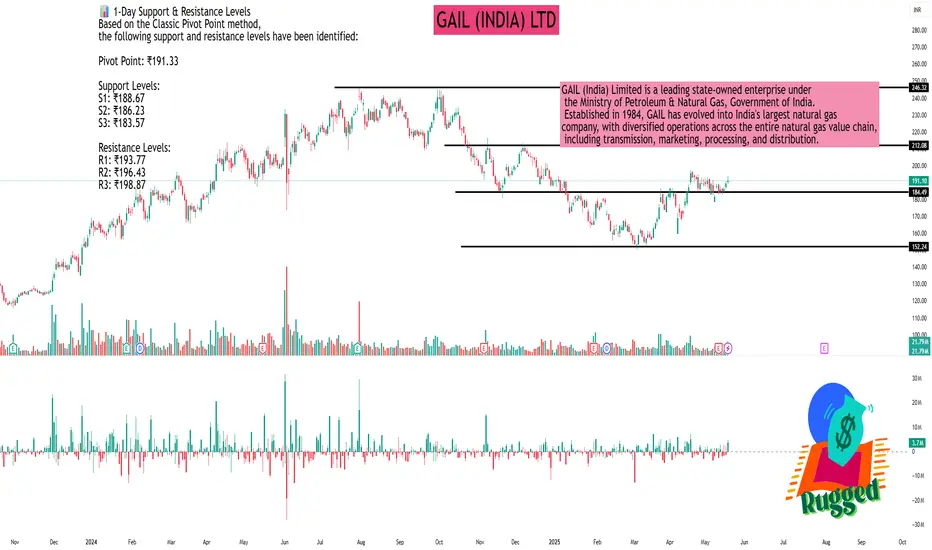
GAIL (INDIA) LTDAs of May 21, 2025, GAIL (India) Ltd. (NSE: GAIL) is trading at ₹191.10, reflecting a 0.86% increase from the previous close.
📊 1-Day Support & Resistance Levels
Based on the Classic Pivot Point method, the following support and resistance levels have been identified:
Pivot Point: ₹191.33
Support Levels:
S1: ₹188.67
S2: ₹186.23
S3: ₹183.57
Resistance Levels:
R1: ₹193.77
R2: ₹196.43
R3: ₹198.87
📈 Technical Indicators
Relative Strength Index (RSI): 60.63 – Indicates bullish momentum.
MACD (12,26): 1.34 – Suggests a bullish crossover.
Average Directional Index (ADX): 35.59 – Reflects a strong trend.
Commodity Channel Index (CCI): 48.46 – Neutral.
Rate of Change (ROC): 2.75 – Positive momentum.
Money Flow Index (MFI): Not specified.
📉 Moving Averages
50-day EMA: ₹226.29
200-day EMA: Not specified.
The current price is below the 50-day EMA, indicating a potential bearish trend in the short term.
🔍 Market Outlook
GAIL (India) Ltd. is exhibiting mixed signals. While technical indicators like RSI and MACD suggest bullish momentum, the stock trading below its 50-day EMA indicates caution. Traders should monitor the support and resistance levels closely; a breach above R1 (₹193.77) could indicate further upside, while a drop below S1 (₹188.67) might suggest a potential decline.
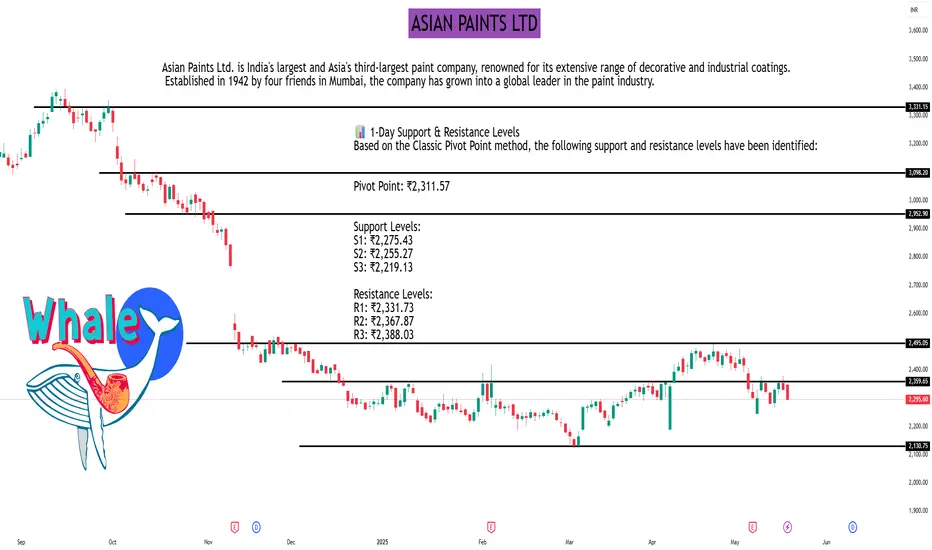
ASIAN PAINTS LTDAs of May 21, 2025, Asian Paints Ltd. (NSE: ASIANPAINT) closed at ₹2,295.60, reflecting a 1.54% decline from the previous day. The stock is currently trading approximately 32% below its 52-week high of ₹3,394.00, reached on September 16, 2024.
📊 1-Day Support & Resistance Levels
Based on the Classic Pivot Point method, the following support and resistance levels have been identified:
Pivot Point: ₹2,311.57
Support Levels:
S1: ₹2,275.43
S2: ₹2,255.27
S3: ₹2,219.13
Resistance Levels:
R1: ₹2,331.73
R2: ₹2,367.87
R3: ₹2,388.03
📈 Technical Indicators
Relative Strength Index (RSI): 41.88 – Indicates neutral momentum.
Moving Average Convergence Divergence (MACD): -15.56 – Suggests bearish momentum.
Average Directional Index (ADX): 17.09 – Reflects a weak trend strength.
Rate of Change (ROC): -5.80 – Points to a declining price momentum.
Money Flow Index (MFI): 29.47 – Indicates potential oversold conditions.
Supertrend: ₹2,468.26 – The current price is below this level, signaling a bearish trend.
📉 Moving Averages
50-day Simple Moving Average (SMA): ₹2,342.83
100-day SMA: ₹2,304.44
200-day SMA: ₹2,614.84
The current price is below all these moving averages, indicating a bearish outlook.
🔍 Market Outlook
Asian Paints Ltd. is exhibiting bearish signals across multiple technical indicators. The stock's position below key moving averages and a declining RSI suggest continued downward pressure. Traders should monitor the support levels closely; a breach below S1 (₹2,275.43) could indicate further downside, while a move above R1 (₹2,331.73) might suggest a potential reversal.
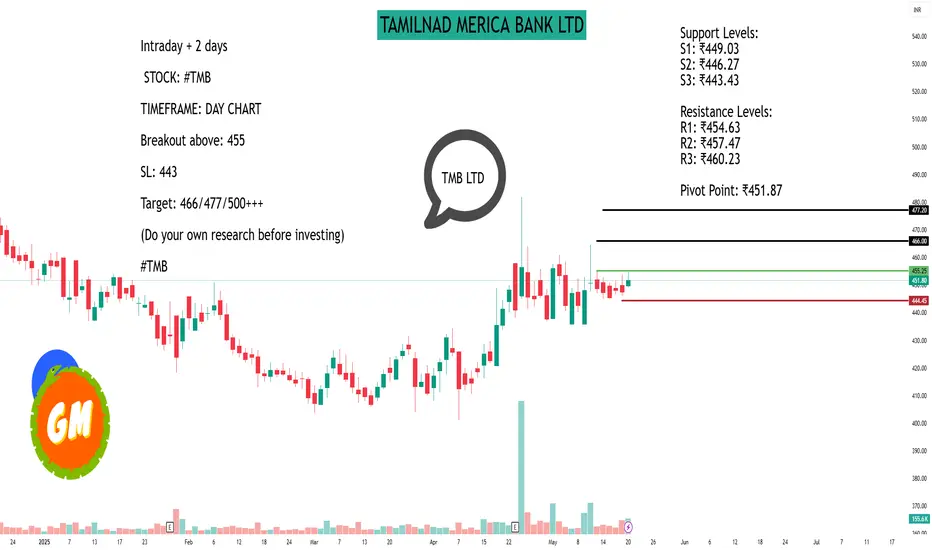
TAMILNAD MERICA BANK LTDAs of May 21, 2025, Tamilnad Mercantile Bank Ltd. (NSE: TMB) is trading at ₹451.80, reflecting a 0.97% increase over the previous day.
📊 1-Day Support & Resistance Levels (Classic Pivot Method)
Based on the previous trading day's price range, the following support and resistance levels have been identified:
Support Levels:
S1: ₹449.03
S2: ₹446.27
S3: ₹443.43
Resistance Levels:
R1: ₹454.63
R2: ₹457.47
R3: ₹460.23
Pivot Point: ₹451.87
📈 Technical Indicators
Moving Averages:
20-day EMA: ₹444.47
50-day EMA: ₹437.38
100-day EMA: ₹438.24
200-day EMA: ₹446.85
Oscillators:
Relative Strength Index (RSI 14): 58.01 (indicates uptrend)
Commodity Channel Index (CCI 14): 62.68 (indicates uptrend)
Money Flow Index (MFI): 74.25 (indicates strong uptrend)
🔍 Trading Insights
The current price is slightly below the pivot point, suggesting a neutral to slightly bullish stance. If the price moves above the pivot point, it may test the resistance levels. Conversely, a drop below the pivot could lead to testing the support levels.
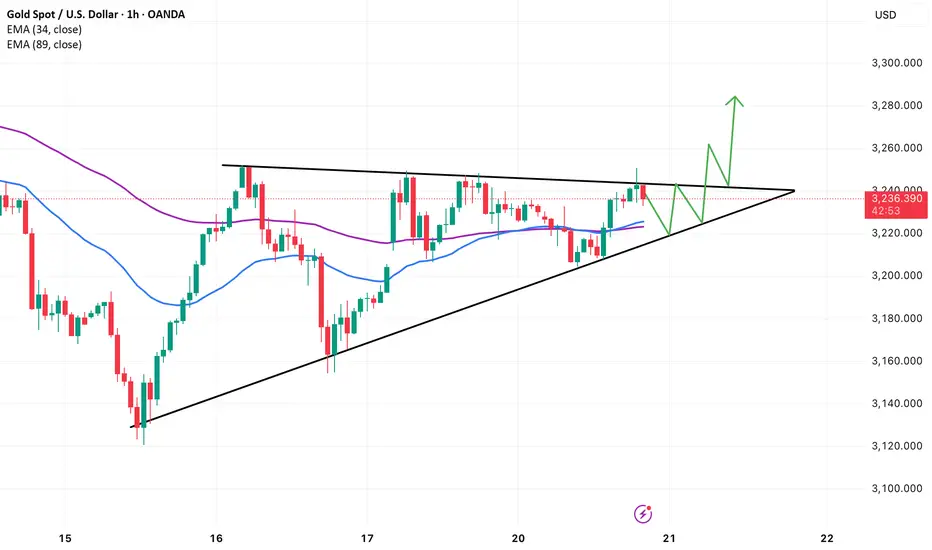
Gold breaks out of triangle patternThe world gold price has increased to 3,222 USD/ounce, continuing the strong recovery thanks to supportive factors from safe-haven sentiment. Moody's downgrade of the US long-term credit rating has fueled concerns about financial risks, while trade tensions due to the US Treasury Secretary's statement have further strengthened gold's position as a safe haven.
On the 1H chart, the price has just broken out of the ascending symmetrical triangle pattern - a technical structure that often signals the continuation of an uptrend. The breakout zone around 3,235 is currently acting as support. As long as the price holds above this zone, the possibility of gold continuing to move towards the target of 3,270–3,280 is quite high. In particular, the EMA34 and EMA89 lines are converging and preparing to create a short-term bullish crossover.
However, investors should note that if the price reverses and breaks through the bottom of the triangle (below 3,220), the bullish pattern will be negated, and the possibility of a bearish reversal will return. With the geopolitical and economic context still having many uncertainties, gold is holding the upper hand but still needs solid confirmation from price action after the breakout.
Management and Psychology Trading psychology refers to the emotional and mental state influencing a trader's decisions. It involves managing emotions like fear and greed, which can impact rational judgment and risk-taking, thus affecting trading outcomes. A disciplined mindset helps traders make logical decisions under pressure.

Institutional Level Trading part 3The buying and selling of financial assets are conducted by sizable entities, including banks, credit unions, pension funds, hedge funds, and mutual funds, in the process known as institutional trading.

GOLD MARKET UPDATE - BE READY FOR BIG MOVES!🔥 GOLD MARKET UPDATE – FED'S HAWKISH STANCE SHAKES INVESTORS | BE READY FOR BIG MOVES!
Gold experienced a sharp drop following the latest hawkish comments from the Federal Reserve, as they reaffirmed that current monetary conditions remain stable and tight. This has caused confusion and panic among many investors, leading to a wave of sell-offs during the U.S. and early Asia sessions.
📉 On the higher timeframes, Gold appears to be forming a bearish flag pattern – a classic consolidation structure before a potential continuation move. Despite the strong bullish momentum seen during the Asian and European sessions yesterday, the key resistance near 325x held firm, preventing any major breakout.
For now, Gold seems to be trapped in a new sideways range, and unless price decisively breaks above 325x, we may continue to see choppy price action within this zone.
⚠️ However, if the current selling momentum persists and the price breaks down below the lower trendline support, the bearish flag setup could play out, with up to 80% probability, signaling a potential strong continuation of the downtrend.
Traders should stay extremely alert – a major price movement could happen at any moment!
🔑 Key Support Levels:
3205
3294
3280
3262
🔑 Key Resistance Levels:
3244
3262
3278
3286
💹 Scalping Setup – BUY:
Entry: 3294–3292
Stop Loss: 3288
Take Profit Targets:
3298 – 3302 – 3306 – 3310 – 3315 – 3320 – 3330
🟢 BUY ZONE:
Entry: 3272–3270
Stop Loss: 3266
Take Profit Targets:
3276 – 3280 – 3284 – 3288 – 3292 – 3296 – 3330
🔻 Scalping Setup – SELL:
Entry: 3242–3244
Stop Loss: 3248
Take Profit Targets:
3238 – 3234 – 3230 – 3226 – 3220 – 3210
🔻 SELL Zone:
Entry: 3276–3278
Stop Loss: 3282
Take Profit Targets:
3272 – 3268 – 3264 – 3260 – 3250 – 3240
📌 Remember to always follow your TP/SL strategy to protect your capital!

Class for Advanced Trading part 2A trade advance, also known as a trade loan, is a form of financing that facilitates international trade by providing liquidity to businesses. It helps businesses manage their cash flow during international transactions by offering access to funds before or during the payment cycle.

Class for Advanced Trading Advanced trading strategies usually involve multiple technical indicators and more complicated instruments, such as options and futures.

MACD ( Moving Average Convergence Divergence)When To Use And How To Read The MACD Indicator - short for Moving Average Convergence Divergence, is a popular momentum indicator in technical analysis used to identify trends and potential reversals in stock prices. It's a tool that helps traders understand the strength, direction, and duration of a trend by analyzing the relationship between two moving averages.

Technical Conpet"Technical Concept" refers to a specialized knowledge or understanding of technical aspects, often within a particular field like engineering, computer science, or a specific industry. It's not a standardized term with a single, fixed meaning, but rather a concept that can be interpreted in various ways depending on the context.

Option TradingIn trading, an option is a contract that gives the holder the right, but not the obligation, to buy or sell an underlying asset (like a stock, ETF, or commodity) at a predetermined price (the strike price) before a specific date (the expiration date). There are two main types: call options (the right to buy) and put options (the right to sell).

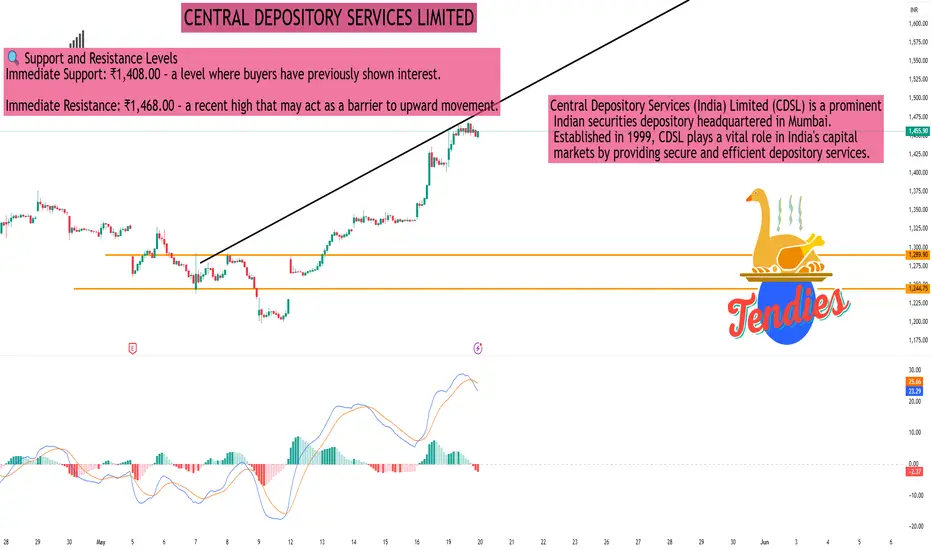
CENTRAL DEPOSITORY SERVICES LIMITEDAs of the close on Monday, May 19, 2025, Central Depository Services (India) Ltd (NSE: CDSL) was trading at ₹1,450.80, marking a 2.98% increase from the previous session.
📊 30-Minute Timeframe Technical Overview
Price Action:
Day's Range: ₹1,408.00 – ₹1,468.00
52-Week Range: ₹1,047.45 – ₹2,989.00
Volume: Approximately 9.5 million shares traded, indicating heightened market activity.
Technical Indicators:
Relative Strength Index (RSI): 69.89 – approaching overbought territory, suggesting caution.
Moving Average Convergence Divergence (MACD): 36.23 – indicating bullish momentum.
Average Directional Index (ADX): 16.44 – suggesting a weak trend strength.
Stochastic Oscillator: 80.92 – in the overbought zone, which may precede a price correction.
Indicator: ₹1,280.03 – acting as a support level.
Parabolic SAR (PSAR): ₹1,209.57 – indicating an upward trend.
🔍 Support and Resistance Levels
Immediate Support: ₹1,408.00 – a level where buyers have previously shown interest.
Immediate Resistance: ₹1,468.00 – a recent high that may act as a barrier to upward movement.
🔭 Outlook
The technical indicators suggest that CDSL is experiencing a strong bullish trend. However, the RSI and Stochastic Oscillator indicate that the stock is nearing overbought conditions, which could lead to a short-term consolidation or minor correction. Investors should monitor the support and resistance levels closely and consider the heightened trading volume, which may affect the strength of the current trend.
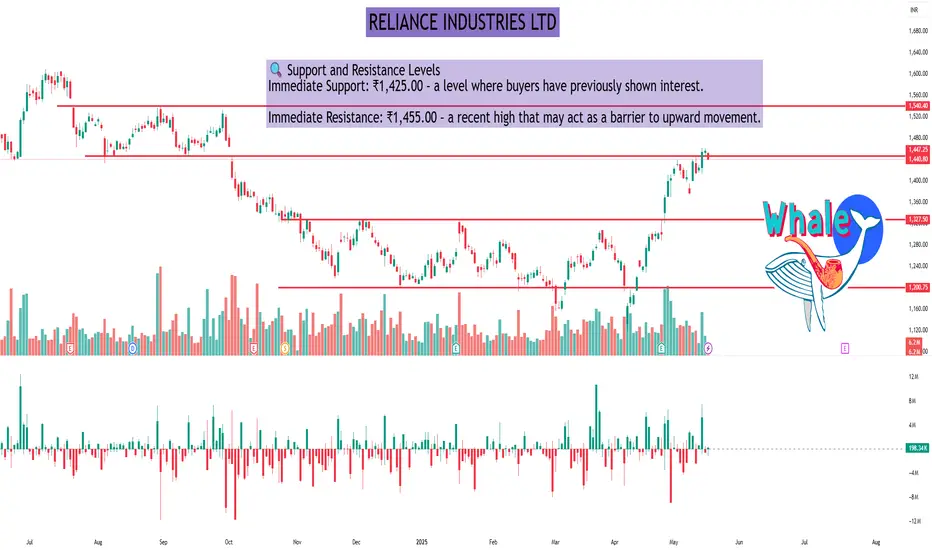
RELIANCE INDUSTRIES LTDAs of the close on Monday, May 19, 2025, Reliance Industries Ltd (NSE: RELIANCE) traded at ₹1,440.80, reflecting a 1.07% decrease from the previous session.
📊 Daily Technical Overview
Price Action:
Opening Price: ₹1,452.10
Day's Range: ₹1,438.20 – ₹1,454.60
52-Week Range: ₹1,114.85 – ₹1,608.80
Volume: Approximately 6.2 million shares traded, below the 50-day average of 8.4 million, indicating reduced market activity.
Technical Indicators:
Relative Strength Index (RSI): 69.84 – approaching overbought territory, suggesting caution.
Moving Average Convergence Divergence (MACD): Bullish crossover, indicating potential upward momentum.
Stochastic Oscillator: 76.17 – in the overbought zone, which may precede a price correction.
Average Directional Index (ADX): Indicates a strong trend, supporting the current price movement.
🔍 Support and Resistance Levels
Immediate Support: ₹1,425.00 – a level where buyers have previously shown interest.
Immediate Resistance: ₹1,455.00 – a recent high that may act as a barrier to upward movement.
🔭 Outlook
The technical indicators suggest that Reliance Industries Ltd is experiencing a strong bullish trend. However, the RSI and Stochastic Oscillator indicate that the stock is nearing overbought conditions, which could lead to a short-term consolidation or minor correction. Investors should monitor the support and resistance levels closely and consider the reduced trading volume, which may affect the strength of the current trend.
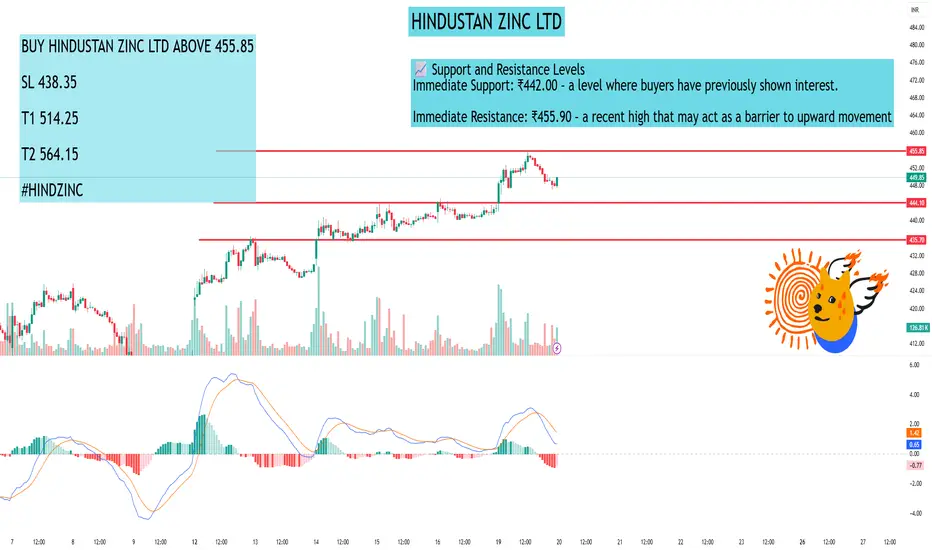
HINDUSTAN ZINC LTDAs of the close on Monday, May 19, 2025, Hindustan Zinc Ltd (NSE: HINDZINC) was trading at ₹448.20, reflecting a 1.33% increase from the previous session.
📊 15-Minute Timeframe Technical Overview
Analyzing the 15-minute chart, the stock exhibits a mild bullish trend:
Price Action: The current price is ₹428.25.
Moving Averages:
The 5-period Exponential Moving Average (EMA) is at ₹440.66.
The 15-period EMA stands at ₹435.01.
The 50-period EMA is at ₹435.91.
The 100-period EMA is at ₹446.19.
The 15-period EMA trending above the 50-period EMA indicates a bullish crossover.
Trend Analysis: The 5 and 15 EMAs are on an upward trajectory, suggesting a mild bullish sentiment in the short term.
🔍 Technical Indicators
Relative Strength Index (RSI): The RSI is approximately 56.70, indicating a neutral momentum without being overbought or oversold.
Moving Average Convergence Divergence (MACD): The MACD is at 0.811, suggesting a bullish crossover.
Average Directional Index (ADX): The ADX is at 13.22, indicating a weak trend strength.
Stochastic Oscillator: The Stochastic Oscillator is at 63.96, pointing to neutral momentum.
Indicator: The supertrend is at ₹406.99, acting as a support level.
Parabolic SAR (PSAR): The PSAR is at ₹400.77, indicating an upward trend.
📈 Support and Resistance Levels
Immediate Support: ₹442.00 – a level where buyers have previously shown interest.
Immediate Resistance: ₹455.90 – a recent high that may act as a barrier to upward movement.
🔭 Outlook
The current indicators suggest a cautious approach:
If the price sustains above ₹442.00, there may be potential for a rebound towards ₹455.90.
Conversely, a drop below ₹442.00 could lead to further declines, possibly testing lower support levels.
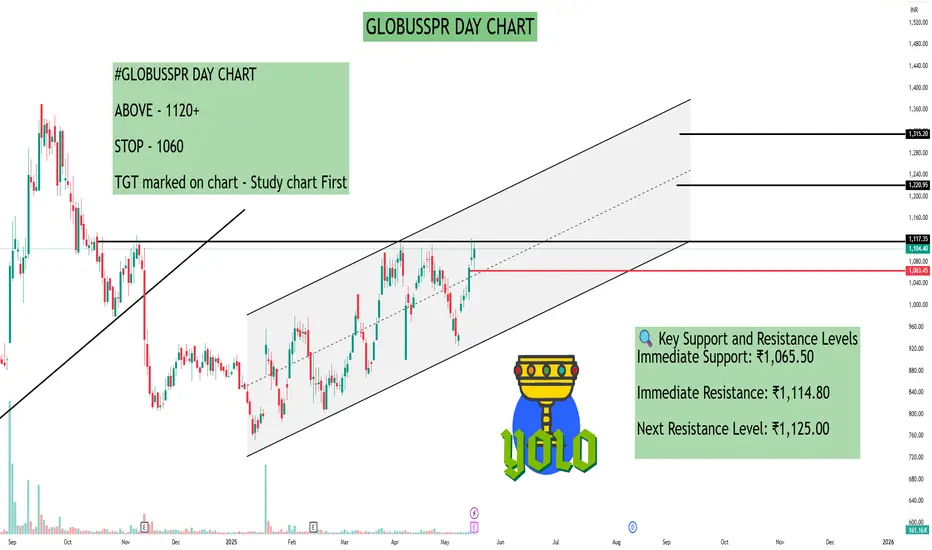
GLOBUSSPR DAY CHARTAs of the close on Monday, May 19, 2025, Globus Spirits Ltd (NSE: GLOBUSSPR) traded at ₹1,104.40, reflecting a 1.62% increase from the previous session.
📊 Daily Technical Overview
Price Action:
Day's Range: ₹1,065.50 – ₹1,114.80
52-Week Range: ₹670.00 – ₹1,369.75
Volume: 161,165 shares traded
Technical Indicators:
Relative Strength Index (RSI): 61.68 – indicating neutral to slightly bullish momentum.
Moving Average Convergence Divergence (MACD): 6.03 – suggesting a bullish crossover.
Average Directional Index (ADX): 15.29 – indicating a weak trend strength.
Stochastic Oscillator: 62.44 – pointing to neutral momentum.
Indicator: ₹957.02 – acting as a support level.
Parabolic SAR (PSAR): ₹927.02 – indicating an upward trend.
🔍 Key Support and Resistance Levels
Immediate Support: ₹1,065.50
Immediate Resistance: ₹1,114.80
Next Resistance Level: ₹1,125.00
📈 Outlook
The technical indicators suggest that Globus Spirits Ltd is experiencing a mild bullish trend. The RSI and MACD indicate positive momentum, while the ADX suggests that the trend strength is currently weak. If the stock maintains its position above the immediate support level of ₹1,065.50, it may attempt to break through the resistance at ₹1,114.80. A successful breakout could lead to testing the next resistance level at ₹1,125.00.
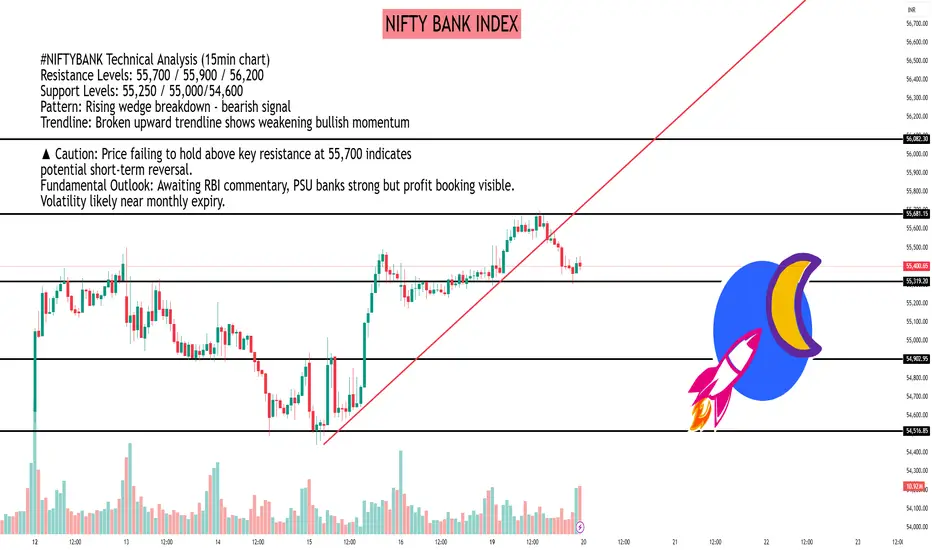
NIFTY BANK INDEX #NIFTYBANK Technical Analysis (15min chart)
Resistance Levels: 55,700 / 55,900 / 56,200
Support Levels: 55,250 / 55,000/54,600
Pattern: Rising wedge breakdown - bearish signal
Trendline: Broken upward trendline shows weakening bullish momentum
▲ Caution: Price failing to hold above key resistance at 55,700 indicates
potential short-term reversal.
Fundamental Outlook: Awaiting RBI commentary, PSU banks strong but profit booking visible. Volatility likely near monthly expiry.
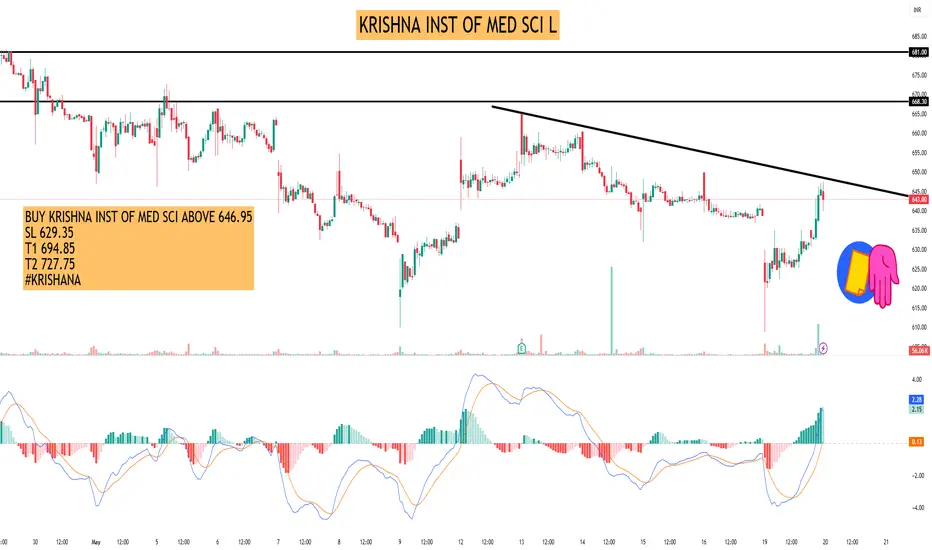
KRISHNA INST OF MED SCI LAs of the close on Monday, May 19, 2025, Krishna Institute of Medical Sciences Ltd (NSE: KIMS) traded at ₹645.10, marking a 0.75% increase from the previous session.
📊 15-Minute Timeframe Technical Overview
Analyzing the 15-minute chart, the stock exhibits a mild bearish trend:
Price Action: The current price is ₹535.65.
Moving Averages:
The 5-period Weighted Moving Average (WMA) is at ₹535.65.
The 15-period WMA stands at ₹536.93.
The 100-period WMA is at ₹542.10.
The 15-period WMA trending below the 100-period WMA indicates a bearish crossover.
Trend Analysis: Both the 5 and 15 WMAs are on a downward trajectory, suggesting a mild bearish sentiment in the short term.
🔍 Technical Indicators
Relative Strength Index (RSI): The 14-day RSI is approximately 54.7, indicating a neutral momentum without being overbought or oversold.
Volume: The trading volume is around 507,339 shares, significantly higher than the 20-day average of 91,758 shares, pointing to increased market activity.
📈 Support and Resistance Levels
Support: ₹640.00 – a level where buyers have previously shown interest.
Resistance: ₹650.00 – a recent high that may act as a barrier to upward movement.
🔭 Outlook
The current indicators suggest a cautious approach:
If the price sustains above ₹640.00, there may be potential for a rebound towards ₹650.00.
Conversely, a drop below ₹640.00 could lead to further declines, possibly testing lower support levels.
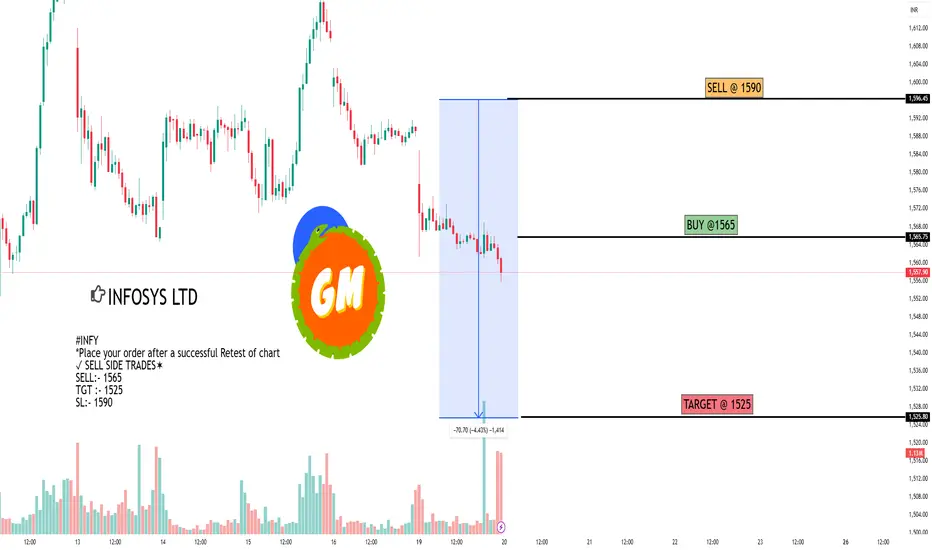
INFOSYS LTDAs of the close on Monday, May 19, 2025, Infosys Ltd (NSE: INFY) traded at ₹1,559.80, reflecting a decrease of ₹30.10 or 1.89% from the previous session.
In the 15-minute timeframe, the stock exhibited a downward trend throughout the day, with prices ranging between ₹1,555.70 and ₹1,585.00.
Technical Indicators (15-Minute Timeframe):
Moving Averages: The 20-period Exponential Moving Average (EMA) is trending downward, indicating short-term bearish momentum.
Relative Strength Index (RSI): The RSI is hovering around 45, suggesting that the stock is approaching oversold territory but hasn't reached it yet.
Support Levels: Immediate support is observed around ₹1,550, with a stronger support level near ₹1,540.
Resistance Levels: The stock faces resistance at ₹1,570, followed by a more significant resistance near ₹1,585.
Outlook:
If Infosys maintains its position above the ₹1,550 support level, a short-term rebound towards ₹1,570 is possible. However, a break below ₹1,550 could lead to further declines, potentially testing the ₹1,540 support.
Beware of short-term bull trapsOn the H4 chart, gold is testing an important resistance zone around EMA89 (purple) after a rebound from the bottom of 3,120. However, both EMA34 and EMA89 are sloping down, indicating that the short-term trend is still bearish. The current rebound is not strong enough to confirm a reversal.
The most recent candle also has a long upper shadow, indicating that selling pressure is waiting above. If the price is rejected at the 3,250–3,260 zone and turns around to break down to 3,220, there is a high possibility that gold will retest the old bottom around 3,120.
The strategy at this time is to stay out or wait to sell lightly if a clear reversal signal appears near the resistance zone. Avoid FOMO because the rebound has not been confirmed by volume or trend structure.

Support and Resistance part 1In stock market technical analysis, support and resistance are certain predetermined levels of the price of a security at which it is thought that the price will tend to stop and reverse. These levels are denoted by multiple touches of price without a breakthrough of the level.
