Learn Institutional Level Trading part 6The buying and selling of financial assets are conducted by sizable entities, including banks, credit unions, pension funds, hedge funds, and mutual funds, in the process known as institutional trading.
M-forex

MACD part 2Moving average convergence/divergence (MACD) is a technical indicator to help investors identify price trends, measure trend momentum, and identify entry points for buying or selling. Moving average convergence/divergence (MACD) is a trend-following momentum indicator that shows the relationship between two exponential moving averages (EMAs) of a security’s price. MACD was developed in the 1970s by Gerald Appel, and is one of the most popular technical tools, readily available on most trading platforms offered by online stock brokers.

What is Moving Average Convergence Divergence (MACD) ?The Moving Average Convergence Divergence (MACD) is a momentum indicator used in technical analysis to identify changes in the strength, direction, momentum, and duration of a trend in a stock or other asset's price. It's essentially a bar chart that visually displays the relationship between two moving averages of a price series.

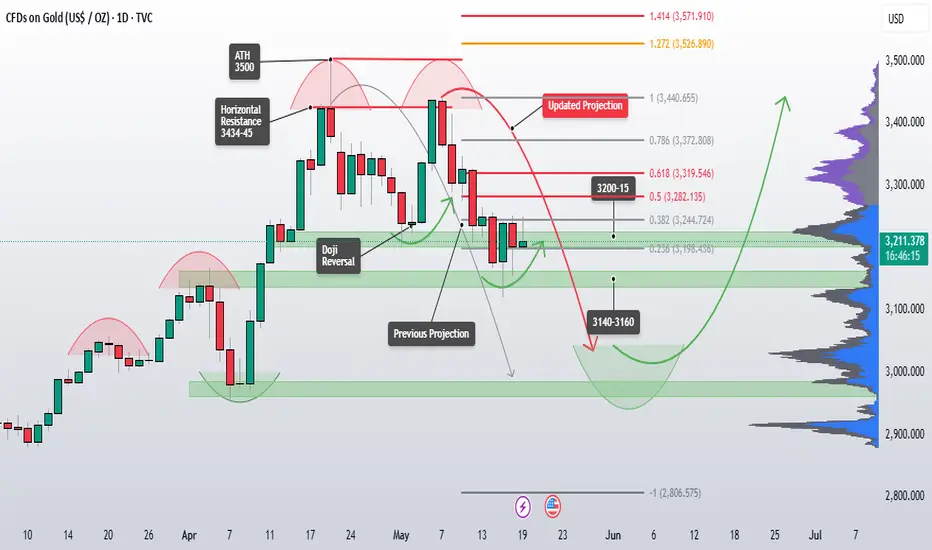
Gold Holding Above 3200… But Is the Rebound Real?Gold followed through on our previous expectation, bouncing from the 3140–3160 support zone after briefly tagging a low near 3120. From there, bulls regained some control and managed to reclaim the 3200 level, which we’ve been watching closely. Although last week’s close was above 3200, I still consider this move a corrective bounce, not a confirmed reversal.
The key level I’m watching now is 3282, which aligns with the 50% Fibonacci retracement of the recent decline from 3440 to 3120. Until price decisively closes above this zone, I’ll continue to treat this as a pullback within a broader correection/downtrend and hold onto a portion of my short positions.
If bulls manage to break and hold above 3282, we could start seeing signs of a short-term trend shift toward higher resistance zones like 3350 or beyond. However, as long as price stays below 3282, the risk remains for another move back below 3200 and if that happens, a revisit of the 3140–3120 support zone is very much on the table. and if that support break, our previous bearish targets come back into focus.
So for now, I’m still leaning toward downside continuation unless the market proves otherwise by reclaiming key resistance with strength.
GOLD DAILY PLAN MAY 19: IS THIS THE START OF A MASSIVE BULLISH GOLD DAILY PLAN – MAY 20: IS THIS THE START OF A MASSIVE BULLISH RUN?
Gold opened the new trading week with a powerful GAP UP of over 20 USD, followed by an additional 50 USD rally during the Asia session. This explosive move is being fueled by geopolitical tensions and macroeconomic uncertainty, setting the tone for what could be a highly volatile and profitable week for gold traders.
🔥 Key Fundamental Drivers Behind This Gold Rally:
1️⃣ Putin rejects peace talks – Increased war risks reignite gold’s safe-haven appeal.
2️⃣ U.S. credit rating downgraded – Rising debt and bond yields are pushing investors back to gold.
3️⃣ Trump threatens new trade tariffs – Even a softer version of “Trade War 2.0” could shock global markets, making gold a top hedge.
➡️ With no clear resolutions in sight, gold may soon retest the all-time high of $3,500.
🧠 Technical Analysis: Bullish Signals Are Confirming
EMA13 has crossed above EMA34 and EMA200 on the M30 chart — a classic reversal confirmation.
The main trendline was broken, and price is now retesting the breakout zone.
Momentum remains strong, and price structure is shifting bullish. Priority is now to BUY the dips rather than sell counter-trend.
📌 Key Price Levels to Watch:
🔺 Resistance Zones:
3254 – 3277 – 3288
(If price breaks above 3287, we may quickly see a move toward 3350–3500.)
🔻 Support Zones:
3204 – 3193 – 3186 – 3174 – 3163
(Best areas to watch for confirmation to BUY.)
🎯 Suggested Trade Ideas:
BUY Zone: 3186 - 3184
Stop-Loss (SL): 3180
Take-Profit (TP): 3190 → 3195 → 3200 → 3210 → 3220 → 3230
BUY Scalp: 3194 - 3192
Stop-loss: 3189
Take-Profit: 3200 - 3204 - 3210 - 3215 - 3220
SELL Zone: 3287 - 3289 Only scalp or take quick profits near resistance zones
Stop-Loss (SL): 3293
Take-Profit (TP): 3285 → 3280 → 3285 → 3280 → 3270
(Note: Avoid holding SELLs, only scalp on strong bearish signals.)
⚠️ Trading Notes:
Market is highly sensitive to geopolitical headlines. One comment from Trump or Putin could move gold 50–100 USD in minutes.
No need to chase price. Let it come to your zones — and only enter on clear confirmations.
📌 Summary:
✅ Structure has turned bullish across M30 and H4.
✅ Focus on buying dips, not shorting into strength.
✅ Medium-term target zones: 3350 → 3400 → 3500, depending on continued macro pressure.
📣 Follow AD for live trading plans, market sentiment, and smart entry zones every session!
Good luck & stay disciplined.

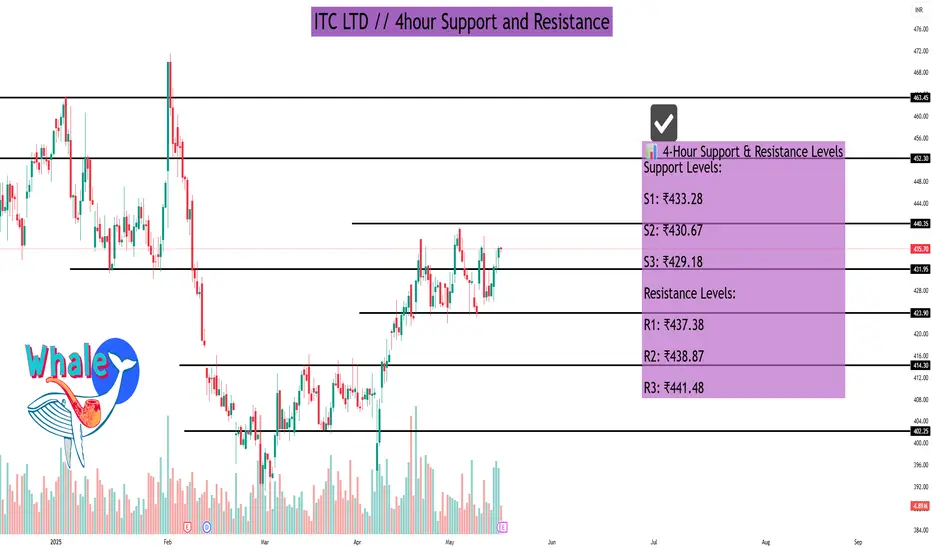
ITC LTD As of May 16, 2025, ITC Ltd. (NSE: ITC) is trading around ₹435.70. Analyzing the 4-hour timeframe, the following support and resistance levels have been identified based on various technical indicators:
📊 4-Hour Support & Resistance Levels
Support Levels:
S1: ₹433.28
S2: ₹430.67
S3: ₹429.18
Resistance Levels:
R1: ₹437.38
R2: ₹438.87
R3: ₹441.48
These levels are derived from pivot point calculations and can serve as potential areas where the price might experience support or resistance.
🔍 Technical Indicators Overview
Relative Strength Index (RSI): 58.98 – Indicates neutral momentum.
Moving Average Convergence Divergence (MACD): 3.86 – Suggests mild bullish momentum.
Average Directional Index (ADX): 17.89 – Points to a weak trend strength.
Stochastic Oscillator: 51.37 – Reflects neutral conditions.
Supertrend Indicator: ₹413.32 – Below current price, indicating a bullish signal.
Parabolic SAR: ₹437.35 – Slightly above current price, suggesting potential resistance.
📈 Fibonacci Retracement Levels
Considering the downtrend from ₹491.00 (Jan 3, 2025) to ₹390.15 (Apr 7, 2025), the key Fibonacci retracement levels are:
23.6%: ₹413.95
38.2%: ₹428.67
50%: ₹440.57
61.8%: ₹452.48
76.4%: ₹467.20
These levels can act as potential support or resistance zones as the price retraces its previous move.
🧠 Trading Insights
The current price is approaching the R1 resistance level at ₹437.38.
If the price breaks above this level with strong volume, it may test higher resistance levels.
Conversely, if it fails to break through, it might retrace to the support levels mentioned above.
Traders should monitor these levels closely and consider using stop-loss orders to manage risk.
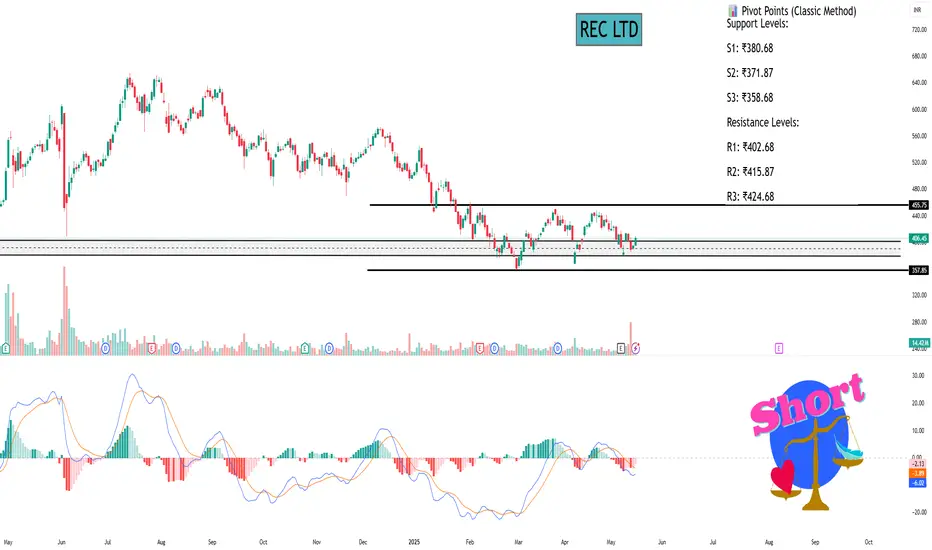
REC LTDAs of May 16, 2025, REC Ltd. (NSE: RECLTD) demonstrated a positive movement on the daily chart, with the stock closing at ₹406.45, marking a 3.07% increase from the previous close of ₹394.35. The day's trading range spanned from a low of ₹395.10 to a high of ₹409.65, with a substantial trading volume of approximately 14.4 million shares, indicating heightened investor interest.
📈 Technical Indicators (Daily Timeframe)
Relative Strength Index (RSI): 53.25 – Positioned in the neutral zone, suggesting neither overbought nor oversold conditions.
Moving Average Convergence Divergence (MACD): 0.37 – A positive value indicating bullish momentum, albeit modest.
Money Flow Index (MFI): 58.15 – Reflects moderate buying pressure, aligning with the day's positive price movement.
Average Directional Index (ADX): 31.99 – Suggests a developing trend strength, which traders should monitor for potential continuation or reversal.
Stochastic Oscillator (20,3): Approximately 55–80 – Indicates a bullish condition, but approaching overbought territory, warranting caution.
Commodity Channel Index (CCI): Positive territory – Signifies that the stock is trading above its average price, supporting the bullish outlook.
📊 Pivot Points (Classic Method)
Support Levels:
S1: ₹380.68
S2: ₹371.87
S3: ₹358.68
Resistance Levels:
R1: ₹402.68
R2: ₹415.87
R3: ₹424.68
The stock's closing price is above the first resistance level (R1), suggesting potential to test higher resistance levels if bullish momentum continues.
🔍 Trend Analysis
Recent technical assessments indicate that REC Ltd. may be entering a critical phase. A head and shoulders pattern was identified on the daily chart, with a breakout observed on March 19, 2024. This pattern typically signals a potential reversal, and the breakout was accompanied by increased trading volume and a bearish signal on the MACD indicator. Currently, the RSI is at a low level, and sustained momentum from the breakout may lead to further downward movement.
⚠️ Investor Considerations
Volatility: The stock has a beta of approximately 2.01, indicating higher volatility compared to the broader market.
Valuation Metrics:
P/E Ratio: 6.74 – Suggests the stock is trading at a relatively low multiple compared to the industry average.
P/B Ratio: 1.35 – Indicates a reasonable valuation in terms of book value.
Dividend Yield: 4.43% – Reflects a strong return to shareholders.
52-Week Range: ₹127.40 – ₹654.00 – The current price is significantly below the 52-week high, offering potential upside if the stock rebounds.
📌 Summary
REC Ltd.'s recent price action and technical indicators suggest a cautiously optimistic outlook. While the stock has shown a positive movement, the presence of a head and shoulders pattern and other technical signals warrant careful monitoring. Investors should watch for confirmation of trend continuation or reversal, particularly around the identified support and resistance levels.
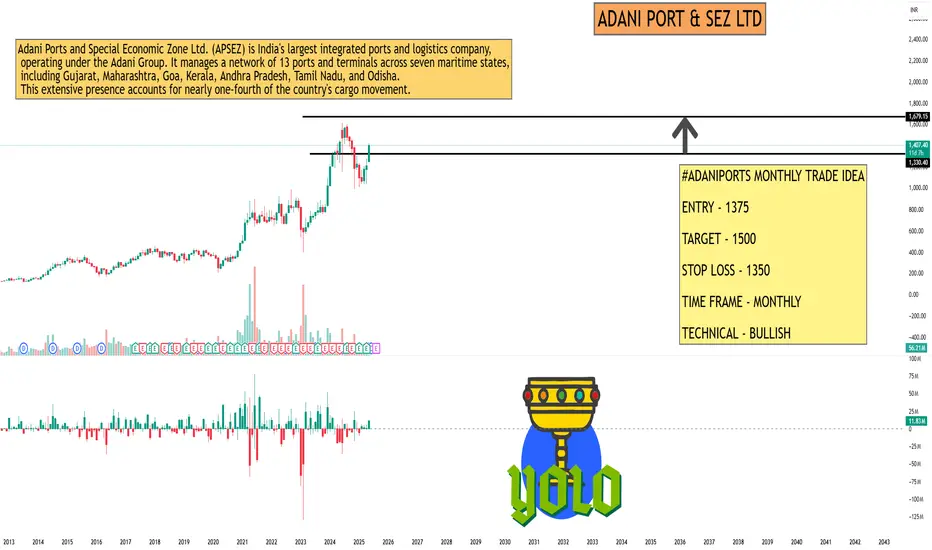
ADANI PORT & SEZ LTDAs of May 16, 2025, Adani Ports and Special Economic Zone Ltd. (NSE: ADANIPORTS) continues to exhibit a bullish trend on the monthly timeframe, supported by key technical indicators and significant price movements.
📊 Monthly Technical Overview
Current Price: ₹1,407.40
1-Month Gain: +16.31%
52-Week Range: ₹703.00 – ₹1,621.40
All-Time High: ₹1,621.40 (June 3, 2024)
📈 Key Technical Indicators
Relative Strength Index (RSI): 68.19 – Approaching overbought territory, indicating strong buying momentum.
MACD: +6.97 – Positive value suggests bullish momentum.
Stochastic Oscillator: 88.40 – In overbought zone, which may signal a potential pullback.
Commodity Channel Index (CCI): 252.86 – Indicates the stock is overbought.
Williams %R: -19.29 – Also suggests overbought conditions.
Average Directional Index (ADX): 16.45 – Points to a weak trend strength, implying that while the trend is upward, it may not be strongly established.
🧮 Moving Averages
10-Day EMA: ₹235.52
20-Day EMA: ₹229.64
50-Day EMA: ₹220.86
100-Day EMA: ₹222.11
200-Day EMA: ₹244.28
The current price is trading well above all key EMAs, reinforcing the bullish outlook.
📌 Pivot Points (Classic Method)
Support Levels:
S1: ₹239.67
S2: ₹233.63
S3: ₹229.72
Resistance Levels:
R1: ₹249.62
R2: ₹253.53
R3: ₹259.57
The stock is nearing R1, and a breakout above this could lead to testing R2 and R3.
💡 Summary
Adani Ports & SEZ Ltd. demonstrates strong bullish momentum on the monthly timeframe, trading above key moving averages and supported by high trading volumes. However, several indicators suggest overbought conditions, which may lead to short-term consolidation or a minor pullback. Investors should monitor the stock's movement around the ₹1,407–₹1,621 range for potential resistance and watch for confirmation before making new entries.
Bharat Heavy Electricals LtdAs of May 16, 2025, Bharat Heavy Electricals Ltd. (BHEL) exhibited a strong bullish trend on the daily chart, supported by various technical indicators.
📊 Daily Technical Overview
Closing Price: ₹250.35
Day’s Range: ₹244.16 – ₹259.99
Volume: ~50.24 million shares, significantly higher than the 20-day average of ~12.66 million shares, indicating strong trading activity.
📈 Key Technical Indicators
Relative Strength Index (RSI): 68.19 – Approaching overbought territory, suggesting strong buying momentum.
MACD: 6.97 – Indicates bullish momentum.
Stochastic Oscillator: 88.40 – In overbought zone, which may signal a potential pullback.
Commodity Channel Index (CCI): 252.86 – Suggests the stock is overbought.
Williams %R: -19.29 – Also indicates overbought conditions.
Average Directional Index (ADX): 16.45 – Points to a weak trend strength, implying that while the trend is upward, it may not be strongly established.
🧭 Moving Averages
Short-Term:
10-Day EMA: ₹235.52
20-Day EMA: ₹229.64
Medium-Term:
50-Day EMA: ₹220.86
100-Day EMA: ₹222.11
Long-Term:
200-Day EMA: ₹244.28
The current price is above all these moving averages, reinforcing the bullish outlook.
TipRanks
🔍 Pivot Points (Classic Method)
Support Levels:
S1: ₹239.67
S2: ₹233.63
S3: ₹229.72
Resistance Levels:
R1: ₹249.62
R2: ₹253.53
R3: ₹259.57
The stock is nearing R1, and a breakout above this could lead to testing R2 and R3.
📌 Summary
BHEL's stock demonstrates strong bullish momentum, trading above key moving averages and supported by high trading volumes. However, several indicators suggest overbought conditions, which may lead to short-term consolidation or a minor pullback. Investors should monitor the stock's movement around the ₹250–₹260 range for potential resistance and watch for confirmation before making new entries.

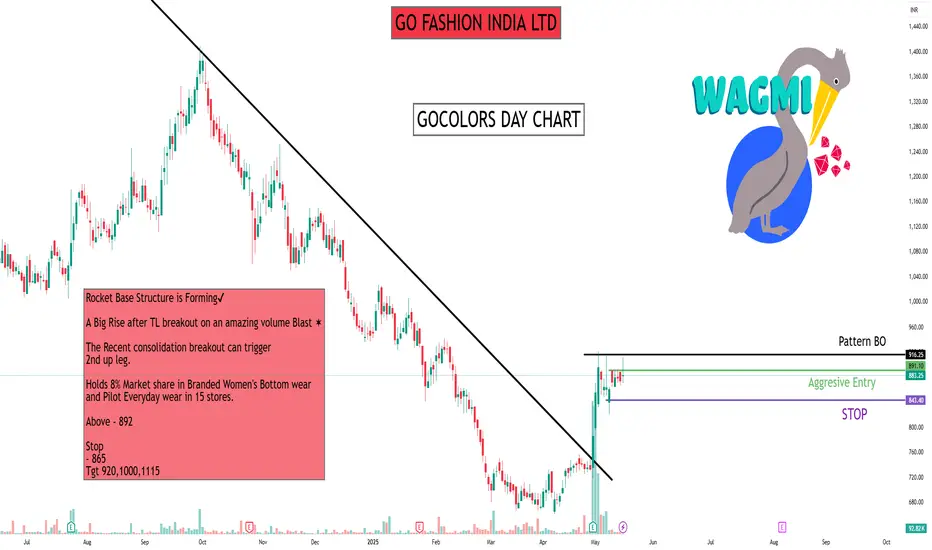
GO FASHION INDIA LTDGo Fashion (India) Ltd., operating under the brand name Go Colors, is a prominent Indian apparel company specializing in women's bottom-wear. Established in 2010 and headquartered in Chennai, Tamil Nadu, the company has carved a niche in the fashion industry by focusing exclusively on this segment.
#GOCOLORS DAY CHART -
Rocket Base Structure is Forming✔
A Big Rise after TL breakout on an amazing volume Blast ✶
The Recent consolidation breakout can trigger
2nd up leg.
Holds 8% Market share in Branded Women's Bottom wear and Pilot Everyday wear in 15 stores.
Above - 892
Stop
- 865
Tgt 920,1000,1115
Keep learning happy trading
SUZLON ENERGY LTDSUZLON
This is not a buy or sell recommendation only for educational purposes and I am not a SEBI registered.
Entry: Above 61.2 on monthly breakout.
Target: 61.5-65.45-70.20-72.25-82.35-86.4
If closed above 87 on monthly candle can touch 90-100
Stoploss: 58
Suzlon Energy Limited, a prominent player in India's renewable energy sector, has demonstrated significant operational progress in recent quarters. However, certain financial metrics and market dynamics warrant a cautious approach.
Financial Performance Overview
Revenue and Profitability:
In Q3 FY25, Suzlon reported a revenue of ₹2,969 crore, marking a 91% increase year-over-year. EBITDA more than doubled to ₹500 crore, with an EBITDA margin of 16.8%.
Despite this quarterly growth, the FY24 annual report indicates a 77.1% decline in net profit year-over-year, with net profit margins decreasing from 48.4% in FY23 to 10.1% in FY24.
Balance Sheet and Debt Position:
Suzlon has made strides in deleveraging, with total liabilities decreasing by 26.34% to ₹32.59 billion in 2024. Cash and short-term investments increased by 18.48% to 4.35 billion.
The debt-to-equity ratio stands at a conservative 0.06, indicating a strong balance sheet position.
Return Metrics:
Return on Capital Employed (ROCE) is reported at 24%, surpassing the industry average of 18%.
Return on Equity (ROE) is projected to improve to 28.6% by FY27.
Operational Highlights
Order Book and Capacity Expansion:
As of May 2024, Suzlon's order book expanded to 3.3 GW, a significant increase from 652 MW in FY23.
Notable contracts include a 402 MW project with Juniper Green Energy and a 551.25 MW project for the Aditya Birla Group.
Technological Advancements:
The $144 wind turbine, with a hub height of 160 meters, is India's tallest and delivers 40-43% higher generation than previous models.
▲ Risks and Considerations
Valuation Concerns:
The stock's P/E ratio stands at 64.94, which is higher than industry peers like Vestas (25.3) and Siemens Gamesa (18.7), suggesting potential overvaluation.
Market Volatility:
The stock experienced a 40% decline from its 52-week high, attributed to market- wide corrections and profit-booking after a substantial rally.
Corporate Governance:
The resignation of a key managerial person and warnings from NSE and BSE over regulatory non-compliance have raised concerns about corporate governance.
Insider Activity and Market Sentiment
There is no publicly available information confirming insider trading or undisclosed material events related to Suzlon Energy. However, the company's recent performance and strategic initiatives have garnered positive attention from investors and analysts.
Conclusion
Suzlon Energy exhibits strong operational momentum, a robust order book, and technological innovation in the renewable energy sector. While financial metrics show improvement, valuation concerns and corporate governance issues necessitate a cautious investment approach. Investors should monitor the company's execution of its order book, adherence to regulatory norms, and market dynamics closely.

GOLD Pullback or Bull Trap? This Move for the WEEK⚡️Will the Recovery Hold or Just a Retest Before Another Drop?
🧠 Macro Backdrop:
Geopolitical tension: US-China trade headlines and Russia-Ukraine negotiations continue to stir uncertainty, but risk appetite is still cautious.
US CPI and PPI data this week came in weaker than expected → inflation remains soft, but no signal yet for immediate rate cuts from the Fed.
Gold has been under pressure for 2 weeks but may be stabilizing as DXY loses steam and equity markets show hesitation.
🔍 Technical Outlook (Chart: M30–H1):
Gold is forming a rising wedge within a broader corrective pattern. Yesterday’s rebound from the 3,163 zone has pushed price back above the 20 EMA (black) and is testing the 3,208–3,210 zone.
This area is key for today: breakout or rejection?
🔑 Key Levels to Watch:
🔺 Resistance:
3,221 → Local structure neckline
3,235 → Previous supply + Fibo confluence
3,251 → Strong upper bound resistance
🔻 Support:
3,184 → Minor support (demand block)
3,173 → Swing low (key reaction zone)
3,163 → Final line of defense
📈 Trade Scenarios:
⚠️ Scenario A – Bullish Push Above 3,221:
If price breaks and holds above 3,221, we may see a bullish continuation to 3,235 and even 3,251.
Momentum confirmation: Price must stay above 3,210 on pullbacks.
🔹 Entry: 3,222 – 3,224
🔹 SL: 3,216
🔹 TP: 3,235 → 3,251
⚠️ Scenario B – False Break & Bearish Rejection:
If price fails to hold above 3,221 and reverses below 3,208 → potential short opportunity targeting lower liquidity zones.
🔻 Entry: 3,220 – 3,218 (after rejection)
🔻 SL: 3,228
🔻 TP: 3,184 → 3,173 → 3,163
⚠️ Scenario C – Range Play:
If price remains between 3,208 and 3,184, scalp inside the range and wait for breakout confirmation.
💬 Follow for real-time setups and live strategy updates during major market sessions.

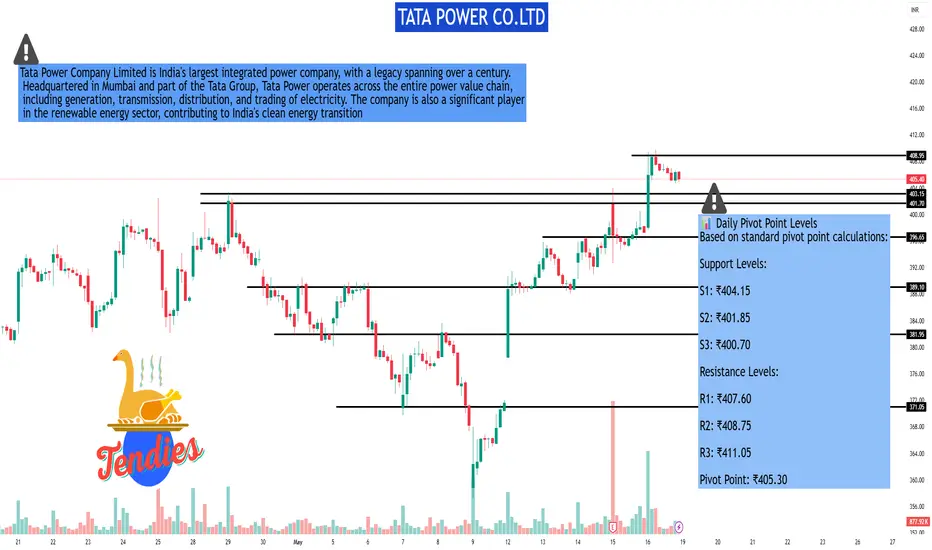
TATA POWER CO.LTDAs of May 16, 2025, Tata Power Co. Ltd. (NSE: TATAPOWER) closed at ₹405.80, marking a 1.97% increase for the day.
📊 45-Minute Timeframe Technical Analysis
Analyzing the 45-minute chart provides insights into the stock's short-term movements.
📈 Moving Averages
50 EMA: ₹350.38
200 EMA: ₹355.60
Signal: The 50 EMA is below the 200 EMA, indicating a mild bearish trend.
📈 Simple Moving Averages (SMA)
15 SMA: ₹358.10
50 SMA: ₹344.82
Signal: The 15 SMA is above the 50 SMA, suggesting a mild bullish trend.
🔍 Summary
Current Price: ₹405.80
Short-Term Trend: Mixed signals with a mild bearish indication from EMA crossover and a mild bullish indication from SMA crossover.
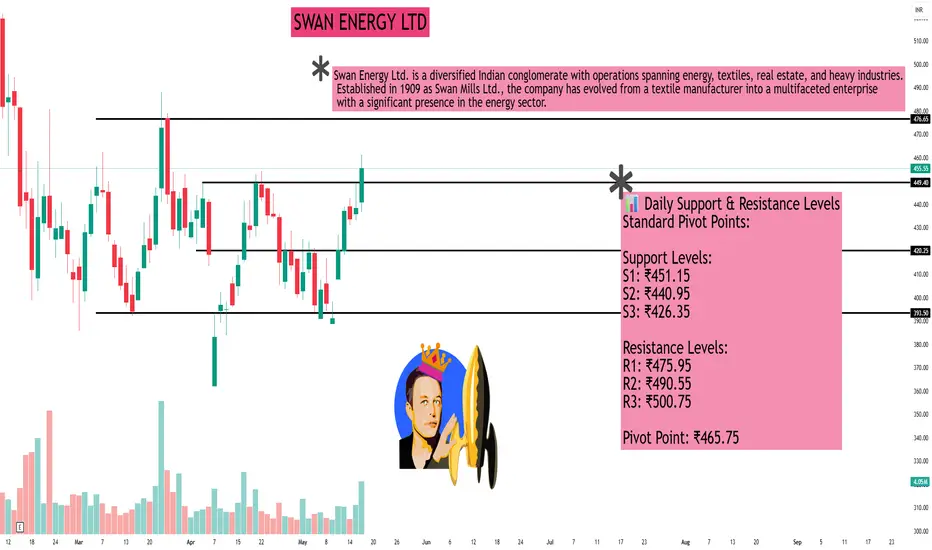
SWAN ENERGY LTDAs of the close on May 16, 2025, Swan Energy Ltd. (NSE: SWANENERGY) ended the trading day at ₹455.00. Based on daily technical analysis and pivot point calculations, here are the key support and resistance levels to consider:
📊 Daily Support & Resistance Levels
Standard Pivot Points:
Support Levels:
S1: ₹451.15
S2: ₹440.95
S3: ₹426.35
Resistance Levels:
R1: ₹475.95
R2: ₹490.55
R3: ₹500.75
Pivot Point: ₹465.75
Fibonacci Retracement Levels (from recent downtrend):
Support Levels:
23.6%: ₹391.87
38.2%: ₹410.22
50%: ₹425.05
61.8%: ₹439.88
76.4%: ₹458.23
Resistance Levels:
23.6%: ₹425.88
38.2%: ₹407.53
50%: ₹392.70
61.8%: ₹377.87
76.4%: ₹359.52
Accumulated Volume Support & Resistance:
Support Levels:
S1: ₹442.45
S2: ₹434.55
S3: ₹430.25
Resistance Level:
R1: ₹472.85
📈 Technical Indicators Overview
Relative Strength Index (RSI): 72.385 (indicates overbought conditions)
MACD: 7.690 (suggests bullish momentum)
5-Day Moving Average: ₹448.94
50-Day Moving Average: ₹424.67
These indicators suggest that while the stock is currently experiencing bullish momentum, the RSI indicates it may be overbought, which could lead to a short-term pullback.
🔍 Trading Insights
The immediate support level at ₹442.45 is crucial; a break below this could signal further downside.
On the upside, resistance at ₹472.85 is significant; a break above this could indicate continued bullish momentum.
Given the current RSI and MACD readings, traders should exercise caution and monitor for potential reversals or consolidations.
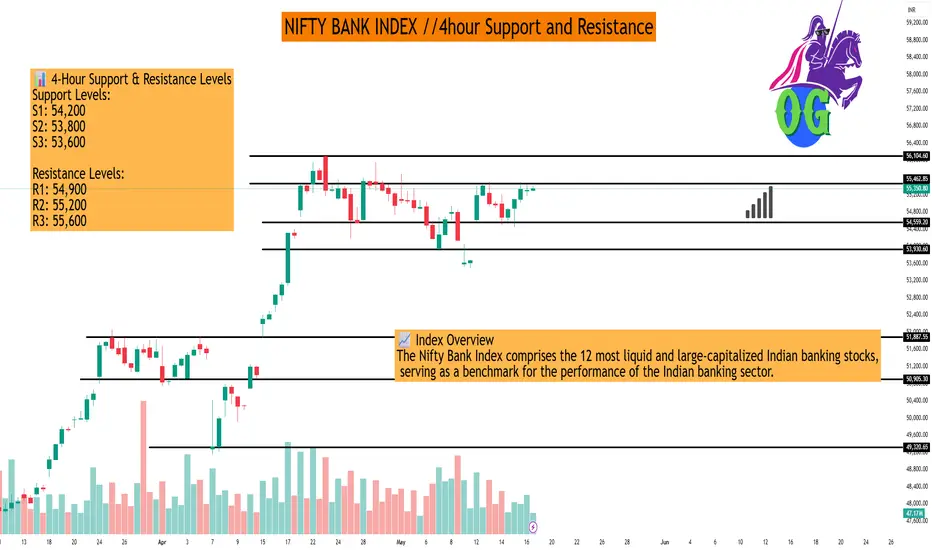
NIFTY BANK INDEX //4hour Support and ResistanceAs of May 17, 2025, here are the key 4-hour support and resistance levels for the Nifty Bank Index (BANKNIFTY), based on recent technical analyses:
📊 4-Hour Support & Resistance Levels
Support Levels:
S1: 54,200
S2: 53,800
S3: 53,600
Resistance Levels:
R1: 54,900
R2: 55,200
R3: 55,600
These levels are derived from recent price actions and technical indicators, indicating potential zones where the index might find buying or selling pressure.
📈 Exponential Moving Averages (EMA) on 4-Hour Chart
EMA 50: 54,750
EMA 100: 54,400
EMA 200: 54,000
EMA 400: 53,600
These EMAs can act as dynamic support or resistance levels, providing insights into the index's short to medium-term trend.
🔍 Technical Outlook
Trend: The 4-hour timeframe indicates a bullish trend, with the index trading above key EMAs.
Momentum Indicators: Indicators such as RSI and MACD suggest positive momentum, supporting the bullish outlook.
Price Action: The index has recently bounced from the 54,500 support zone, indicating buying interest at lower levels.
📌 Summary
Immediate Support: 54,200
Immediate Resistance: 54,900
Trend: Bullish on 4-hour timeframe
Traders should monitor these levels closely, as a break above resistance could signal further upside, while a drop below support might indicate a potential reversal or consolidation.
If you need more detailed analysis or information on specific indicators, feel free to ask!
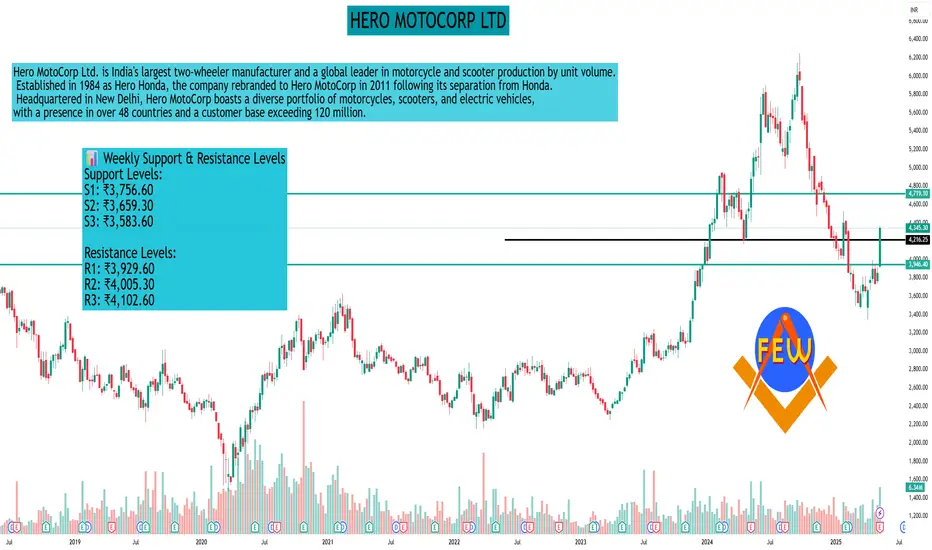
HERO MOTOCORP LTDAs of the week ending May 16, 2025, Hero MotoCorp Ltd. (NSE: HEROMOTOCO) closed at ₹3,853.90. Based on weekly technical analysis, here are the key support and resistance levels to consider for the upcoming week (May 19–23, 2025):
📊 Weekly Support & Resistance Levels
Support Levels:
S1: ₹3,756.60
S2: ₹3,659.30
S3: ₹3,583.60
Resistance Levels:
R1: ₹3,929.60
R2: ₹4,005.30
R3: ₹4,102.60
These levels are derived from standard pivot point calculations and can serve as potential zones where the stock might experience buying or selling pressure.
🔍 Technical Outlook
Immediate Support: A close below ₹3,756.60 may indicate further downside potential, with the next support at ₹3,659.30.
Immediate Resistance: A close above ₹3,929.60 could signal bullish momentum, targeting ₹4,005.30 and ₹4,102.60 subsequently.
Traders should monitor these levels closely, as breaches can indicate potential trend reversals or continuations.
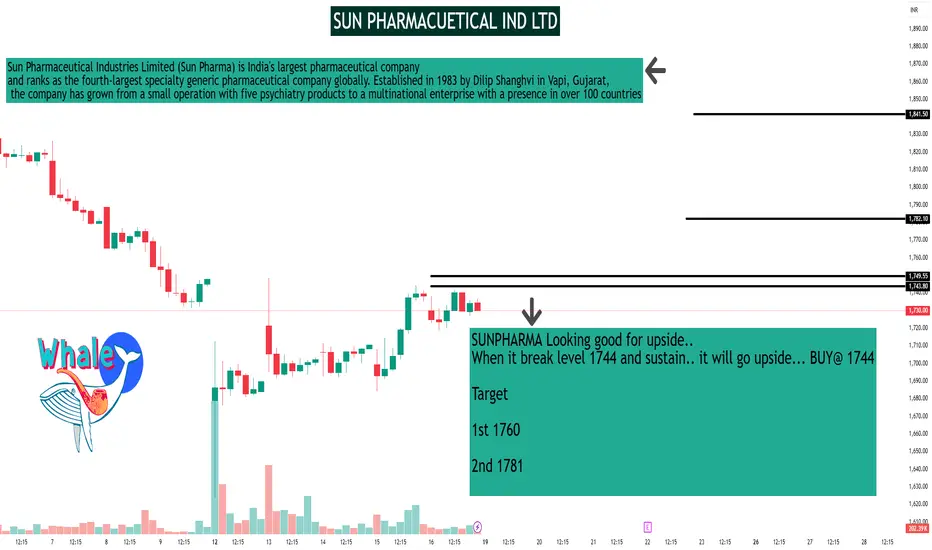
SUN PHARMACUETICAL IND LTDSUN PHARMACEUTICAL IND L
SUNPHARMA THR
SWING TRADE
- EARN WITH ME DAILY 10K-20K -
SUNPHARMA Looking good for upside..
When it break level 1744 and sustain.. it will go upside... BUY@ 1744
Target
1st 1760
2nd 1781
FNO
SUNPHARMA MAY FUT - LOT 9 (Qty-3150)
SUNPHARMA MAY 1740 CE - LOT 9 (Qty-3150)
Enjoy trading traders.. Keep add this STOCK in your watch list..
Big Investor are welcome..
Like this Post??? Hit like button..!!!
Follow me for FREE Educational Post and Alert..
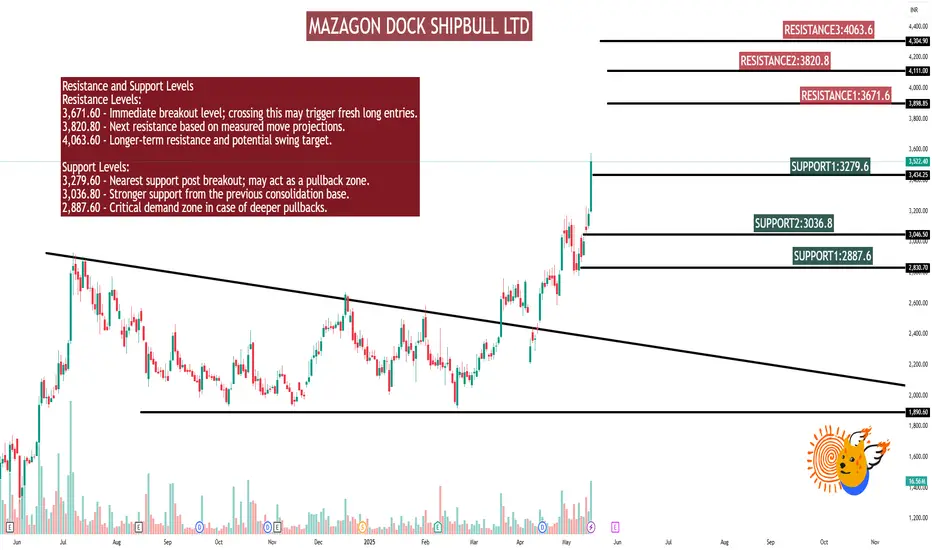
MAZAGON DOCK SHIPBULL LTDMAZAGON DOCK SHIPBUIL LTD
Technical Analysis & Breakout Insights
Mazagon Dock Shipbuilders Ltd. - Technical Analysis & Breakout Insights
Date: May 16, 2025
Exchange: NSE
Current Market Price (CMP): 3,522.40
% Change: +10.68% | Volume: 16.56M
Price Action Summary
Mazagon Dock witnessed a powerful bullish rally with a close near the day's high, registering a 10.68% gain on extremely high volume. This signals a high-conviction breakout above previous resistances, with the stock clocking a fresh 52-week high and exhibiting signs of strong institutional participation.
Chart Pattern & Indicator Insights
20-Day Volume Breakout: Volume (16.56M) > 2x 20-day avg (6.7M) - strong accumulation.
52-Week High: Breaks annual high - bullish continuation signal.
Multi-Breakout Confluence: RSI, Bollinger Band breakout & BB squeeze-off- confirms explosive momentum.
Strong Bullish Candle: Big green candle closing near high - aggressive buying, minimal profit booking.
Bullish Momentum Cluster
Strong bullish momentum with RSI breakout
Swing trade candidate with intraday & short-term potential
Bollinger Band breakout + BB squeeze-off
Ideal for buy today, sell tomorrow setup
High probability trend continuation
Resistance and Support Levels
Resistance Levels:
3,671.60 - Immediate breakout level; crossing this may trigger fresh long entries.
3,820.80 - Next resistance based on measured move projections.
4,063.60 - Longer-term resistance and potential swing target.
Support Levels:
3,279.60 - Nearest support post breakout; may act as a pullback zone.
3,036.80 - Stronger support from the previous consolidation base.
2,887.60 - Critical demand zone in case of deeper pullbacks.
Educational Insights: How to Trade Mazagon Dock
Between July 2023 and March 2025, the stock was in a descending triangle or a contracting range, forming lower highs (red descending trendline) and finding support around 1920 levels (horizontal red line). This shows accumulation or consolidation after a strong uptrend.
Inside the range, a W-shaped structure (marked in blue) is visible. This is often a bullish reversal pattern, especially when it breaks out with strong volume, which happened around March-April 2025. A decisive breakout above the descending resistance trendline occurred with a spike in volume. Price has since rallied from around 3200 levels to the levels of 3500 (+10.68% today), indicating strong bullish momentum.
Volume Analysis: Notice the huge green volume bar on the breakout day (May 16, 2025), indicating strong buying interest and institutional participation. Volume buildup had already started increasing in late April, supporting the breakout.
Technical Observations: The stock shows signs of a strong uptrend following a breakout from a long-term consolidation zone. Based on previous price structure, the 2,600-2,400 range may act as a potential support area, where price had earlier faced resistance.
PCR Trading Strategy The Put-Call Ratio (PCR) is a popular trading strategy that analyzes the ratio of put options to call options traded in the market, providing insights into market sentiment and potential price movements. It's a contrarian indicator, meaning that when the PCR is very high, it might suggest a bearish sentiment that could be followed by a price increase, and vice versa. Traders use the PCR to identify potential reversals and anticipate changes in market direction.

Institution Trading Strategy part 5Institutional traders, including high-frequency trading (HFT) firms, hedge funds, proprietary trading firms, and buy-side institutions, leverage sophisticated strategies powered by algorithmic trading and API automation to gain an edge in financial markets.

Institution Trading part 4Institutional trading is the buying and selling of financial assets by large organizations or institutions, such as pension funds, mutual funds, and insurance companies, on behalf of their clients or members. These institutions often manage large pools of capital, making them significant players in the financial markets.

What is Divergence ??In trading, divergence refers to a situation where the price action of an asset and a technical indicator move in opposite directions, suggesting a potential trend reversal or weakening trend. This discrepancy between price and indicator readings can be a signal for traders to anticipate a shift in momentum.

Technical Class 1Technical analysis is based on the fundamental idea that the price of a security moves in patterns or trends. Another essential assumption is that all fundamental considerations are reflected in the security price, which is a core concept of technical stock research.
