What is Divergence ??In trading, divergence refers to a situation where the price action of an asset and a technical indicator move in opposite directions, suggesting a potential trend reversal or weakening trend. This discrepancy between price and indicator readings can be a signal for traders to anticipate a shift in momentum.
M-forex

Technical Class 1Technical analysis is based on the fundamental idea that the price of a security moves in patterns or trends. Another essential assumption is that all fundamental considerations are reflected in the security price, which is a core concept of technical stock research.

Technical Concept A "technical concept" refers to a term or idea that has a specific, often specialized, meaning within a particular field or discipline, especially in technology or engineering. These concepts are often used to describe complex systems, processes, or principles. They can be fundamental to understanding a field or be more specific, like a particular algorithm or software library.

GOLD OUTLOOK – MAY 16: MARKET TRAP OR LEGITIMATE RECOVERY?GOLD OUTLOOK – MAY 17: MARKET TRAP OR LEGITIMATE RECOVERY?
Gold is closing out the week with unpredictable volatility, following two extreme sessions where prices dropped over 100 pips, only to rebound aggressively. Are recent news headlines just justifying the price action, or is this a well-orchestrated market trap?
🔍 Technical Breakdown (D1 & H4)
On the daily and 4-hour charts, we can clearly see a sharp breakdown, followed by an immediate rebound into the 325x area.
🎯 Key Level to Watch: 3254 – 3256
If price remains below 3256, sellers continue to dominate.
If 3256 is broken to the upside, we could see a quick move toward 327x–328x.
This zone acts as a decisive barrier between continuation and reversal.
🌐 Macro Perspective – Market Triggers
US inflation data continues to disappoint, weakening the USD and halting DXY recovery.
US-China tensions flare up again after short-lived optimism, especially around tariff talks and rare earth restrictions.
With mixed geopolitical cues, this market is prone to fakeouts and liquidity sweeps, especially ahead of the weekend.
📌 Key Levels to Monitor
🔺 Resistance Zones: 3237 – 3251 – 3261 – 3276 – 3287
🔻 Support Zones: 3205 – 3188 – 3170 – 3143
🎯 Trading Plan
🔵 BUY SCALP:
Entry: 3172 – 3170
SL: 3166
TP: 3176 → 3180 → 3184 → 3188 → 3192 → 3200
🔵 BUY ZONE:
Entry: 3142 – 3140
SL: 3136
TP: 3146 → 3150 → 3154 → 3158 → 3170 → 3180 → 3190
🔴 SELL SCALP:
Entry: 3160 – 3162
SL: 3166
TP: 3156 → 3152 → 3148 → 3144 → 3140 → 3130
🔴 SELL ZONE:
Entry: 3276 – 3278
SL: 3282
TP: 3272 → 3268 → 3264 → 3260 → 3255 → 3240
⚠️ Key Notes:
Friday sessions often bring major liquidity grabs and false breakouts.
Be disciplined with SL/TP management – especially in such volatile conditions.
Wait for candle confirmation before reacting — don’t trade emotionally.

Learn Institutional Levels Trading part 6Institutional traders often use technical analysis for short-term trading, capitalizing on short-term market fluctuations. They also often use key levels to determine where to place their large orders. To do that, they identify key supply and demand zones and use these levels to enter and exit large positions.

LIC HOUSING FINANCE LTDAs of May 16, 2025, LIC Housing Finance Ltd. (NSE: LICHSGFIN) exhibits a mildly bullish trend on the 15-minute timeframe, supported by several technical indicators:
📊 15-Minute Technical Analysis Summary
Price Levels:
Current Price: ₹617.95
High-Low Moving Average (HL MA) Bands:
Upper Band: ₹622.49
Middle Band: ₹619.49
Lower Band: ₹616.49
These bands suggest the stock is trading near its middle range, indicating potential consolidation.
MACD (12,26,9):
MACD Line: -3.16
Signal Line: -3.58
Histogram: Positive, indicating a bullish crossover
The MACD has been rising over the last five periods, reinforcing the bullish sentiment.
Technical Strength:
LICHSGFIN's technical strength is rated as "Mild Bullish," outperforming approximately 44.20% of stocks in the same category.
📈 TradingView Technical Summary (15-Minute Timeframe)
On TradingView, the 15-minute technical indicators for LICHSGFIN present a Neutral outlook, suggesting a balance between bullish and bearish signals.

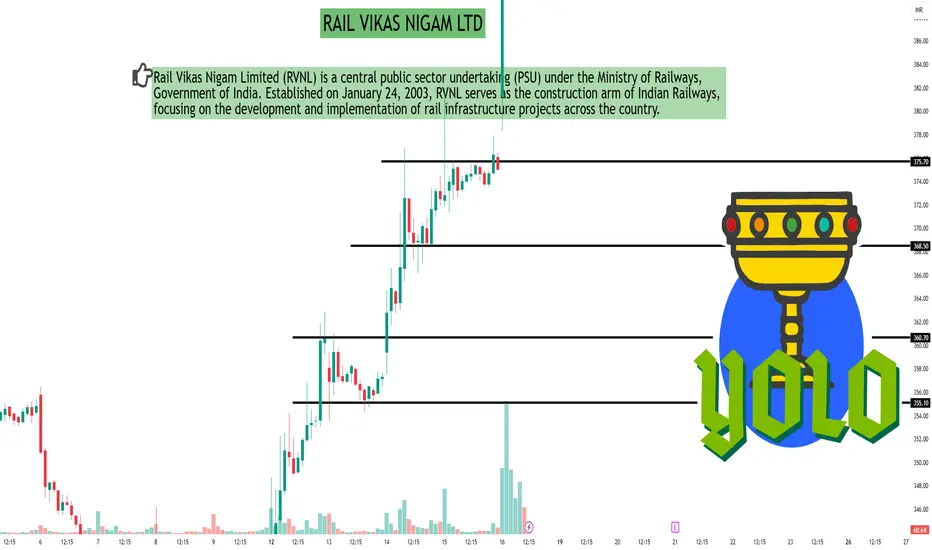
RAIL VIKAS NIGAM LTDAs of May 16, 2025, Rail Vikas Nigam Ltd. (NSE: RVNL) exhibits a bullish trend on the 30-minute timeframe, supported by several technical indicators:
📈 30-Minute Technical Analysis Summary
Current Price: ₹412.45
Relative Strength Index (RSI): 70.92
Indicates overbought conditions, suggesting strong upward momentum.
Moving Average Convergence Divergence (MACD): 2.89
Positive value supports the bullish trend.
Average Directional Index (ADX): 62.56
Reflects a strong trend strength.
Stochastic Oscillator: 78.09
Near overbought territory, indicating strong buying pressure.
Rate of Change (ROC): 0.972
Positive value aligns with upward price movement.
Supertrend: ₹372.14
Below current price, reinforcing the bullish outlook.
Parabolic SAR (PSAR): ₹371.61
Below current price, indicating an uptrend.
Chaikin Money Flow (CMF): 0.216
Positive value suggests buying pressure.
📊 TradingView Technical Summary (30-Minute Timeframe)
On TradingView, the 30-minute technical indicators for RVNL present a Neutral outlook, suggesting a balance between bullish and bearish signals.
⚠️ Trading Considerations
Overbought Indicators:
RSI and Stochastic values suggest the stock is in overbought territory; traders should watch for potential pullbacks.
Support Levels:
Supertrend and PSAR levels around ₹372 may act as support in case of a price correction.
Volume Analysis:
Monitoring volume trends alongside price movements can provide additional insights into the strength of the current trend.
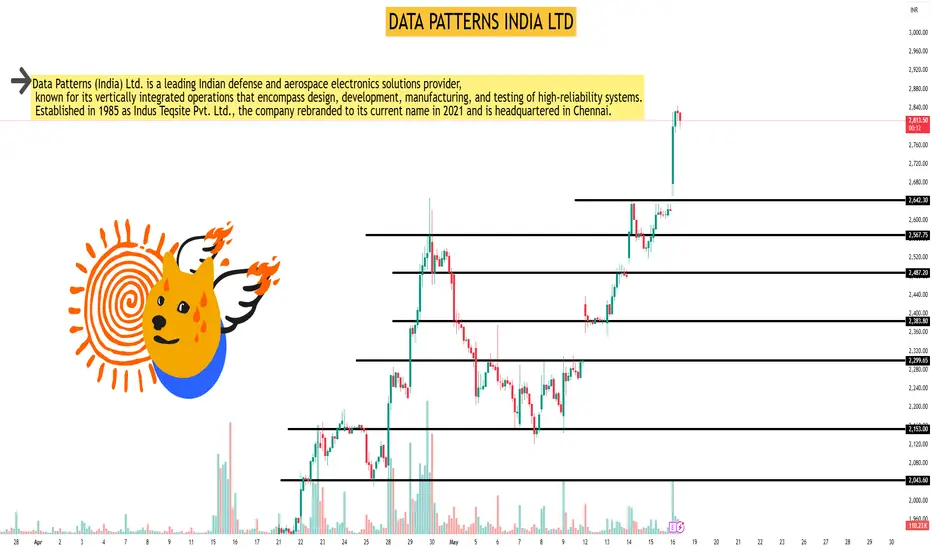
DATA PATTERNS INDIA LTDAs of May 16, 2025, Data Patterns (India) Ltd. (NSE: DATAPATTNS) exhibits a mildly bullish trend on the 45-minute timeframe, based on key technical indicators.
📊 45-Minute Technical Snapshot
Current Price: ₹2,821.20
20 SMA: ₹1,569.44
50 SMA: ₹1,546.58
Signal: Mild Bullish
Latest Price / MA Crossover: 7 ticks back
Crossover Type: Bullish
Analysis: Mild 20MA up, Mild 50 MA Uptrend, Mild Buy
📈 Additional Technical Indicators
Relative Strength Index (RSI): 72.31
Rate of Change (ROC): 56.07
Average Directional Index (ADX): 25.6
📉 Candlestick Patterns
Bullish Marubozu: Indicates strong buying pressure.
Long White Candle: Suggests bullish momentum.
📌 Summary
The 45-minute technical analysis of Data Patterns (India) Ltd. indicates a mildly bullish trend, supported by moving average crossovers and positive momentum indicators. However, the RSI suggests the stock is approaching overbought territory, warranting cautious optimism.
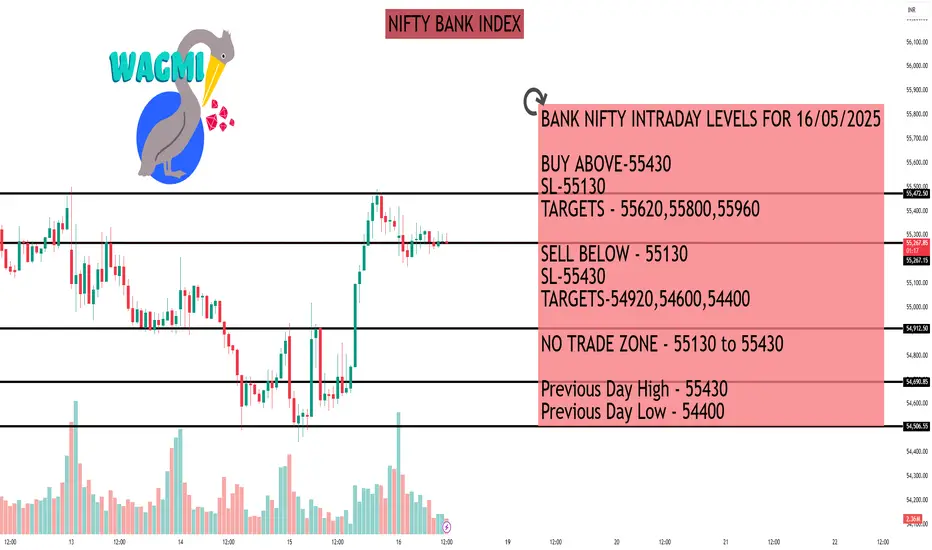
NIFTY BANK INDEXBANK NIFTY INTRADAY LEVELS FOR 16/05/2025
BUY ABOVE-55430
SL-55130
TARGETS - 55620,55800,55960
SELL BELOW - 55130
SL-55430
TARGETS-54920,54600,54400
NO TRADE ZONE - 55130 to 55430
Previous Day High - 55430
Previous Day Low - 54400
Based on price action major support & resistance's are here, the red lines acts as resistances, the green lines acts as supports. If the price breaks the
support/resistance, it will move to the next support/resistance line. White lines indicates previous day high & low, high acts as a resistance & low acts as a support for next day.
Trendlines are also significant to price action. If the price is above/below the trendlines, can expect an UP/DOWN with aggressive move.
Please NOTE: this levels are for intraday trading only.
Disclaimer - All information on this page is for educational purposes only,
we are not SEBI Registered, Please consult a SEBI registered financial advisor for your financial matters before investing And taking any decision. We are not responsible for any profit/loss you made.
Request your support and engagement by liking and commenting & follow to provide encouragement
HAPPY TRADING
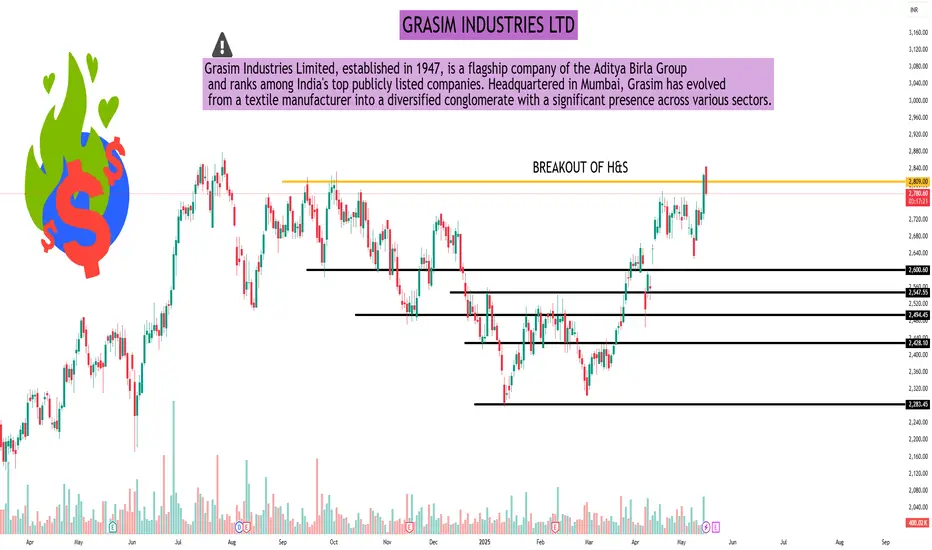
GRASIM INDUSTRIES LTDGRASIM INDUSTRIES LTD
Grasim - Inverted Head and Shoulder Breakout
Grasim, posted strong numbers!
A nice Inverted H&S pattern breakout done.
Buy @ 2825-2800
SL 2630
Target: 3250++
RSI is above 60+
MACD is Positive and giving a cross over
along with DMI showing Strength
Stocks looks super strong!
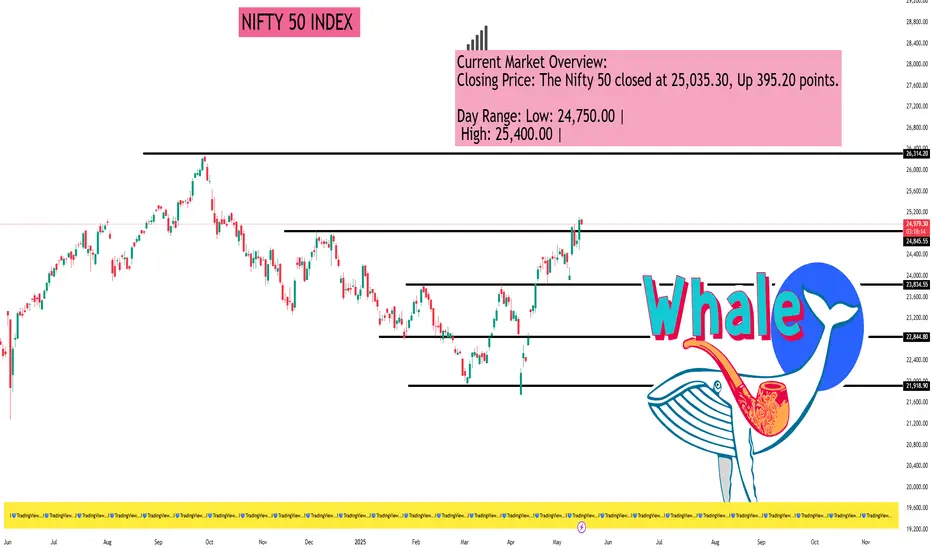
NIFTY 50 INDEX Nifty 50 Technical Analysis - May 16, 2025
Current Market Overview:
Closing Price: The Nifty 50 closed at 25,035.30, Up 395.20 points.
Day Range: Low: 24,750.00 |
High: 25,400.00 |
Market Sentiment: The market exhibited strong bullish momentum, driven by positive global cues, including a ceasefire between India and Pakistan and optimism around US-China trade negotiations
Chart for your reference
Advanced Divergence Strong divergence is the most reliable type of divergence, often signaling a significant reversal. It occurs when the price makes a new high or low, but the indicator fails to do so, indicating weakening momentum.

Gold Reclaims 3200 What’s Next?Yesterday, gold dipped into the 3140–3160 support zone, even tagging a low near 3120 and from there, buyers stepped in with a decent bounce. That was expected.
Now, price has reclaimed the 3200 level and this is the key zone to watch today. ⚠️
Above 3200? Bulls might get some room to test the next resistance around 3265–3275. This is a short-term target if the upside continues.
Back below 3200? Bears may take control again, with potential continuation toward yesterday’s lows. If that breaks, our previous downside projection remains in play.
Also, from the Fibonacci retracement of this recent down leg (from 3440 to 3120) the 3282 level is a major Fib level (0.5) to watch, Unless we close above that, I’ll continue holding part of my short positions, aiming for lower levels as marked on the chart.

Learn Institutional Trading part 3Institutional trading refers to the practice of buying and selling securities for institutions, not individual investors. These institutions, like mutual funds, insurance companies, and pension funds, manage significant capital and can influence market prices due to their large volume of trades.

Database and Technical Concept part 2A database is an organized collection of structured information, or data, typically stored electronically in a computer system. A database is usually controlled by a database management system (DBMS).

Database and Technical ConceptA database is a structured collection of data organized for efficient storage, retrieval, and management. It's typically controlled by a Database Management System (DBMS), which provides the tools for interacting with the database. Databases are fundamental to various applications, including online shopping, banking, and social media, enabling the storage and management of large amounts of data.
