USD/JPY pair and asking for a target...USD/JPY pair and asking for a target, here’s what the technicals suggest — but keep in mind: this is not financial advice — my responsible for my trades.
---
✅ What the technicals are showing
The pair is trading above its 50-week SMA, which suggests a longer-term bullish tilt.
A key resistance level is around 153.26. A breakout above that opens the way to higher targets.
If the breakout happens, one target cited is 158.80 (via a 161.8% projection).
On the flip side, if support fails (specifically ~145.47), the bullish case weakens.
---
🎯 My suggested target
Primary target: ~ 158.80 — with the caveat that my need a clean breakout above ~153.26 to justify it.
Alternate scenario: If the pair fails to break convincingly and support breaks ~145.47, the target becomes a drop toward the support zone instead.
---
🧠 Things to watch / trade‐management points
Confirm breakout: Look for a daily / 4-hour close above ~153.26 and increased momentum.
Risk management: If my entering now, consider placing your stop-loss below support (e.g. 145-147 zone) because a break there weakens the scenario.
Measure rewards vs risk: If my risk is large (large stop), the target must justify it.
Be aware of fundamentals: Events from the Bank of Japan (BOJ) or Federal Reserve (Fed) can shift this quickly.
M-forex

Silver Futures (MCX) 4-hour chart Silver Futures (MCX) 4-hour chart, and my marked a resistance zone and a downward breakout below the Ichimoku cloud and key support.
Here’s what I can interpret:
Price broke below the Ichimoku cloud, confirming a bearish trend.
There’s a clear resistance area around ₹151,000–₹153,000.
The breakdown happened below the ₹145,000–₹146,000 level.
My marked a target zone below, with a downward arrow.
✅ Likely Target Projection
Using standard technical projection (height of range = target distance):
Resistance zone top: ~₹153,000
Breakdown zone: ~₹145,000
Height: ₹8,000
If we subtract that from the breakdown area:
Target = 145,000 – 8,000 = ₹137,000
🎯 Estimated Short-term Target:
₹137,000 – ₹138,000
This aligns with my chart’s “target point” mark.
If you want to be more precise, you could:
Watch for support around ₹140,000, which might give a bounce.
If that breaks, next major support zone = ₹136,000–₹137,000.

EUR/USD chart...EUR/USD chart:
Chart timeframe: 2H (2-hour chart)
Pattern: It looks like a descending trendline breakout from a consolidation (range) zone, confirmed by Ichimoku signals and upward momentum.
Indicators: Ichimoku Cloud shows price breaking above the cloud — a bullish sign.
Target zone: my marked two “target points” with arrows on my chart.
---
To estimate the target price, let’s infer it based on the chart:
1. Current price (breakout point): ≈ 1.1667
2. Height of the range (pink box): roughly from 1.1520 to 1.1670
→ Range height ≈ 150 pips (0.0150)
If this is a range breakout, then:
Target 1 (conservative): 1.1667 + 0.0150 = 1.1817
Target 2 (extended): another projection from that = 1.1967
---
✅ Targets Summary:
🎯 Target 1: 1.1817
🎯 Target 2: 1.1967
These align with my chart’s two “target point” lines visually.

Gold Under Pressure: Critical Support Lost, 4040 Reclaim Needed Yesterday's session provided clear confirmation of the bearish pressure building in gold as price faced strong resistance around the CPR area between 4094-4108. The early Asian session rejection was particularly telling, as buyers simply couldn't get enough strength to push through this zone. What followed was a decisive breakdown below the psychologically important 4000 level, which had been acting as major support throughout the recent price action.
For today's session, CPR zone positioned at 4001-4040. This is now our critical battleground. Bulls need to reclaim at least 4040 (CPR TC) to suggest any meaningful recovery is underway. Without a clean breakout above this level, the path of least resistance remains to the downside, and bears are firmly in control of the near-term direction. The current price structure suggests sellers are gaining confidence, especially after yesterday's breakdown.
On the downside, the first intraday support level for today is to watch at 3933. This could provide a temporary bounce zone if we see continued selling pressure. However, given the momentum shift and the loss of 4000 support, we need to approach any long positions cautiously here. The market is clearly favoring the bears at this point, and it would take a significant shift in sentiment to change that dynamic in the immediate term.
My Position : I am still managing my buy entries and currently in floating loss ,max extension that I am expecting in lower side is at around 3800-50 area and that is manageable as per my current lot sizing.

XAU/USD (Gold) chart on the 3-hour timeframe...XAU/USD (Gold) chart on the 3-hour timeframe, I can see my using the Ichimoku Cloud and have marked a range with a potential breakdown area and a target point already indicated on the chart.
Here’s what the chart suggests:
Current price: around 4031 USD
Range low (support): around 4030 USD (which is currently being tested)
Range high (resistance): around 4190–4200 USD
Breakdown target (measured move): around 3940–3950 USD
📉 Analysis:
Price has broken below the range box, indicating a bearish breakout.
The Ichimoku Cloud ahead is bearish and thick, showing potential resistance.
A measured move from the height of the range (≈ 150–170 points) projects downward to around 3940–3950 USD.
My chart already marks 3944.299 as the target point, which aligns well with this projection.
✅ Target Summary
Type Level (USD) Comment
Short-term target 3,944 Measured move target after range breakdown
Extended target 3,900–3,880 Possible continuation if bearish momentum sustains
Invalidated above 4,090–4,100 If price re-enters the range and closes above the cloud

[XAUUSD] New Week Scenario: Accumulation Awaiting Drop New Week Scenario: Accumulation Awaiting Drop - Watch for Selling at Liquidity Zone $4195
Hello traders community,
The new week begins with XAUUSD (Gold) being "restrained" in a sideways structure. However, don't let this calm deceive you. Technically, this is an accumulation pattern with a clear bearish bias.
The market is in "wait" mode, and patience will be the key to catching the next big wave.
📰 MACRO ANALYSIS: TUG OF WAR AHEAD OF FOMC
The market is caught between two opposing streams of information:
Bearish Pressure: Positive signs of a US-China trade deal are reducing the demand for safe-haven assets, putting pressure on Gold prices.
Bullish Support: The weakening USD due to expectations that the Fed will continue to cut interest rates, inadvertently provides some short-term support for the precious metal.
Decisive Factor: Traders are "lying low" waiting for this week's two-day monetary policy meeting (FOMC). This will be the main event, determining the medium-term trend of USD and Gold.
📊 TECHNICAL ANALYSIS: CONTINUATION OF BEARISH STRUCTURE
The H1 chart shows a very clear "Sell" scenario:
Price Structure: After a strong drop from the peak, the price is moving sideways in an accumulation pattern of a bearish pennant. This is a continuation structure, indicating that the Sellers are "resting" before pushing the price further down.
Ideal Sell Zone: The $4195 zone is an extremely strong resistance confluence, marked as "Liquidity strong" on the chart.
This is the 0.5 Fibonacci level, the "golden" retracement point of the entire previous decline.
This is the old support zone now turned into new resistance.
Optimal Scenario: We will wait for the price to pull back to test the $4195 liquidity zone. This is an opportunity for Sellers to enter the market with low risk and high profit potential.
🎯 TRADING PLAN (SELL SETUP)
Absolute priority is to Watch for Selling (Sell) in line with the main trend.
ENTRY (Sell): $4195
STOP LOSS: $4205
TAKE PROFIT: TP1: $4168-TP2: $4145-TP3: $4122-TP4: $4102
SUMMARY
In the context of the market awaiting FOMC news, Gold is likely to make a final "pullback" to the $4195 zone before continuing its downtrend. Be patient and wait for signals at this ideal sell zone.
Wishing traders a successful and disciplined new trading week!

XAUUSD Intraday Trade Plan | Buy @ 4060Gold (XAUUSD) is attempting to hold above the 4060 support zone — a key level that acted as a strong base in previous sessions.
If this level continues to hold, we could see a potential bullish rebound in the intraday session.
📊 Trade Setup:
Buy Zone: 4060 – 4062
Stop Loss: 4052
Target 1: 4075
Target 2: 4090
💡 Analysis:
Price action is showing signs of demand re-entering near the 4060 level, suggesting buyers are defending this zone.
A clean break and hold above 4070 could trigger momentum toward 4090.
However, a breakdown below 4052 would invalidate the setup.
🧭 Bias: Intraday Bullish (above 4060)
⚠️ Risk Disclaimer: This is not financial advice. Manage your risk accordingly.

GBP/JPY (British Pound / Japanese Yen) 1-hour chartGBP/JPY (British Pound / Japanese Yen) 1-hour chart, I have drawn a rising wedge pattern — which is typically a bearish reversal setup once the lower trendline breaks.
Here’s the detailed target analysis:
---
📉 Current price:
Around 203.50
⚠ Breakdown level (support zone):
Around 203.20 – 203.00
If the price closes below this zone, the bearish move is confirmed.
---
🎯 Target 1 (short-term target):
≈ 202.20 – 202.30
This aligns with my first target point marked on the chart — the initial measured move from the wedge height.
---
🎯 Target 2 (extended / full move):
≈ 201.20 – 201.30
This matches my second target point — the full measured projection of the wedge pattern.
---
✅ Summary:
Level Description Zone
🔻 Breakdown Point Confirm sell below 203.20 – 203.00
🎯 Target 1 First profit level 202.20 – 202.30
🎯 Target 2 Final profit level 201.20 – 201.30
⛔ Stop-loss Above recent high 204.00 – 204.20

XAUUSD, Whats the Trend? If Pattern Breaks out?#Gold (#XAU/USD) Technical Analysis - October 24, 2025
Current Market Bias: **BEARISH**
Gold is currently trading at 4,109.12, positioned within a critical decision zone. The price action shows a developing #Descendingtriangle pattern with a clear resistance trendline connecting the recent highs around 4,150-4,200.
Key Observations:
The market has failed to break above the dynamic resistance multiple times, indicating weakening bullish momentum. Price is currently hovering near the 0.618 Fibonacci retracement level (4,153.81) but struggling to maintain above it. The horizontal support around 4,015 has been tested multiple times, forming the base of this triangle pattern.
#Breakout Scenarios:
📉 Bearish Breakdown (Higher Probability)
If the horizontal support at 4,015 breaks decisively:
- First Target: 3,918 (1.272 Fibonacci extension)
- Second Target: 3,865 (1.414 Fibonacci extension)
- Extended Target: 3,791 (1.618 Fibonacci extension)
- Major Support: 3,652 (2.0 Fibonacci extension)
This breakdown would represent a continuation of the corrective move from the all-time highs, potentially triggering significant selling pressure as stop-losses are triggered below 4,000.
📈 #Bullish Breakout (Alternative Scenario)
If price breaks above the descending resistance trendline AND reclaims 4,150-4,200:
- First Target: 4,250
- Extended Target: 4,300 (previous highs)
This would invalidate the bearish triangle pattern and could trigger a rally back toward recent highs.
#Risk Management
The pattern suggests a #risk-reward favoring short positions on breakdown confirmation. Traders should wait for a decisive close below 4,015 with increased volume before entering bearish positions. Stop-loss above 4,150 would be prudent for short positions.
Current stance: Monitor the 4,015 support closely - a break here opens the door to significant downside.

BTC/USDT (Bitcoin vs Tether).....BTC/USDT (Bitcoin vs Tether) on the 1-hour timeframe (Binance).
Here’s what the technicals show:
A clear ascending trendline has been broken downward.
Price is retesting the broken support (now resistance) around 108,800–109,000.
There’s a bearish continuation setup after the sharp drop from the 113,000 zone.
The chart marks a “Target Point” at the bottom, aligned with the measured move of the pattern.
📉 Analysis Summary:
Breakdown level: ~109,000
Current price: ~107,800
Measured move / target: ~103,000
✅ Bearish Target Zone:
> 🎯 Target = 103,000 – 103,200 USDT

XAU/USD (Gold vs USD) 4H chart:XAU/USD (Gold vs USD) 4H chart:
I can see a clear double top pattern near the 4,330 zone (circled areas).
Price has broken the ascending trendline and is currently retesting near the 4,080–4,100 resistance zone (previous support).
The green zone shows the neckline area that price already broke below.
📉 Technical Breakdown:
Pattern: Double Top
Neckline: Around 4,130
Measured Move Target: Equal to the distance from the top (~4,330) to the neckline (~4,130), i.e. ≈ 200 points.
Applying that below the neckline gives:
→ 4,130 - 200 = 3,930
However, my chart’s “Target Point” line is drawn slightly lower — around 3,848.57, which aligns with a deeper support level and the full projection of the trend break.
✅ Final Target Zone:
Primary Target: 3,930
Extended / Full Target: 3,850 (3,848.57)
So:
> 🎯 XAU/USD Bearish Target = 3,850 – 3,930 zone

XAUUSD Forms a Cup and Handle PatternOANDA:XAUUSD has been steadily rising, maintaining strong and consistent upward momentum. If you’ve been following my previous analyses, you’ll notice a familiar pattern developing on the chart — the classic Cup and Handle formation.
Looking closer, the left side of the chart reveals a strong supply zone, forming the cup. Then, we see the market building a potential handle on the right, indicating that the price is accumulating strength for the next move.
Now, here’s where things get interesting: if buying pressure aligns with Dow Theory waves and the Fibonacci retracement levels at 0.786 and 0.618 hold steady, with the price breaking through the neckline, this setup could push gold to 4500 USD.
However, if selling pressure comes in stronger than expected, the pattern may fail, and we could see a price pullback.

XAUUSD Builds Upward PressureGold continues to trade within a strong upward trajectory,showing consistent momentum and firm buyer engagement.The market structure indicates ongoing accumulation,with price maintaining stability after minor corrective movements.Buy-side activity remains dominant,reflecting confidence among institutional participants as the metal sustains its trend within an orderly channel.While short-term pullbacks may occur for liquidity rebalancing,the broader outlook remains decisively bullish as long as momentum persists and demand continues to support higher valuations.

XAUUSD: Profit-Taking Pressure Emerges XAUUSD: Profit-Taking Pressure Emerges - Trading Strategy as Gold Adjusts
Hello traders community,
Today's trading session witnessed a strong "Price Rejection" of XAUUSD at the new peak, triggering a nearly $20 drop. Although the long-term bullish structure remains intact, the profit-taking signal from buyers is evident. This article will delve into the analysis of key price zones and outline a detailed trading strategy in the context of the adjusting market.
📊 Technical Analysis
The H1 chart provides us with an overview of the current liquidity zones and price structure:
Fibonacci Resistance Zone: The price reacted strongly at the confluence of the 2.618 Fibonacci Extension levels, around the $4240 area. A strong bearish candle emerged right after the price touched this zone, confirming it as an extremely potential "Sell zone." Sellers have officially stepped in.
Point of Control (POC) and Liquidity: The Volume Profile (VPVR) indicator shows the area with the highest trading volume concentration (POC) is at $4196. This is the "magnet" zone attracting price in the short term. If the price recovers, this will be the decisive tug-of-war zone.
Key Support Zones:
$4196 (Buy Scalping): The POC zone acts as the first price support point. Scalping traders can look for short-term buying opportunities here.
$4158 (Buy Zone): This is a stronger support zone, the bottom of the previous uptrend, and also an area with significant trading volume. Buyers are likely to return strongly if the price adjusts here.
📰 Market Sentiment
Profit-Taking Pressure: After a hot growth streak, Gold's sharp drop of nearly $20 is a healthy adjustment move. The selling force mainly comes from short-term profit-taking traders.
"Sharks" Still Accumulating: Notably, while the price adjusts, the world's largest gold ETF, SPDR Gold Trust, increased its gold holdings by 1.15 tonnes. This move shows that large institutions remain optimistic about Gold's long-term prospects and are taking advantage of the dip to accumulate more. This is a signal contrary to short-term price action, which traders need to pay special attention to.
🎯 Actionable Trading Plan
With the current technical signals and market sentiment, we prioritize the strategy of selling when the price recovers (Sell the Rally).
Scenario 1: Sell on Downtrend (Sell) 📉
Entry Zone: Wait for the price to recover to the $4228 zone. This is the "retest" area of the liquidity zone previously controlled by sellers.
Stop Loss: $4235, above the nearest minor peak.
Take Profit: $4210 - $4188 - $4165 - $4133.
Scenario 2: Buy at Strong Support (Buy) 📈
Entry Zone: If the price continues to drop, look to buy at the "Buy zone" $4158.
Stop Loss: $4150, a safe level below the support zone.
Take Profit: $4173 - $4190 - $4205 - $4230.
Scenario 3: Short-Term Scalping (Scalping Buy) ⚡️
Entry Zone: Quick buy at the POC zone $4196.
Stop Loss: $4188, a short and tight stop loss level.
Take Profit: $4210 - $4228.
Summary
In the short term, sellers are temporarily dominant after Gold failed to conquer the $4240 resistance zone. The main strategy is to sell when the price recovers. However, the buying action of the SPDR fund indicates that the medium and long-term uptrend remains very solid. Therefore, buying orders at strong support zones like $4158 are also an opportunity not to be missed.
Trade with discipline and manage your capital tightly. Wishing all traders an effective trading day!
Note: This analysis is based on personal views and is for reference purposes only, not direct investment advice.

Gold Bulls Unstoppable Another All-Time High! Gold continues its unstoppable march north, printing fresh all time highs almost daily. Despite a brief shakeout over the past couple of sessions, buyers stepped in aggressively, confirming strong demand on every dip.
From a technical perspective, the uptrend remains firmly intact. Price is comfortably holding above the 4,200 zone, which now acts as immediate support. The volume profile shows a significant cluster around 4,190–4,205, indicating strong buying interest in this area this is the level to watch for short term structure.
On the fundamental side, the macro backdrop continues to support gold: geopolitical tensions, central bank accumulation, and lingering inflation expectations all add fuel to the rally.
Bulls are clearly in control, and as long as gold sustains above 4,200, the path of remains up also watch two rising trendline carefully in case of breakdown we can expect pullback ., the move is getting a bit extended, so we have be cautious with fresh entries at these stretched levels.

XAUUSD | Gold Holds Firm as Buyers Dominate the MarketGold continues to demonstrate a strong and orderly bullish structure, with momentum sustained by a combination of market confidence and macroeconomic positioning. The metal’s consistent upward drive reflects ongoing demand for safety amid lingering inflationary concerns and uncertainty surrounding global economic recovery. Institutional accumulation remains visible, suggesting that investors are positioning ahead of potential policy adjustments and currency fluctuations.
The recent moderation phase appears to be a controlled pause rather than weakness, indicating that buyers are maintaining control while the market digests prior gains. Should current stability in yields persist and geopolitical tensions remain elevated, gold could extend its advance in the medium term, reaffirming its role as a key hedge within diversified portfolios.

XAUUSD // Liquidity Grab // ATH# Gold Spot / U.S. Dollar - Liquidity Analysis
Market Structure Analysis
Key Liquidity Zones Identified
The chart highlights two critical liquidity zones where significant price action is anticipated:
**Upper Liquidity Zone: $4,212 - $4,219**
This zone represents an area of accumulated buy-side liquidity, typically formed by stop-losses from short positions and buy-stop orders. The red shaded area indicates where institutional players may target for liquidity capture before potential reversals.
**Lower Liquidity Zone: $4,157 - $4,162**
This zone marks the sell-side liquidity area, where stop-losses from long positions and sell-stop orders cluster. This level serves as a potential magnet for price action seeking to capture liquidity before any significant directional move.
Technical Setup
**Channel Pattern**
Gold is currently trading within a well-defined ascending channel on the intraday timeframe. The parallel trend lines show:
- Consistent higher highs and higher lows
- Price currently positioned in the mid-range of the channel
- Recent bounce from the lower channel boundary
**Demand Zone**
A marked demand zone is visible at lower levels, indicating previous buying interest and potential support.
Price Action Scenarios
Bullish Scenario (Green Path):
If price maintains support at current levels or the lower demand zone, we could see:
1. Continuation toward the upper liquidity zone ($4,219)
2. Potential liquidity sweep above this zone
3. Possible rejection after capturing buy-side liquidity
Bearish Scenario (Red Path):
If price fails to hold current structure:
1. Drop toward the lower liquidity zone ($4,162)
2. Liquidity grab below this level
3. Potential reversal after capturing sell-side liquidity
#Liquidity Concept
The annotation "Liquidity !!!!!!" emphasizes the importance of these zones. In institutional trading theory, price often moves to areas of high liquidity (where stop-losses cluster) before making significant directional moves. This is commonly referred to as a "liquidity sweep" or "stop hunt."
Trading Considerations
When price approaches either liquidity zone, traders should watch for:
- Rejection wicks suggesting liquidity capture completion
- Break and retest patterns for confirmation
- Changes in momentum indicators
Risk Management Notes
- The 5-minute timeframe requires precise execution and tight risk management
- Liquidity zones can be quickly swept through in volatile conditions
- Always use appropriate position sizing relative to account risk tolerance
- Consider wider timeframe context for overall trend direction
Disclaimer
This analysis is provided for educational purposes only and represents a technical perspective on price structure and liquidity zones.
It is not financial advice or a recommendation to buy or sell. Gold trading involves substantial risk of loss. Always conduct your own research, use proper risk management, and consider consulting with a qualified financial advisor before making trading decisions.

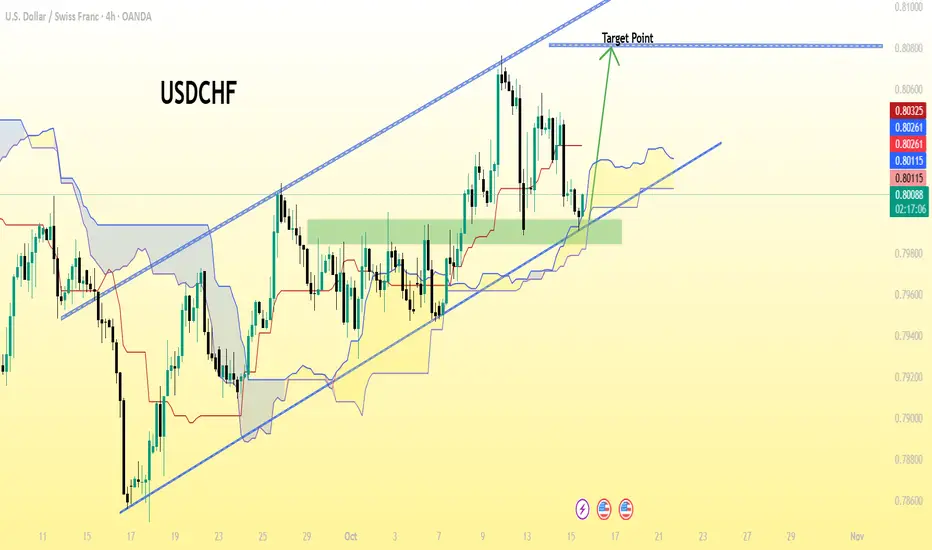
USD/CHF (U.S. Dollar vs. Swiss Franc) on the 4-hour timeframe...USD/CHF (U.S. Dollar vs. Swiss Franc) on the 4-hour timeframe.
From my chart :
The price is moving in an ascending channel.
A green support zone has been marked near 0.8000 – 0.8020.
The upper trendline of the channel is marked as the “Target Point.”
That line aligns approximately with 0.8080 – 0.8090 on the chart.
📈 Potential target area: 0.8080 – 0.8090
⚠ Note:
This is a technical projection based on the channel breakout/continuation pattern visible on my chart.
Price can fluctuate due to news or macroeconomic factors.
Always manage risk with stop loss — in this chart, a stop might logically sit below the support zone (~0.8000).
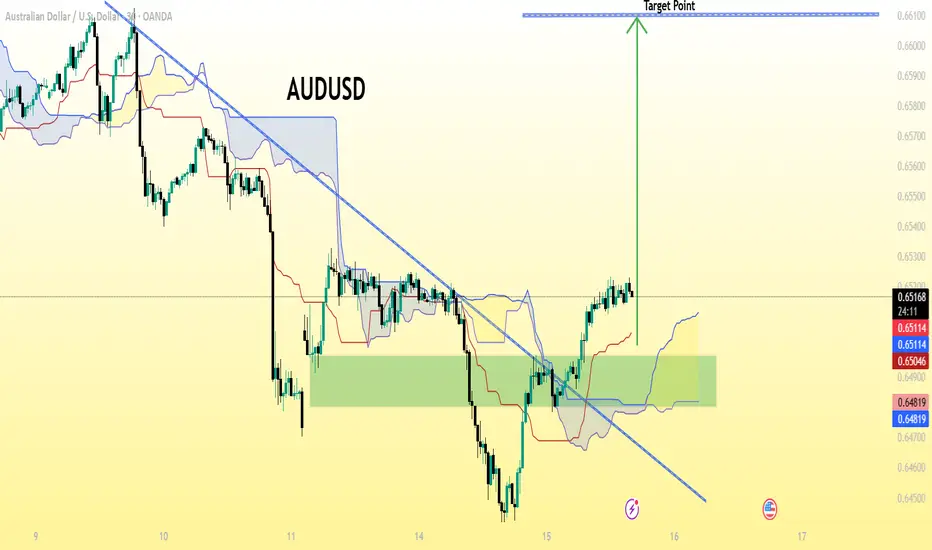
AUD/USD on a 30-minute timeframe (based on the visible labels)..AUD/USD on a 30-minute timeframe (based on the visible labels). Let’s break it down carefully:
The pair AUD/USD is currently trading around 0.6518.
The chart shows a bullish breakout above a descending trendline.
The green zone marked looks like a demand/support zone.
A target line is already drawn near the top of the chart, labeled “Target Point”.
🔍 Based on the chart:
The “Target Point” appears to be at approximately 0.6600 – 0.6605 level.
🧭 Summary:
Type Level
Entry Zone Around 0.6500–0.6520
Target (TP) 0.6600 – 0.6605
Stop Loss (SL) Likely below the green zone, around 0.6480
💡 Interpretation:
This setup seems to be a breakout + retest trade idea where the expectation is that AUD/USD will move upward about 80–100 pips toward the 0.6600 target area.
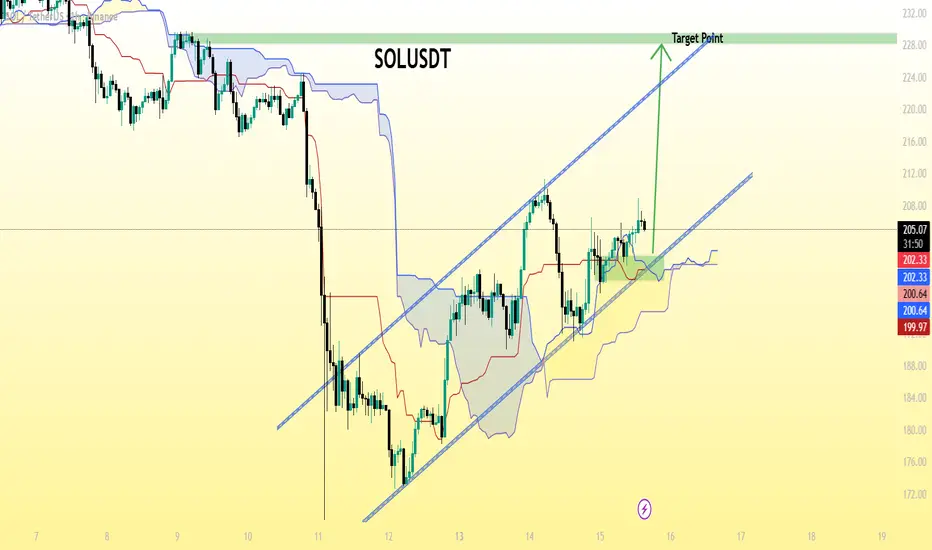
SOL/USDT chart pattern..SOL/USDT
The current price is around 205.5 USDT.
There’s a clear ascending trendline (blue line).
A breakout setup is indicated, with a marked “Target Point” near the top of the chart.
That target level appears to be around 230 USDT — the horizontal green line my labeled “Target Point.”
✅ Summary:
Current price: ≈ 205.5
Target price: ≈ 230 USDT
Upside potential: about +12% from the current level.
⚠ Note: Watch for support around 200–202 USDT (the Ichimoku cloud zone). If SOL holds that level, continuation toward 230 looks likely. A breakdown below the trendline could invalidate the move.
XAUUSD – Liquidity Sweep “Flush”XAUUSD – Liquidity Sweep “Flush”; prioritise trading around key zones 🟡
Gold just dropped nearly 90 points during the Asian session – a time typically lacking volume, resulting in a “flush” that wiped out many leveraged positions. The larger trend remains bullish, but short-term risks of a deep pullback are present before the European–American markets engage.
The accompanying image shows:
Price peaked and then broke the upper edge of the H1 uptrend channel → quickly fell to the mid-channel zone.
Thick Volume Profile cluster around 4.07x, POC ~4,075; below lies VAL ~4,025.
Sell retest zone marked around 4.14x; grey boxes indicate buy zones at 4,075 and 4,056.
Key Levels
Resistance: 4,143–4,150, 4,122, 4,160.
Support: 4,075 (POC), 4,056 (buy scalping), 4,025 (VAL).
Scalping watch: 4,057 – 4,085 – 4,160 – 4,025.
Trading Scenarios
SELL retest (reaction, higher risk)
Entry: 4,143
SL: 4,150
TP: 4,122 → 4,105 → 4,078 → 4,050
Idea: activate only upon clear rejection at 4.14x (long wick/engulfing H1).
BUY at POC zone
Entry: 4,075
SL: 4,067
TP: 4,089 → 4,100 → 4,122 → 4,155
BUY scalping (shallow pullback)
Entry: 4,056
SL: 4,049–4,050
TP: 4,075 → 4,089
Invalidation: short-term buy bias weakens if H1 closes below ~4,025 (VAL). If this zone breaks, prioritise waiting for a failed retest to consider selling with the continued downtrend.
Practical Notes
The range is currently very wide; the European session will increase volume, making false breaks more likely.
After TP1, move SL to entry to secure the position.
Sell orders are merely reaction trades at 4.14x; prioritise buy-the-dip at 4,075/4,056 upon confirmation signals.

“Nifty 50 Intraday Key Levels | Buy & Sell Zones 14th Oct 2025”“Want to learn more? Like this post and follow me!”
25473 🔴 Above 10m closing Shot Cover Level
Strong resistance — short covering likely above this.
25370 🟠 Below 10m hold PE By level /
Above 10m hold CE by level
25278 🟣 Above 10M hold positive trade view
Below 10M hold negative trade view
Sentiment deciding level — crucial for trend direction.
25160 ⚫ Above Opening S1 10m Hold CE By level
Bullish entry level — CE hold area.
25078 🟠 Below Opening R1 10m Hold PE By level
Below 10m hold PE By Risky Zone Weak zone — PE may strengthen below this.
24970 🟢 Above 10M hold CE By Safe Zone level
Safe bullish zone — CE can be held confidently above.
24960 🔵 BELOW 10M hold UNWINDING level
Breakdown zone — unwinding or heavy selling possible below.

LiamTrading – GOLD: Continuing the trend towards 4,130Gold has broken 4,060 and set a new historical peak thanks to the US-China trade tensions and the expectation of an early Fed rate cut. The main trend remains upward; the next target level according to the channel structure is 4,130.
Technical H4→H1
The upward channel has been maintained for several weeks; breaking 4,060 confirms continuation.
Nearest liquidity zone: 4,030–4,032.
Medium-term volume POC: ~3,988.
Target/resistance clusters by rhythm: 4,050 → 4,072 → 4,088 → 4,100 → 4,130.
Trading Plan
Buy 1 (retracing to the liquidity zone)
Entry: 4,030–4,032
SL: 4,025
TP: 4,050 → 4,072 → 4,088 → 4,100 → 4,130
Buy 2 (medium-term POC)
Entry: 3,988
SL: 3,980
TP: 4,022 → 4,050 → 4,088 → 4,100 → 4,130
Sell reaction (higher risk)
Entry: 4,130
SL: 4,140
TP: flexible according to price reaction; prioritize closing at 4,070 if a clear rejection candle appears.
Invalidation: short-term upward structure weakens if H1 closes below 3,980.
Quick Notes
Prioritize “buy-the-dip” at 4,03x and 3,988; sell orders are only reaction trades at 4,130.
When TP1 is reached, move SL to entry to protect the position.
Volatility around US data release times may create false breaks; maintain disciplined risk management.
I will provide immediate updates as price paths change, real-time trading is the best way to be accurate and successful.
