Kalyan Jewellers: Wave Y Still at Play?Disclaimer: This analysis is for educational purposes only and does not constitute investment advice. Please do your own research (DYOR) before making any trading decisions.
Bigger Picture
Kalyan Jewellers topped near 795.40 and has been in a prolonged corrective phase. The structure since then is not impulsive but rather corrective — pointing toward a Double Combo (W–X–Y) correction.
Wave Structure Breakdown
Wave W: A clean zigzag down into 399.40 , completing the first corrective leg.
Wave X: Extended choppy consolidation into 616.00 , best interpreted as a connector.
Wave Y: Currently unfolding as an A–B–C decline . If the pattern holds, another leg lower could complete the structure.
Technical Confluence
Support Zone: 399.40 remains a major demand area , historically respected by price. If retested, it could become the potential accumulation zone .
Projected Trendline Resistance: The descending line from 795.40 to 616.00 may evolve into a key resistance barrier on the next test.
RSI: Recent bounce came from oversold territory — a technical relief rally, not yet a trend change .
Alternate Possibility
If the 442.25 low already marked the end of Wave Y, the current rally could evolve into the start of a new impulsive sequence . Confirmation requires RSI strength above midline (50) and sustained closes beyond the projected descending trendline.
Takeaway
Kalyan Jewellers is most likely unfolding a Double Combo correction (W–X–Y) with Wave Y still in progress. Traders should watch the 399.40 demand zone as a decisive level. Holding it could set up the next bullish cycle, while a breakdown risks a deeper correction toward 336.05.
M-oscillator

Man Industries (W): Bullish, Turnaround with Volatility(Timeframe: Weekly | Scale: Logarithmic)
The stock is in a confirmed structural uptrend (Higher Lows) following a year-long correction. It is currently battling a critical multi-year resistance zone, backed by strong fundamental news and rising volume.
📈 1. The Structural Turnaround (The "Big Picture")
- The Cycle: Trend analysis:
- Consolidation: Jan 2024 – July 2024.
- The Peak (ATH): The stock hit a major high in July 2024
- The Correction: A downtrend followed, bottoming out in March 2025.
- The Reversal: Since March 2025, the stock has shifted character, forming a clear series of Higher Lows, signaling that buyers are stepping in at higher prices.
🚀 2. The Catalyst & Recent Action (Week of Nov 17)
- The Catalyst (The "Why"): The recent surge is driven by the company signing a Memorandum of Understanding (MoU) with Aramco Asia India (a subsidiary of Saudi Aramco) to explore a manufacturing facility in Saudi Arabia. This news triggered the volume spike.
- The Breakout Attempt: Last week (Nov 17-21), the stock attacked the horizontal resistance zone.
- Surge: It rallied +5.60% for the week.
- Volume: The move was supported by 5.22 Million in volume —a significant pickup compared to the "dry" correction phase.
- The Rejection: Despite hitting a new 52-week high intraday (₹472.40 on Nov 20), the stock failed to close above the resistance, facing profit-taking near the highs.
📊 3. Technical Indicators
- Trend: Short-term EMAs are in a PCO (Price Crossover) state on Monthly & Weekly charts, confirming the uptrend.
- Momentum (RSI):
- Weekly/Monthly: RSI is rising, supporting the longer-term bullish view.
- Daily: The Daily RSI dipped on Friday, reflecting the immediate rejection/profit-taking at resistance.
🎯 4. Future Scenarios & Key Levels
The "Shooting Star" style rejection on the weekly chart makes the coming week critical.
🐂 Bullish Case (Breakout Confirmation)
- Trigger: A sustained close above the ₹465–₹475 zone.
- Target 1: ₹545
- Target 2: ₹645 (Blue-sky extension).
🐻 Bearish Case (Support Test)
- Trigger: If the "failed breakout" leads to further profit-taking.
- Support: The immediate support lies at ₹420. Holding this level is crucial to maintain the "Higher Low" bullish structure.
Conclusion
The stock is structurally bullish but is digesting a supply overhang at the All-Time Highs. The Aramco news provides a strong floor, but patience is needed for a decisive close above ₹475 to confirm the next leg up.

Tata Consumer (W): Bullish, Consolidation Breakout(Timeframe: Weekly | Scale: Logarithmic)
The stock is emerging from a 9-month sideways consolidation phase. While it has cleared the immediate resistance, the major test lies at the All-Time High (ATH) zone. The formation of bullish reversal candles on the weekly chart suggests buyers are regaining control.
📈 1. Trend & Structure (The "Box" Breakout)
- The Context: Since hitting its peak in Mar 2024, the stock has been trapped in a sideways "box" range.
- The Breakout: This week, the stock managed to close above the immediate horizontal resistance (approx. ₹1,170 - ₹1,180 ).
- Clarification on Resistance: It is important to note that while this is a breakout of the consolidation range, the major All-Time High resistance (around ₹1,240 - ₹1,253) is still just overhead. This is the final hurdle before "blue sky" territory.
🕯️ 2. Candlestick Analysis (The Bullish Signal)
- Hammer Candles: The last two weekly candles resemble Hammer formations (long lower wicks with small bodies).
- Interpretation: This indicates that every time sellers pushed the price down (towards ₹1,130-₹1,140), aggressive buying emerged to push it back up. This "rejection of lower prices" is a classic sign that the bottom is in.
📊 3. Indicators & Volume
- Volume Profile: Volume "dried up" significantly during the correction, and we are now seeing a gradual expansion in volume on up-weeks, indicating institutional accumulation.
- EMAs: The short-term EMAs are realigning into a bullish PCO (Price Crossover) state, confirming the trend shift.
- RSI: The RSI is rising from the mid-zone (above 50), showing that momentum is building without being overbought yet.
🎯 4. Future Scenarios & Targets
- 🐂 Target 1: ₹1,355 (Achievable once ₹1,253 is cleared).
- 🐂 Target 2: ₹1,570 (Long-term extension).
- 🛑 Support (The Safety Net): If the breakout fails, the stock will likely retest the demand zone at ₹1,040.7
Key Watchout
Watch the price action near ₹1,250. A high-volume close above this level is the "final confirmation" needed to activate the targets of ₹1,355+. Until then, it is a "buy on dips" setup.

BHEL – Approaching a Key Reversal Zone on the Weekly ChartBHEL has been in a broader W–X–Y corrective structure since topping out near ₹335 on the weekly timeframe. The first leg down (Wave W) completed around ₹176, followed by a steady recovery that is now pushing into a major resistance zone.
The current bounce looks like the tail end of Wave X , with price entering the 100% extension area of (a) near ₹301. This is a natural place where counter-trend rallies often slow down or fully exhaust.
Momentum remains strong — weekly RSI is pushing into the overbought zone — but there is still no confirmed bearish divergence. In simple terms:
strength is there, but it’s reaching the “watch carefully” zone.
If a bearish candlestick forms inside this highlighted region (shooting star, rejection wick, bearish engulfing, anything with real intent), it could mark the start of Wave Y , potentially dragging the stock much lower over the coming months.
Volume is supportive on the way up, but still not showing the kind of impulsive conviction that usually accompanies a fresh bullish trend.
For now, the plan is straightforward:
Let the weekly candle speak. If sellers step in here, Wave Y may begin. If price breaks above the zone decisively, this count gets challenged.
Disclaimer: This analysis is for educational purposes only and does not constitute investment advice. Please do your own research (DYOR) before making any trading decisions.

Sequent (D): Strongly Bullish, Fundamentally-Driven BreakoutThe stock has confirmed a major breakout from a 3-year structural turnaround. The move is backed by a massive earnings beat, high-conviction volume, and aligned indicators across all timeframes.
📈 1. The Long-Term Structure (The Turnaround)
- The Crash (2021-2023): After hitting its All-Time High (ATH) in June 2021, the stock entered a brutal correction, falling ~81% to form a base around ₹62 in February 2023.
- The Recovery: Since March 2023, the stock has been in a steady uptrend, forming a classic "rounding bottom" or recovery structure.
- The Hurdle: The recovery faced a stiff horizontal resistance trendline at the ₹239 - ₹241 zone. This level acted as a ceiling in October 2024 (High: ₹240.70) and rejected price action multiple times recently.
🚀 2. The Catalyst & Breakout (Today's Action)
- The Catalyst: The breakout is fueled by Q2 FY26 Earnings , where the company reported a staggering 209.1% YoY jump in Net Profit
- The Breakout: Today (Nov 18, 2025), the stock decisively shattered the ₹240 resistance, surging 7.10% to close near ₹247 .
- Volume Confirmation: The move was backed by massive volume of 9.15 Million shares, a sharp spike compared to the drying volume seen during the recent consolidation. This confirms institutional buying.
📊 3. Technical Indicators
- EMAs: Short-term EMAs are in a PCO (Price Crossover) state across Monthly, Weekly, and Daily timeframes, signaling a synchronized bullish trend.
- RSI: The Relative Strength Index is rising across all three timeframes, confirming that momentum is expanding with price.
🎯 4. Future Scenarios & Targets
The breakout has opened the door to higher levels, with a specific structural target in focus.
- The Gap (The Magnet): An unfilled gap on the daily chart has been identified from the steep 2021 correction. This gap exists between ₹270 and ₹276 (formed in August 2021). Gaps often act as magnets for price.
🐂 Bullish Targets:
1. Target 1 (Gap Support): ₹270 . The stock is likely to run toward the bottom of this unfilled gap.
2. Target 2 (Gap Fill): ₹295 . If momentum sustains and fills the gap, the next extension level is near ₹295.
🛡️ Support (The Entry Zone):
- Re-test Level: The breakout level at ₹239 - ₹240 has now flipped from resistance to support. A pullback to this zone would be a classic "buy-the-dip" opportunity to enter the trend with a favorable risk-reward ratio.
Conclusion
This is a high-quality setup. The combination of a technical breakout , earnings explosion, and gap-fill potential makes this a strong candidate for continuation. Watch for a hold above ₹239 .

Rico Auto (D): Strongly Bullish, 20-Year BreakoutThis is a high-conviction, "blue-sky" breakout setup. The stock has shattered a resistance confluence that includes a 20-year-old horizontal ceiling . This technical move is powered by a massive fundamental turnaround in the recent quarter.
🚀 1. The Fundamental Catalyst (The "Why")
The breakout is not random; it is a direct reaction to the company's Q2 FY26 Earnings report (announced recently):
- Net Profit: Nearly tripled (surged ~200-300%) compared to the previous year.
- Revenue: Showed healthy growth despite sector headwinds.
- Impact: This strong fundamental performance provided the volume and momentum needed to break the multi-decade resistance.
📈 2. The "Confluence" Breakout (The Setup)
The stock faced two formidable barriers at the **₹108** level:
1. The 20-Year Resistance: A horizontal "lid" formed at the major peak in September 2005 (approx. ₹106-₹108). Breaking a 20-year resistance is a sign of a significant structural shift.
2. The Angular Resistance: The downward trendline from the April 2024 ATH (₹157).
💥 3. Today's Price Action (Confirmation)
- The Surge: The stock surged +11.93% today, closing decisively above the ₹108 confluence zone.
- The Volume: The move was backed by 37.23 Million in volume—a massive spike compared to the "drying volume" seen during the consolidation. This confirms institutional participation.
📊 4. Key Technical Indicators
Indicator analysis confirms the momentum across all timeframes:
- RSI: Rising in Daily, Weekly, and Monthly charts, showing synchronized bullish momentum.
- EMAs: Short-term EMAs are in a PCO (Price Crossover) state across all three timeframes, signaling a strong trend alignment.
🎯 5. Future Scenarios & Targets
With the 20-year resistance broken, the stock has room to run.
- 🐂 Target 1: ₹127 (Immediate technical extension).
- 🛑 Support (The Safety Net): The breakout level at ₹108 is now critical. If the stock pulls back, this "resistance-turned-support" must hold to keep the breakout valid. A successful re-test here would be a textbook entry opportunity.

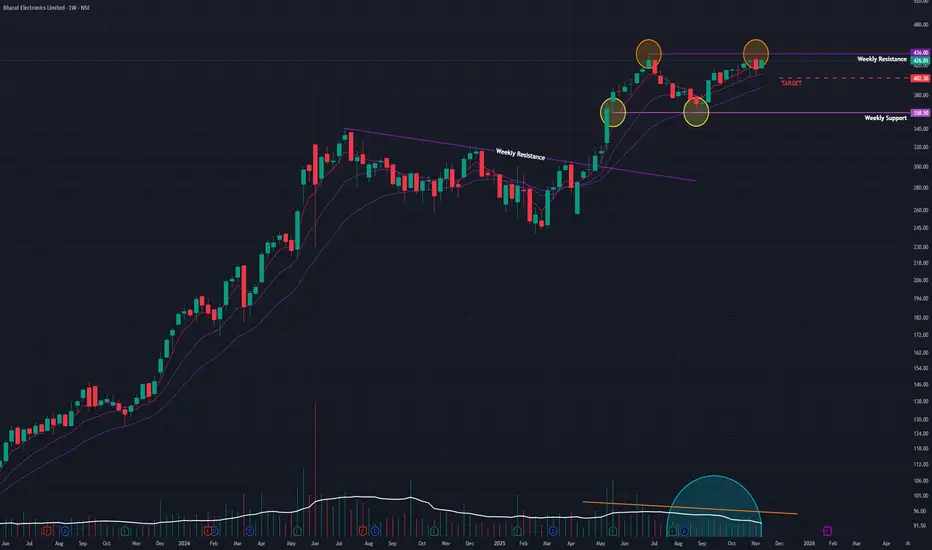
BEL (W): Primed for ATH BreakoutBased on Weekly Timeframe, Logarithmic Scale
This is a classic "coiling spring" setup. The stock is in a tight, bullish consolidation right below its all-time high. A powerful combination of fundamental catalysts, bullish high-timeframe indicators, and classic volume contraction suggests a breakout is highly probable.
🚀 1. The Fundamental Catalysts (The "Why")
This bullish technical pattern is fully supported by a torrent of positive fundamental news, providing a strong "tailwind" for the stock:
- Strong Q2 Earnings: On Oct 31, BEL reported a 26% rise in revenue and an 18% rise in net profit for Q2 2026, beating estimates.
- Massive Order Inflow: The company is announcing new, large-scale orders almost weekly, including ₹792 crore (Nov 10) and ₹871 crore (Nov 14). This provides high visibility for future earnings.
📈 2. The Dominant Pattern: Bullish Consolidation
- The "Flagpole": The stock made a strong move up to its All-Time High (ATH) in June 2025.
- The "Flag": Since then, it has been in a sideways consolidation phase , trading in a tight range just ~2% below its ATH.
- Drying Volume: Volume has been drying up during this consolidation. This is a classic, powerful sign that sellers are exhausted ("supply has dried up") and the stock is being accumulated.
- Recent "Ignition": Last week's +3.04% surge on 73.21M in volume was a significant "ignition" signal, showing that buyers are starting to re-emerge and test the resistance.
📊 3. Confluence of Bullish Indicators
The "trifecta" of bullishness on high timeframes is exceptionally strong:
- RSI: The Relative Strength Index is rising on both the Monthly and Weekly charts, showing that long-term momentum is firmly on the side of the buyers.
- EMAs: The short-term Exponential Moving Averages are in a "PCO" (Price Crossover) state on both the Monthly and Weekly charts, confirming the long-term trend is up.
🎯 4. Future Scenarios & Key Levels to Watch
The price action next week is critical.
🐂 The Bullish Case (Breakout)
- Trigger: A decisive, high-volume weekly close above the ATH resistance (₹436).
- Confirmation: This would confirm the end of the 5-month consolidation and the start of a new leg up into "price discovery."
- Target: The next logical technical price target is around ₹530 .
🐻 The Bearish Case (Breakdown)
- Trigger: If the stock fails to break out and momentum is lost (e.g., due to a broader market pullback).
- Confirmation: The stock would need to break below.
- Target: A failure would see the stock fall to retest its immediate support level at ₹400 .
Conclusion
A "wait and watch" approach is ideal, but the evidence is heavily skewed to the upside. The combination of a perfect technical pattern (high tight flag), bullish high-timeframe indicators, and a powerful fundamental story (earnings + new orders) makes this a textbook setup for an ATH breakout.
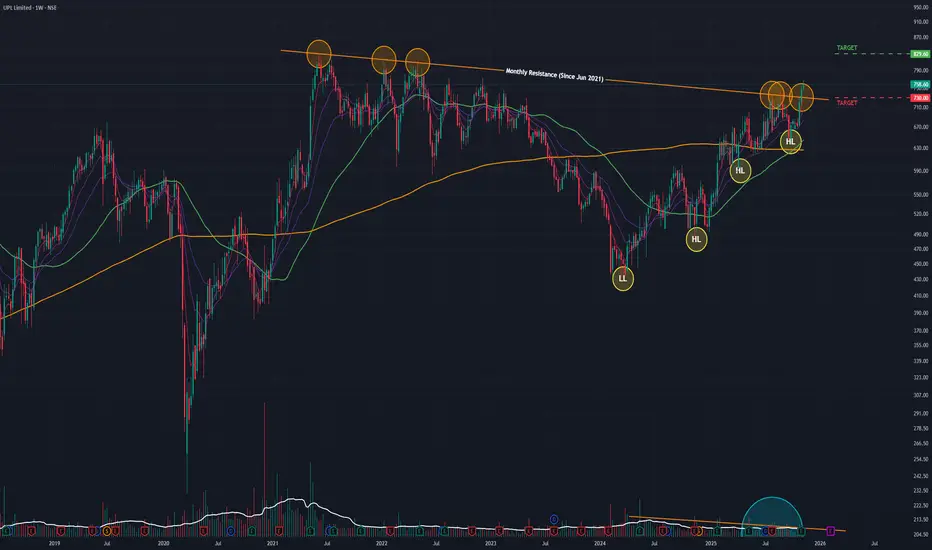
UPL (W): Strongly Bullish, Fundamentally-Driven BreakoutBased on Weekly Timeframe, Logarithmic Scale
This is a high-conviction breakout. The stock has decisively broken a 4.5-year angular resistance, driven by a blockbuster quarterly earnings report that confirmed a strong business turnaround. The alignment of high-timeframe indicators suggests a new long-term uptrend is beginning.
🚀 1. The Fundamental Catalyst (The "Why")
The technical breakout is not random. It is a direct response to strong Q2 2026 earnings :
- Strong Profitability: The company reported a 40% year-over-year growth in EBITDA and a net profit of ₹553 crore , a massive turnaround from the net loss reported in the same quarter last year.
- Upgraded Guidance: Management upgraded its full-year EBITDA growth guidance, signaling confidence in the business.
- Market Reaction: This news provided the "fuel" for the market to absorb supply and break the multi-year resistance.
📈 2. The Long-Term Setup (The "Big Picture")
- The 2021 Peak: After its ATH in June 2021 , the stock was capped by a long-term angular resistance trendline .
- The 2024 Bottom: The stock was in a corrective downtrend, which found its ultimate bottom in March 2024 .
- The Reversal: Since that low, the stock has been in a steady reversal, forming a bullish structure of Higher Lows .
- The "Lid": This recovery was repeatedly halted by the 4.5-year angular resistance, which it failed to break on previous attempts.
📊 3. The Decisive Breakout (The Past Two Weeks)
- Week of Nov 03: The stock broke out and closed above the angular resistance for the first time.
- Week of Nov 10: The stock confirmed the breakout with a gap-up open and a further 1.42% gain.
- Volume: The volume during the March 2024 uptrend was low (a "wall of worry"), but the breakout and confirmation weeks saw above-average volume ( 12.29 Million last week), confirming institutional interest.
🎯 4. Confluence of Indicators
Indicator analysis confirms the new long-term trend. This "trifecta" of bullishness on high timeframes is very powerful:
- EMAs: Short-term Exponential Moving Averages are in a "PCO" (Price Crossover) state on both the Monthly and Weekly charts.
- RSI: The Relative Strength Index is rising on both the Monthly and Weekly charts.
🧠 5. Short-Term Caution & Future Scenarios
- The "Inverted Hammer": The last daily candle of the week was an "inverted hammer." This is a sign of short-term indecision and profit-taking . It signals that while the breakout is valid, it's meeting immediate supply, and a healthy pullback or "re-test" is highly possible.
- Conclusion: The trend is now bullish, but the entry point is key.
🐂 The Bullish Case (Continuation)
- Trigger: The bullish momentum continues, absorbing the short-term profit-taking.
- Target: The next logical price target is ₹830 .
🐻 The Pullback Case (Healthy Re-test)
- Trigger: If the "inverted hammer" plays out and momentum is lost in the short term .
- Support: The price would likely fall to re-test the angular resistance-turned-support at ₹730 . A "bounce" off this level would be a classic, healthy confirmation of the breakout.
Thyrocare (W): Strongly Bullish, Multi-Year BreakoutBased on Weekly Timeframe, Logarithmic Scale
This is a textbook, high-conviction breakout. The stock has decisively broken a 4-year consolidation, backed by strong fundamentals and a powerful confluence of high-timeframe technical indicators.
📈 1. The Multi-Year Setup
- The 2021 Peak: After its ATH in June 2021 (at ~₹1,465 ), the stock entered a steep, 2-year downtrend.
- The 2023 Bottom: This trend found its bottom in March 2023 .
- The Recovery & Base: Since then, the stock has been in a 2.5-year recovery, building a massive base. This upward move was further halted by the horizontal resistance at the ₹1,465 level, which it failed to break on previous attempts.
🚀 2. The Fundamentally-Driven Breakout (Last Week)
Last week, this entire 4-year pattern changed:
- The Catalyst: Strong Q2 2026 earnings provided the "fuel" for a major move.
- The Surge: The stock surged +12.43% for the week.
- The Volume: This move was backed by a 3.45 Million share volume spike. This comes after a period of average volume, confirming institutional interest.
- The Close: The stock achieved a weekly close above ₹1,465 , confirming the breakout is not just an intraday spike.
📊 3. Confluence of Bullish Indicators
The alignment on high timeframes is exceptionally bullish:
- RSI: The Relative Strength Index is rising on both the Monthly and Weekly charts.
- EMAs: The short-term Exponential Moving Averages are in a "PCO" (Price Crossover) state on both the Monthly and Weekly charts.
- Volume: A clear spike on the breakout after a steady rise, confirming the move's validity.
🎯 4. Future Scenarios & Key Levels to Watch
🐂 The Bullish Case (Continuation)
- Trigger: If the bullish momentum continues, the stock is in a new "blue-sky" uptrend.
- Target: The next logical long-term price target is at ₹2,000 levels.
🐻 The Pullback Case (Healthy Re-test)
- Trigger: If the stock pauses to digest its 12.5% weekly gain or if the broader market pulls back.
- Support: The price would likely fall to re-test the resistance-turned-support level at ₹1,465 . A "bounce" off this level would be a classic, healthy confirmation of the breakout and an ideal entry point for those who missed the initial surge.

Borosil (W): Cautiously Bullish, Awaiting Breakout ConfirmationThis is a classic "wait and watch" scenario. The stock is in a multi-year base-building pattern, and all signs point to a significant bullish breakout. However, a formidable resistance has not yet been broken.
📈 1. The Long-Term Context
- Multi-Year Consolidation: The stock has been in a wide, sideways consolidation phase since its All-Time High (ATH) in April 2022.
- The "Lid": This entire 3.5-year pattern has been capped by a critical horizontal resistance trendline formed since December 2021 . This level is the single most important line on the chart.
🚀 2. The Current Setup (The "Battle at Resistance")
- The "Battle": For the past five weeks , the stock has been actively "battling" this multi-year resistance.
- The Failure (So Far): While there have been multiple attempts, the stock has failed to secure a weekly close above this level .
- Bullish Volume: After a long "dry period," volume is slowly rising. Crucially, these breakout attempts are being accompanied by volume spikes , showing that buyer conviction is growing.
📊 3. Confluence of Bullish Indicators
The alignment of the Monthly and Weekly timeframes is a very powerful sign:
- RSI: The Relative Strength Index is rising on both the Monthly and Weekly timeframes, showing that long-term momentum is building.
- EMAs: The short-term Exponential Moving Averages are in a "PCO" (Price Crossover) state on both the Monthly and Weekly timeframes, confirming the long-term trend is turning bullish.
🎯 4. Future Scenarios & The "Game Plan"
🐂 The Bullish Case (Confirmation)
- Trigger: We need to see a decisive weekly close above the horizontal resistance.
- Confirmation: The "gold standard" confirmation, would be a successful "re-test" —where the stock pulls back, touches the old resistance, and "bounces" off it as new support.
- Target 1: ₹840
- Target 2: ₹1,130
🐻 The Bearish Case (Breakout Failure)
- Trigger: If this 5-week "battle" results in a strong rejection and momentum is lost.
- Target: The stock will likely fall to retest its immediate support level at ₹635 .
Conclusion
The rising volume and bullish high-timeframe indicators are pressing against a multi-year resistance. The breakout, if it is confirmed, will be significant. The best approach is patience.

Ashok Leyland (D): Strongly Bullish, Blue-Sky BreakoutThis is a high-conviction, fundamentally-driven breakout. After a volatile re-test, the stock has confirmed its breakout above a key consolidation zone and is now in a "price discovery" phase, backed by exceptional volume and strong earnings.
🚀 1. The Fundamental Catalyst (The "Why")
The explosive move this week is powered by a strong Q2 2026 earnings report (announced Nov 12). The positive results and dividend declaration provided the high-conviction "fuel" for the market to absorb the failed re-test and drive the stock to a new all-time high.
📈 2. The Decisive Breakout (The "Whipsaw")
- Part 1 (The Breakout): On Nov 11 , the stock broke above the horizontal resistance from Sep 2025 (at the ₹144-₹146 level).
- Part 2 (The "Fakeout"): On Nov 12 , the stock failed its re-test, closing below this new support. This move likely trapped bearish traders.
- Part 3 (The Confirmation): Today, Nov 13 , the stock gapped up (opening above the resistance) and surged +5.53% on massive 53.62 Million volume. This powerful move creates a new all-time high and confirms the breakout is real.
📊 3. Confluence of Bullish Indicators
- Volume: The consolidation phase had below-average volume. Today's 53M+ share volume is a massive spike, confirming institutional participation.
- RSI: The Relative Strength Index is rising on the Daily, Weekly, and Monthly charts .
- EMAs: The short-term Exponential Moving Averages are in a "PCO" (Price Crossover) state on all three timeframes .
This alignment of all three timeframes, combined with the fundamental catalyst, gives this breakout a very high probability of success.
🎯 4. Future Scenarios & Key Levels to Watch
The stock is now in a "price discovery" trend.
🐂 The Bullish Case (Momentum Continues)
- Trigger: The stock is in a new uptrend with no overhead resistance.
- Target: ₹161 is the first logical objective.
🐻 The Pullback Case (Support Test)
- Trigger: If the stock pauses to digest its 5.5% single-day gain.
- Support: The price would likely fall to re-test the resistance-turned-support at ₹144 . A "bounce" off this level would be a textbook confirmation of the new support floor and an ideal entry point for those who missed the initial surge.

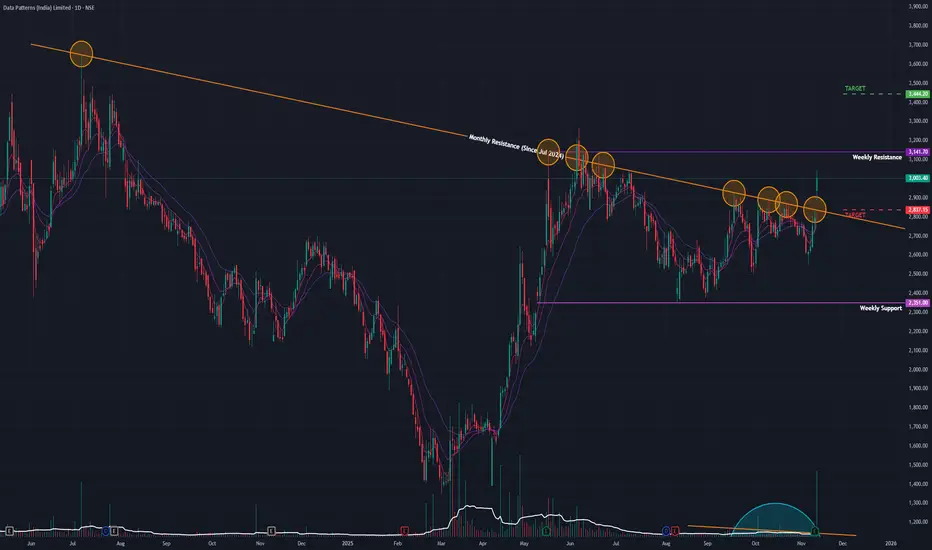
Data Patterns (D): Strongly Bullish, Fundamentally Driven BOThis is a high-conviction breakout event. The stock has decisively broken its 17-month angular resistance, driven by blockbuster quarterly earnings. All indicators are aligned, but the stock now faces its final horizontal resistance, which will determine the next major leg up.
🚀 1. The Fundamental Catalyst (The "Why")
Today's move is not speculative. It is a direct response to record-breaking Q2 2026 earnings :
- Revenue: Surged 238% year-over-year to ₹307.46 crore.
- Net Profit: Grew 62.5% year-over-year to ₹49.19 crore.
- Market Reaction: The gap-up open and +7.56% surge on 6.29 Million in volume confirms massive institutional interest.
📈 2. The Long-Term Context (The Setup)
- The 2024-2025 Correction: After its ATH in July 2024 , the stock entered a long-term downtrend.
- The Reversal: This trend found its bottom in March 2025 , and the stock began its recovery.
- The Angular Resistance: This recovery was capped by the angular resistance trendline from the July 2024 ATH.
- Drying Volume: Volume was drying up during the consolidation since May 2025—a classic sign of accumulation.
🎯 3. The Dual Resistance Battle
- Part 1 (CLEARED): Today, the stock gapped up and closed decisively above the 17-month angular resistance trendline. This is a significant bullish victory.
- Part 2 (THE NEXT HURDLE): The stock now faces a major horizontal resistance at ₹3,141 . This level is the last line of defense for the bears.
📊 4. Confluence of Bullish Indicators
This breakout is supported by a rare "trifecta" of bullish signals across all timeframes:
- EMAs: Short-term Exponential Moving Averages are in a "PCO" (Price Crossover) state on the Daily, Weekly, and Monthly charts .
- RSI: The Relative Strength Index is rising on the Daily, Weekly, and Monthly charts .
This alignment of all three timeframes gives the breakout very high technical validity.
🧠 5. Future Scenarios & Key Levels to Watch
🐂 The Bullish Case (Confirmation)
- Trigger: A decisive, high-volume close above the horizontal resistance at ₹3,141 .
- Target: This would confirm the start of a new bull run, and the target of ₹3,445 is the next logical objective.
🐻 The Pullback Case (Healthy Re-test)
- Trigger: If the stock is rejected at ₹3,141 or needs to pause after its big run.
- Support: The price would likely fall to re-test the angular trendline it just broke, at the identified level of ₹2,817 . A "bounce" off this level would be a textbook, healthy confirmation of the new support.
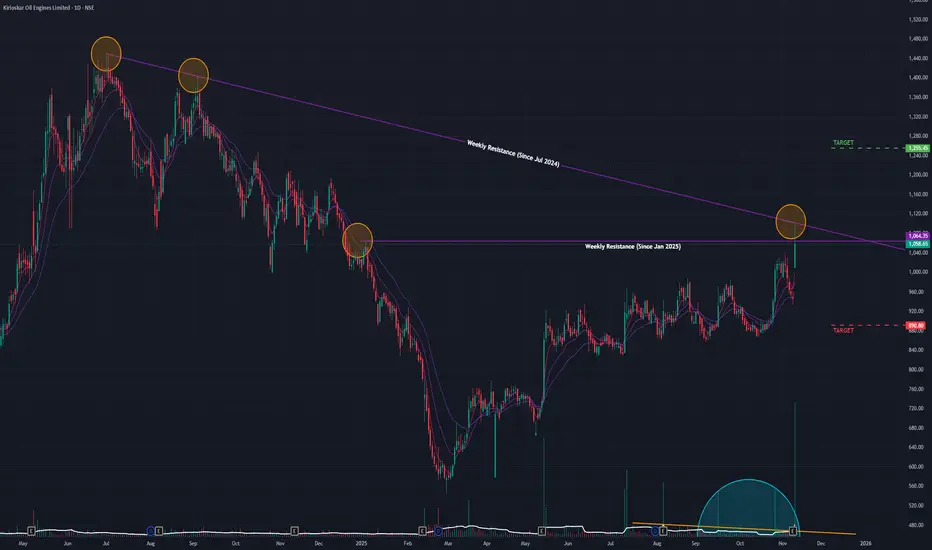
Kirloskar (D): Bullish, Awaiting Breakout ConfirmationThis is a "wait and watch" scenario. The stock is at a critical decision point. A massive fundamental catalyst (record-breaking earnings) has met a powerful technical resistance. The price-action of the next few days will be crucial.
🚀 1. The Fundamental Catalyst
Today's explosive move was fundamentally driven. The stock gapped up and surged +11.98% on 11.37 Million in volume as a direct response to its record-breaking Q2 2026 earnings (44% profit growth). This provides a strong, non-speculative a to the bullish case.
📈 2. The Long-Term Context (The Setup)
- The 2024-2025 Correction: After its ATH in July 2024, the stock entered a downtrend, which found its bottom in February 2025.
- The Recovery: Since then, the stock has been in a slow, methodical uptrend, forming a bullish structure of Higher Lows .
- Drying Volume: Volume had dried up during this slow uptrend, a classic sign of accumulation before a major move.
🎯 3. Today's Action (The "Battle at Resistance")
The stock's upward progress was blocked by a dual resistance :
1. A short-term horizontal resistance (since Jan 2025).
2. A long-term angular resistance (from the Jul 2024 ATH).
Today, the stock's gap-up broke the short-term horizontal resistance intraday , but by the market's close, sellers pushed it back down. It failed to close above this level . This "rejection" or "failed close" signals that a significant supply of sellers (profit-takers) exists at this exact point, despite the great news.
📊 4. Confluence of Bullish Indicators
Despite today's rejection, the underlying trend is powerfully bullish:
- RSI: The Relative Strength Index is rising on the Daily, Weekly, and Monthly charts .
- EMAs: The short-term Exponential Moving Averages are in a "PCO" (Price Crossover) state on all three timeframes .
This "trifecta" of bullishness across all timeframes suggests today's rejection is likely a pause, not a top.
🧠 5. Future Scenarios & Key Levels to Watch
The next few days will define the trend.
🐂 The Bullish Case (Confirmation)
- Trigger: We need to see a decisive daily close above the horizontal resistance, followed by a break of the main angular trendline.
- Target: This would confirm the breakout and open the path to the ₹1,255 level.
🐻 The Bearish Case (Rejection)
- Trigger: If today's failed close is a bull trap and the momentum is lost.
- Target: The price will likely fall to retest the primary support level at ₹890 .
Yatra Online (D): Strongly Bullish, Fundamentally-Driven BOThis is a high-conviction breakout, driven by explosive quarterly earnings. The stock has successfully broken its short-term consolidation but was temporarily rejected at its multi-year high. The underlying momentum is exceptionally strong.
🚀 1. The Fundamental Catalyst (The "Why")
The technicals are being driven by fundamentals. Today's +11.88% surge on massive 35.31 Million volume is a direct response to Yatra's record-breaking Q2 2026 earnings , which featured:
- Net Profit up 96% year-over-year.
- Revenue up 48% year-over-year.
- A raised full-year EBITDA guidance from the company.
📈 2. The Long-Term Context (The Setup)
- The Bottom & Reversal: After making its all-time low in March 2025 , the stock has been in a strong, sustained uptrend.
- The Consolidation: From August 2025, the stock entered a sideways trend, building a base for its next move. Volume was declining during this period—a classic sign of accumulation.
🎯 3. Today's Action (The "Two-Resistance Battle")
Today's price action was a textbook example of a breakout hitting two resistance levels:
- Resistance 1 (CLEARED): The short-term horizontal resistance from September 2025 (at ~₹172 ). The stock decisively broke and closed above this level.
- Resistance 2 (REJECTED): The long-term horizontal resistance from January 2024 (the previous multi-year high). The stock breached this level intraday to make a new ATH, but failed to close above it . This is a key sign of selling pressure or profit-taking at the old high.
📊 4. Key Technical Indicators
Indicator analysis confirms the bullish power across all timeframes:
- RSI: The Relative Strength Index is rising on the Daily, Weekly, and Monthly charts .
- EMAs: The short-term Exponential Moving Averages are in a "PCO" (Price Crossover) state on all three timeframes .
🧠 5. Future Scenarios & Key Levels to Watch
The path forward is now clearly defined by the two resistance levels identified.
🐂 The Bullish Case (Confirmation)
- Trigger: The stock must now get a decisive daily close above the long-term resistance (the Jan 2024 high it was rejected from today).
- Target: Once it clears that final hurdle, the path is open to price target of ₹205 .
🐻 The Pullback Case (Healthy Re-test)
- Trigger: If the stock is unable to continue the immediate momentum (due to the rejection) and pulls back.
- Target: The price will likely fall to re-test the resistance-turned-support at ₹172 . A "bounce" off this level would be a textbook, healthy confirmation of the breakout and a new buying opportunity.

Nestle India – Retest Before the Final Push HigherNestle India appears to be unfolding a clean five-wave impulsive structure. After a powerful Wave 3 rally backed by strong volume expansion, the stock has entered a typical mid-trend pause — a falling wedge consolidation representing Wave 4.
The correction has so far retraced near the 0.382 Fibonacci level around ₹1,247, perfectly aligning with the prior breakout zone from Wave 1 highs. This overlap suggests that the current dip is more of a healthy retest than a trend reversal.
As long as the price action holds above ₹1,238.20, the bullish structure remains valid. A breakout above ₹1,311 — the Wave 3 high — would likely trigger Wave 5, opening room for upside continuation toward the ₹1,340–₹1,360 zone.
Both the 100-day and 200-day SMAs are sloping upward, reinforcing the medium-term bullish bias. Meanwhile, RSI remains steady in the 60 range, showing no signs of exhaustion — exactly what you want to see before a possible Wave 5 extension.
In short: the setup is healthy, confluence is strong, and risk is clearly defined. A decisive move above ₹1,311 could mark the start of Nestle’s next leg higher.
Invalidation: Below ₹1,238.20
Bias: Bullish continuation (Wave 5)
Timeframe: Daily
Disclaimer: This analysis is for educational purposes only and does not constitute investment advice. Please do your own research (DYOR) before making any trading decisions.

Bharat Forge (D): Strongly Bullish, Multi-Resistance BreakoutThis is a high-conviction breakout event. The stock has decisively broken out of a 17-month corrective pattern, shattering two major resistance levels simultaneously. This move is supported by a powerful confluence of bullish indicators across all timeframes and is underpinned by strong fundamental results.
📈 1. The Long-Term Context
- The Correction: After hitting its All-Time High (ATH) in June 2024 , the stock entered a 10-month corrective downtrend.
- The Reversal: This trend reversed in April 2025 , and the stock began a new recovery.
- The Consolidation: This recovery was capped by two distinct resistance levels, forcing the stock into a consolidation phase where, volume was drying up (a sign of accumulation).
🚀 2. The Decisive Breakout (Today's Action)
Today, the stock broke this stalemate with explosive force:
- The Surge: A powerful +5.55% rally on high-conviction volume of 4.81 Million shares.
- The Dual Breakout: This move shattered both key resistance levels at once:
1. The long-term angular resistance (from the June 2024 ATH).
2. The short-term horizontal resistance (from June 2025, at the ₹1,362 level).
- The Catalyst: This technical breakout is supported by strong Q2 earnings, which act as a fundamental driver, giving the move a higher probability of success.
📊 3. Confluence of Bullish Indicators
This breakout is not isolated. It is confirmed by a rare "trifecta" of bullish signals on Daily, Weekly, and Monthly timeframes:
- RSI: The Relative Strength Index is rising on all three timeframes .
- EMAs: The short-term Exponential Moving Averages are in a "PCO" (Price Crossover) state on all three timeframes .
- SMAs: A recent SMA Golden Cross (50-day crossing 200-day) is active, confirming the new long-term uptrend.
🎯 4. Future Scenarios & Key Levels to Watch
This breakout provides a very clear road map based on identified levels:
🐂 The Bullish Case (Momentum Continues)
- Trigger: If the current momentum is sustained, the stock is in a new uptrend.
- Target 1 (Short-Term): ₹1,525
- Target 2 (Medium-Term): ₹1,625
🐻 The Pullback Scenarios
- Scenario A (Healthy Re-test): The momentum pauses, and the stock pulls back to test the "resistance-turned-support" level at ₹1,362 . A bounce from here would be a textbook confirmation and a secondary buying opportunity.
- Scenario B (Breakout Failure): If the breakout is a "fakeout," the stock will fail to hold ₹1,362 and will likely fall to the next major support level at ₹1,305 .

Torrent Pharma (D): Strongly Bullish, Blue-Sky BreakoutThis is a high-conviction breakout. The stock has broken out of a 4-month consolidation, setting a new all-time high on high volume. The move is strongly supported by all indicators and a powerful fundamental catalyst.
📈 1. The Dominant Pattern: ATH Breakout
- The Consolidation: After making its previous ATH in July 2025, the stock entered a 4-month sideways trend.
- The "Lid": A horizontal resistance line formed at this ATH (approx. ₹3,787 ) restricted all forward movement.
- Volume Contraction: Volume was "drying up" during this consolidation phase. This is a classic bullish sign of seller exhaustion and accumulation.
🚀 2. The Decisive Breakout (Today's Action)
- The Surge: Today, the stock shattered this resistance with a 6.63% surge , backed by a high-conviction volume of 1.65 Million shares.
- The New ATH: This move resulted in a new all-time high, pushing the stock into a "blue-sky" price discovery phase.
- The Catalyst: This technical move is not speculative. It is driven by strong Q2 2026 earnings (30% profit growth), confirming that institutions are buying on good news.
📊 3. Key Technical Indicators
Indicator analysis confirms the bullish momentum across all timeframes:
- RSI: The Relative Strength Index is rising on the Daily, Weekly, and Monthly charts .
- EMAs: The short-term Exponential Moving Averages are in a "PCO" (Price Crossover) state on all three timeframes.
🎯 4. Future Scenarios & Key Levels to Watch
⚠️ A Note of Caution (The "Fakeout" Risk)
The risk is a "bull trap" or "fakeout." The correct thing to watch for, is bearish divergence (i.e., if the stock makes another new high, but the RSI makes a lower high).
🐂 The Bullish Case (Confirmation)
- Confirmation: The ideal "textbook" move would be a re-test . We want to see the stock pull back to the ₹3,787 level and "bounce," confirming the old resistance has become new support.
- Target: If the bullish momentum continues, the next logical target is ₹4,100 .
🐻 The Bearish Case (Breakout Failure)
- Trigger: The breakout fails, and the stock loses momentum (a "bull trap").
- Confirmation: The price falls and closes back below the ₹3,787 support level, invalidating the breakout.

Trent Ltd – Double Zigzag Correction in PlayAfter topping out at ₹8,345, Trent has been locked in a larger corrective structure that now appears to be unfolding as a W–X–Y double zigzag on the weekly chart.
Wave Count
Wave W bottomed at ₹4,715 as a clear ABC.
The rally to ₹6,261 completed Wave X.
Price is now progressing in Wave Y, where:
Wave A has unfolded,
Wave B topped at ₹5,674,
Wave C is expected to continue lower.
Key Levels
Target 1 (1.0 extension): ₹4,370
Target 2 (1.618 extension): ₹3,565
Stop-loss / Invalidation:
Trading level: ₹5,674 (Wave B high)
Structural level: ₹6,261 (Wave X high)
RSI Check
RSI remains below 50, confirming bearish momentum.
Conclusion
The correction appears incomplete with scope for another leg down before a larger recovery can begin. While the working invalidation sits at ₹5,674, structurally the bearish count holds until ₹6,261 is broken.
Disclaimer: This analysis is for educational purposes only and does not constitute investment advice. Please do your own research (DYOR) before making any trading decisions.

Sobha (W): Bullish, Breakout ConfirmationThe stock has decisively broken a 17-month angular downtrend line, signaling a major change in character. The underlying momentum on higher timeframes (Weekly & Monthly) is strong, suggesting this is the start of a new bullish leg.
📈 1. The Long-Term Context
- The 2024 Peak: After hitting its All-Time High (ATH) in June 2024 , the stock entered a prolonged 10-month correction.
- The 2025 Bottom: This downtrend found its bottom in April 2025 , and the stock has been in a reversal/recovery phase since.
- The Resistance: This recovery was consistently blocked by a strong, angular resistance trendline formed from the June 2024 ATH.
🚀 2. The Decisive Breakout (This Week's Action)
This week, the 17-month pattern was broken:
- The Move: The stock decisively broke out and closed above this long-term angular resistance trendline for the first time.
- The Surge: This breakout was confirmed with a +5.10% surge for the week, backed by 1.2 Million in total weekly volume.
- Volume Context: This breakout comes after a period of low, consolidating volume, which often precedes a significant move.
📊 3. Key Technical Indicators
The underlying momentum on higher timeframes strongly supports this breakout:
- EMAs: Short-term Exponential Moving Averages are in a "PCO" (Price Crossover) state on both the Monthly and Weekly charts, confirming a bullish trend.
- RSI: The Relative Strength Index is rising on both the Monthly and Weekly timeframes, showing that buying strength is building and sustaining.
🎯 4. Future Scenarios & Key Levels to Watch
This breakout provides a clear road map based on identified levels:
🐂 The Bullish Case (Momentum Continues)
- Trigger: If the current momentum is maintained, the breakout is confirmed.
- Target: The first major target is the ₹2,060 level, which represents the next significant resistance zone near the 2024 highs.
🐻 The Bearish Case (Re-test Scenario)
- Trigger: The initial momentum is lost, and the stock pulls back to verify the breakout.
- Confirmation: A "re-test" where the stock drops to touch the old resistance trendline, which should now act as new support.
- Support: This re-test level is at approximately ₹1,620 . A bounce from this level would be a secondary, high-conviction buy signal.

Thangamayil (M): Strongly Bullish, Blue-Sky BreakoutThis is a high-conviction breakout. The stock has broken out of a year-long consolidation base, created a new all-time high, and is supported by explosive volume and powerful fundamental results.
📈 1. The Long-Term Context (The "Big Picture")
- Logarithmic View: On a long-term logarithmic chart, this move is a continuation of a major uptrend.
- The Consolidation: After hitting its previous All-Time High (ATH) in October 2024, at ₹2,567.50, the stock entered a year-long sideways consolidation.
- Drying Volume: During this phase, volume "dried up," which is a classic bullish sign of seller exhaustion and accumulation by new buyers.
🚀 2. The Decisive Breakout (The November 2025 Event)
- The Surge: In the first week of November 2025, the stock shattered this consolidation with a massive +40.17% surge.
- High-Conviction Volume: This move was backed by exceptional, non-speculative volume of 3.67 Million shares, confirming strong institutional interest.
- New ATH: This surge pushed the stock into "price discovery" mode, creating a new all-time high.
📊 3. The Fundamental Catalyst (Why it's Breaking Out)
This powerful technical breakout is fully supported by blowout fundamental news, which gives the move high validity:
- Massive Profit: The company reported a sharp Q2 profit turnaround (from a net loss last year to a ₹58.5 Cr net profit).
- Record Sales: The company also announced record-breaking sales in October , crossing the ₹1,000 Cr mark for the first time in a single month.
🎯 4. Future Scenarios & Key Levels
- Bullish Indicators: The short-term EMAs are in a PCO state and the RSI is rising , confirming the momentum is strong and on the side of the buyers.
🐂 The Bullish Case (Price Discovery)
- Trigger: If this momentum is sustained, the stock is in "blue-sky" territory with no overhead resistance.
- Target: Projected target of ₹4,150 is a logical next-level based on technical extensions.
🐻 The Pullback Case (Support Test)
- Trigger: If the momentum pauses or a pullback occurs (which is healthy after a 40% surge).
- Support: The most critical level to watch is the old resistance-turned-support zone at ₹2,560 - ₹2,570 . A re-test and "bounce" off this level would be a textbook confirmation of the new support and an ideal entry point for those who missed the initial breakout.

Hero MotoCorp: Wedge Signals Wave 5 ExhaustionAfter a strong five-wave impulse from ₹3,344 to ₹5,717, Hero MotoCorp appears to have completed a textbook rally, with Wave (5) showing all signs of exhaustion.
The final leg developed into a rising wedge , a common terminal pattern that often precedes short-term pullbacks. Momentum loss is also visible on the RSI , which has been forming lower highs within a descending channel — a classic sign of fading strength.
From an Elliott Wave perspective, the advance from Wave 4 (₹4,195) to Wave 5 (₹5,717) aligns closely with the 1.0 Fibonacci projection of internal Wave (1), suggesting a complete internal impulse.
Should a correction unfold, the 0.382–0.5 retracement zone (₹4,810–₹4,530) — measured from the entire rally (₹3,344–₹5,717) — could become a potential accumulation area for the next bullish sequence (Wave 2 or B).
Summary :
Wave 5 likely completed inside a rising wedge
RSI bearish divergence confirms exhaustion
Next potential buy zone: ₹4,810–₹4,530
Structure remains bullish over the long term, but a short-term correction looks due
Disclaimer:
This analysis is for educational purposes only and does not constitute investment advice. Please do your own research (DYOR) before making any trading decisions.

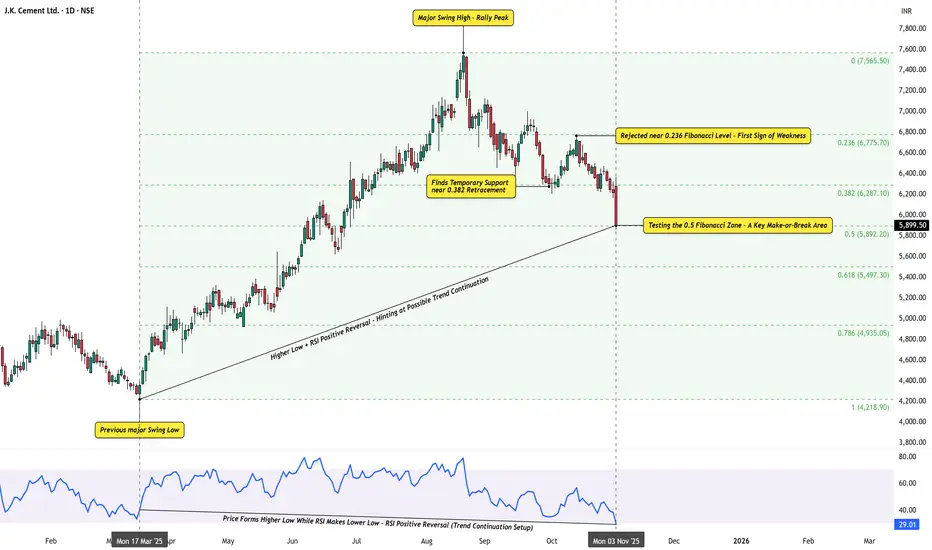
Fibonacci in Action – A Lesson from J.K. CementFibonacci retracement is one of the simplest yet most consistent tools for studying how markets correct within trends.
To understand it better, here’s a clean example from J.K. Cement .
After a strong uptrend from the March 2025 swing low to ₹7,565 , the stock began to retrace. Notice how price behavior respected the Fibonacci structure:
It bounced from the 0.382 level , illustrating a temporary reaction point.
Later, it faced resistance near 0.236 , where rallies often stall during corrective phases.
The 0.5 retracement zone now serves as a classic testing ground that often helps define trend continuation or deeper correction.
Even the RSI pattern offers insight — price forms a higher low while RSI makes a lower low, a textbook positive reversal setup that often aligns with trend studies.
The purpose of this example isn’t prediction, but to show how Fibonacci ratios and RSI behavior interact — highlighting rhythm, structure, and market psychology in motion.
Disclaimer: This analysis is for educational purposes only and does not constitute investment advice. Please do your own research (DYOR) before making any trading decisions.
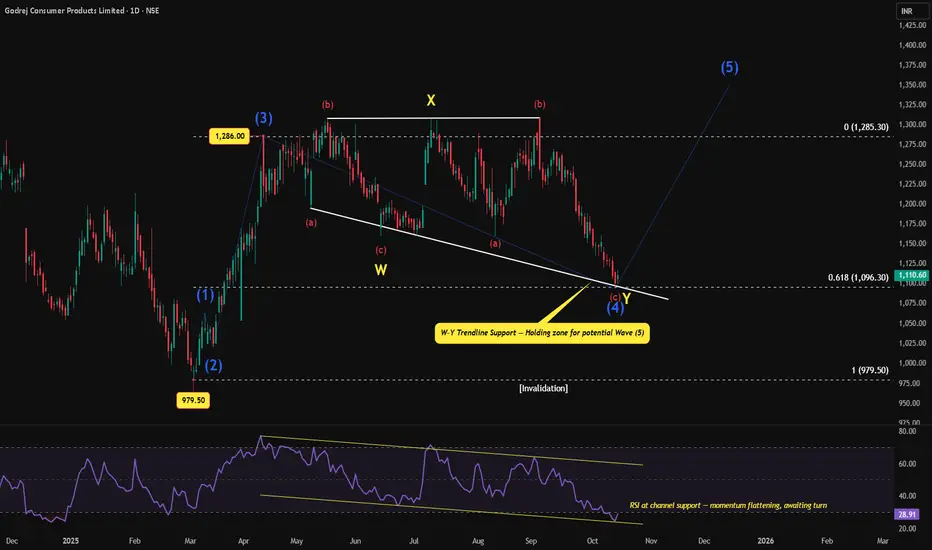
Godrej Consumer Products: Wave (4) Double Combo Testing SupportWave (4) seems to have evolved as a double combination (W–X–Y), with prices now testing the W–Y trendline support near the 0.618 retracement (~₹1,096).
The structure has been slow and overlapping — typical of a Wave (4) correction.
RSI too rests at channel support , hinting at momentum exhaustion.
A steady hold above this zone could pave the way for Wave (5) , but confirmation is still pending.
Invalidation remains below ₹979.50 .
Strategy:
Watch price behavior near the current support zone. Patience here pays more than prediction.
Disclaimer:
This analysis is for educational purposes only and does not constitute investment advice. Please do your own research (DYOR) before making any trading decisions.