Euro Slips Further as Safe-Haven Demand for USD GrowsThe EUR/USD pair is facing strong selling pressure as global financial markets continue to reel from geopolitical and trade-related tensions. The Euro is weakening as investors increasingly turn to the U.S. Dollar as a safe haven, following a series of aggressive tariff policies announced by the United States.
Adding to the Euro’s struggles is the lack of positive economic data from the Eurozone, which has further diminished hopes for a meaningful recovery. Traders are now closely watching for monetary policy signals from both the ECB and the Federal Reserve, but so far, the bearish trend remains firmly in place.
On the technical front, EUR/USD continues to move within a descending channel, while the bearish crossover of the EMA 34 and 89 keeps sellers in control. With risk sentiment leaning defensive and capital flowing toward safe-haven assets, the pair may see further downside unless surprise bullish catalysts emerge from upcoming data or central bank remarks.
M-signal

EUR/USD Under Pressure: Will the Downtrend Continue?The EUR/USD exchange rate remains under pressure today, fluctuating below the 1.1700 level as the U.S. dollar gains strength following President Trump's announcement of new tariff letters directed at his two largest trade partners, boosting demand for safe-haven assets.
The downtrend may be further reinforced in the near term, if not in the short run. On the chart, a wedge pattern is forming, and breaking this pattern could add fresh momentum to EUR/USD.
Do you agree with my view?
Leave your comments below and don’t forget to like the post for extra luck!

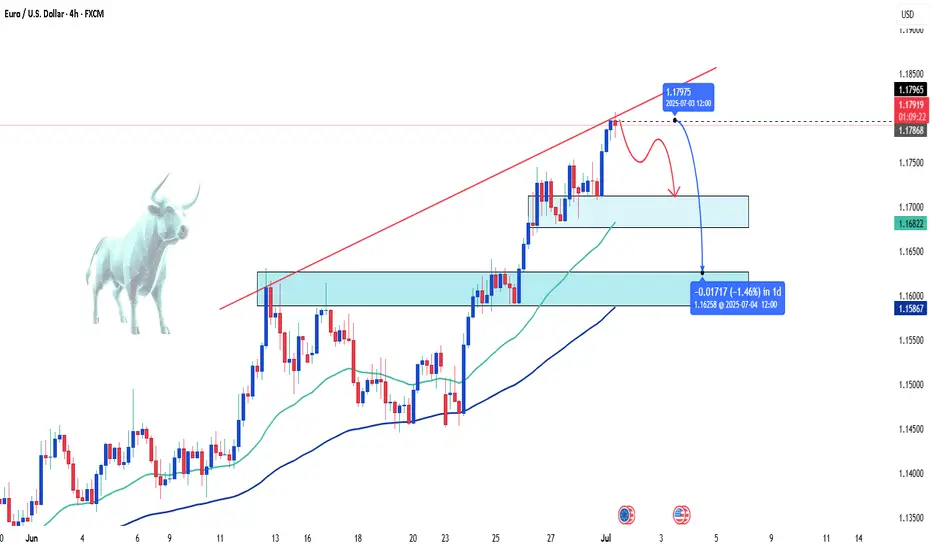
EUR/USD Faces Strong Sell-off, Is a Deeper Correction Coming?The FX:EURUSD pair continued its sharp decline this morning, currently trading around 1.161, after breaking through the bullish wedge pattern on the daily chart. This key technical signal suggests that the previous uptrend has ended, opening the possibility for a deeper correction in the short term. The inability to hold the 1.171 resistance after two attempts further confirms the ongoing downtrend.
The selling pressure is driven by the strong recovery of the USD, as investors seek refuge in safe-haven assets amid concerns about global growth and geopolitical instability. Additionally, U.S. bond yields have rebounded following strong economic data, reducing the appeal of the euro. The expectation that the Fed will maintain high interest rates for a longer period also contributes to the downward pressure on EUR/USD.
In the short term, if EUR/USD fails to hold the 1.158 support, there is a high likelihood of a drop towards 1.140, a level that acted as strong support in the past. Traders should closely monitor signals from the Fed and the upcoming PMI data for the Eurozone to assess the next trend direction.

Gold Faces Pressure as USD Strengthens – A Buying Opportunity?Gold prices have seen a slight decline today compared to yesterday’s trading session, fluctuating around 3,328 USD after losing over 43 USD in just one session.
The main factors contributing to this drop are:
-USD Strength: The USD Index rose by 0.56%, making gold more expensive for investors holding other currencies.
-Rising U.S. Bond Yields: U.S. Treasury yields surged to nearly 4.5%, drawing money away from the gold market.
-U.S. CPI for June: The CPI met expectations, easing inflation fears and reducing the demand for gold as a safe-haven asset.
Despite the short-term pressure, investors remain hopeful that the Fed will cut interest rates in September, potentially providing a boost for gold.
Personal assessment: While gold is currently in a correction phase, its long-term trend remains intact. This could be a buying opportunity if you believe in the upcoming monetary easing cycle.
What do you think about gold’s price today? Let us know in the comments!

Gold Price Today: Uptrend or Correction?The price of gol today is showing mixed trends, with key factors affecting the market. Expectations around Federal Reserve monetary policy and important economic data, such as CPI and unemployment rate, are directly influencing the precious metals market. Additionally, global political tensions and the strengt continue to play a significant role in gold's direction.
Gold remains a safe-haven asset amid economic uncertainty, but fluctuating interest rates and market volatility could lead to unpredictable movements.
Current Trend: Gold may experience a slight correction if economic data turns positive and the USD strengthens, but it still remains an attractive long-term asset due to global uncertainty and inflation.

Gold Finds Strength in UncertaintyGold prices surged for the fourth consecutive session after U.S. President Donald Trump announced a new wave of tariffs — including a 35% import tax on Canadian goods and threats of 15–20% tariffs on other major trade partners. Previously, the U.S. had already imposed a 50% tariff on copper and Brazilian imports. These aggressive trade measures have reignited fears of a global economic slowdown, prompting investors to seek refuge in gold.
As a result, gold is increasingly viewed as a buying opportunity, with many prioritizing safety over chasing equity market highs.
Adding to the bullish case, expectations of a Federal Reserve rate cut — reinforced by comments from Fed officials Waller and Daly — have further boosted the metal’s appeal.
In summary, the mix of rising trade tensions and a dovish monetary outlook is providing strong short-term support for gold’s upward momentum.

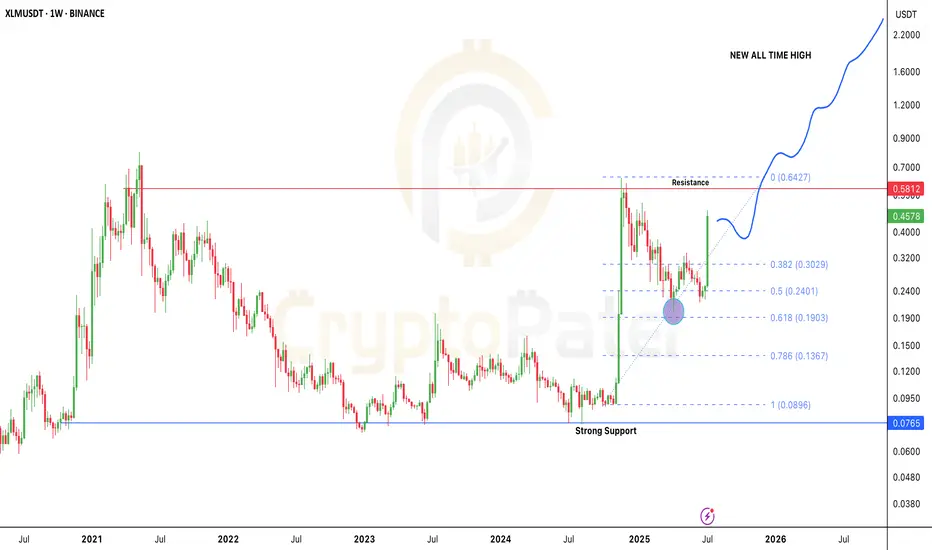
Stellar Breakout: Is $XLM the Next 10x Altcoin of 2025?After months of sideways action and accumulation, Stellar is finally showing real strength.
In the last 4 weeks alone, CRYPTOCAP:XLM has pumped over 120%, bouncing perfectly from the key 0.618 Fibonacci level near $0.19 — a classic reversal zone.
Here’s what’s really going on 👇
🔹 Back in Nov 2024, CRYPTOCAP:XLM went from $0.09 to $0.6374 in just 30 days — that’s a 600% move!
🔹 After that huge rally, price corrected nearly -68%, landing right at the golden Fib zone.
🔹 And guess what? Buyers stepped in hard, flipping the trend back to bullish.
Could we see a pullback?
Sure — maybe a small dip toward $0.30 (0.382 Fib). That’s normal. But the overall structure looks super bullish right now.
Major Resistance: $0.58
If that breaks and flips into support — we’re likely headed toward $2–$5 in the next wave.
This is one of the cleanest macro charts in the altcoin market right now.
👇 Drop your XLM target for this bull run in the comments!
Let’s see who’s aiming for the moon.
Note: DYOR & NFA
Gold Struggles Under Tariff Pressure Hello everyone, great to see you again!
Today, OANDA:XAUUSD remains under notable pressure as the U.S. continues to signal a tougher trade stance. The latest move: the U.S. President announced a 50% import tariff on copper and a potential 200% tariff on pharmaceuticals, following a previous tariff notice ranging from 25% to 40% sent to 14 countries — including Japan, South Korea, Thailand, and Malaysia.
This isn’t just about protectionism. These measures fuel fears of global inflation, supply chain disruptions, and a broader economic slowdown. With surging prices in raw materials and essential goods, consumers may be forced to cut back spending, a classic warning sign for future growth.
In this environment, investors had hoped gold would shine again as a safe haven asset. However, the recent bullish momentum has been underwhelming, signaling ongoing market hesitation.
📉 On the H4 chart, XAUUSD is being squeezed into a descending pattern, which typically carries a high probability of a downside breakout. If the current support fails, the next target could fall below the 32xx area.
On the flip side, if supportive news emerges — such as a hint of rate cuts from the Fed — gold must break above the $3,335 level to revive bullish sentiment.
🔎 What do you think? Will gold break lower — or bounce back? Drop your thoughts below!

EUR/USD Slides as Trade Tensions WeighThe EUR/USD pair extended its steady decline on Thursday, approaching the weekly lows as global financial markets remained under pressure from aggressive U.S. tariff announcements. The U.S. President unveiled new tariffs on copper — a key industrial commodity — and signalled upcoming restrictions on the pharmaceutical sector.
A mix of inflation concerns, supply chain disruptions, and continued strength in the U.S. dollar has put the euro under visible pressure. From a technical standpoint, EUR/USD remains in a downward correction phase after pulling back from multi-year highs, with bearish momentum holding firm.
Unless a surprise emerges from economic data or monetary policy shifts, the short-term bias is likely to remain tilted to the downside.

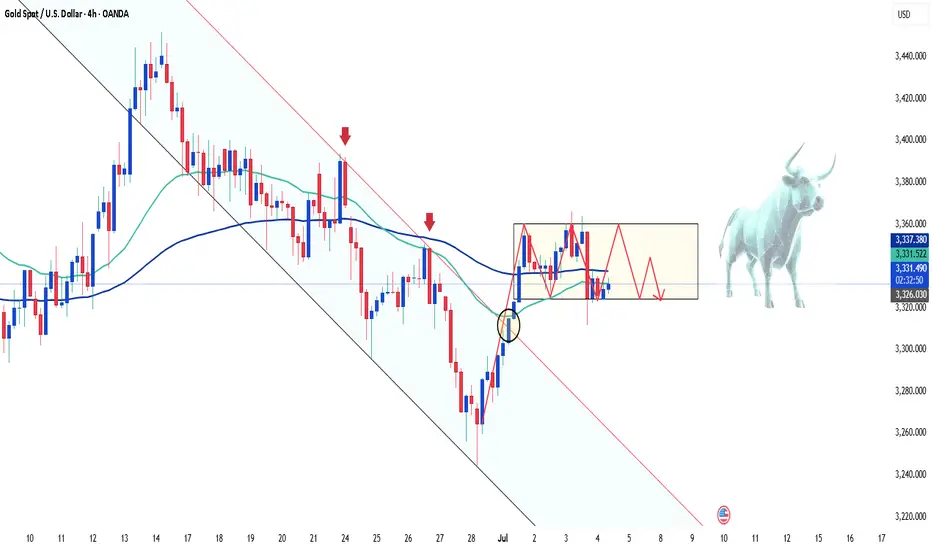
Gold Finds Support as Tariff Tensions RiseHello everyone! What’s your take on XAUUSD today?
OANDA:XAUUSD is showing a mild recovery, currently trading around $3,323, gaining over 100 pips on the day. Despite this bounce, the short-term structure still leans in favour of the bears.
On July 9th, President Biden announced a 50% tariff on copper and a projected 200% tariff on pharmaceuticals, following earlier notices of 25–40% tariffs imposed on 14 countries including Japan, South Korea, Thailand, Laos, and Malaysia.
This escalation has led to a sharp rise in international copper prices and reignited fears of global inflation, supply chain disruptions, and slower economic growth. As consumers cut back and companies face contract renegotiations, financial risk is spreading across global markets.
In this climate, investors are returning to gold as a safe haven, seeking capital protection in anticipation of broader market instability.
📈 Outlook: Gold prices may continue to rally in the short term if the U.S. unveils further tariff measures or reveals new negotiation drafts in the coming days.

Bad News Piling Up – EURUSD Under Heavy PressureEURUSD is slipping fast as a wave of negative news hits the Eurozone. Service PMIs in both Germany and France have weakened, signaling a clear slowdown in the region’s economy. This has sharply reduced expectations of further rate hikes from the ECB.
Meanwhile, Fed officials are doubling down on their hawkish tone, stressing that U.S. inflation remains sticky and interest rates may need to stay higher for longer.
The growing policy divergence between the ECB and the Fed is becoming undeniable – and that’s exactly why EURUSD continues to slide.

Gold at a Crossroads – Rebound or Breakdown?Gold just faced a sharp sell-off as optimism surged around a potential trade truce. After President Trump announced a 25% tariff on Japan and South Korea, the deadline was surprisingly pushed to August 1st, giving countries room to negotiate. That pause eased market fears and triggered a short-term risk-on sentiment.
But the real pressure came from a stronger US Dollar and 10-year Treasury yields hitting a two-week high – a deadly combo for gold, which offers no yield. The shift in capital flow toward safer, interest-bearing assets pushed gold further into the red.
Now, all eyes are on the upcoming Fed minutes and speeches from key officials this week. If the tone is hawkish, gold could lose further ground. But a dovish hint might spark a bounce from the $3,290 support zone.

EURUSD - Sideways Action Sparks Reversal SpeculationHello traders, what are your expectations for EUR/USD?
Today, EUR/USD continues to move sideways around the 1.1800 mark during Thursday’s European session. The pair is showing signs of caution as the US Dollar gains ground amid optimism over a US–Vietnam trade deal.
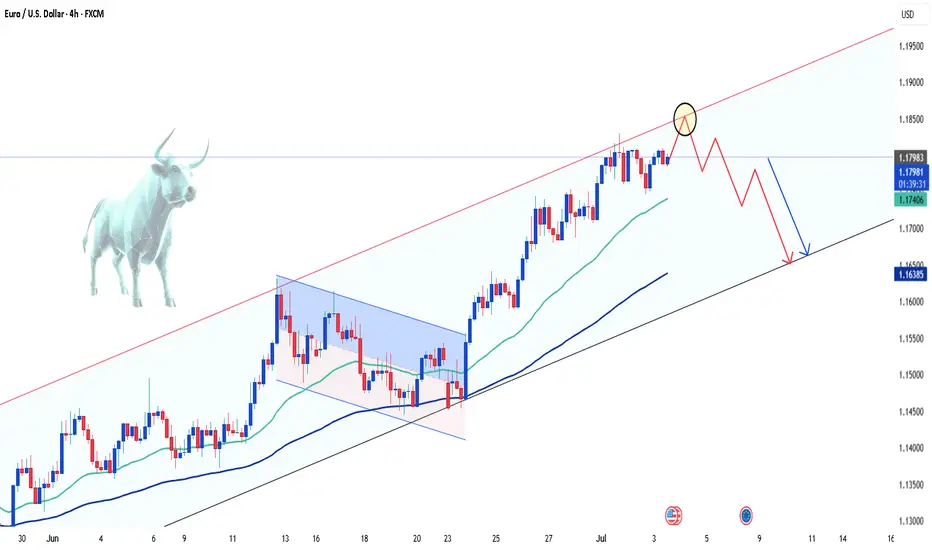
From a technical perspective, the bullish trend still dominates as the price remains within an upward channel. However, a short-term pullback could be on the horizon, especially with buying momentum fading as EUR/USD approaches the upper boundary of the channel.
What do you think—could a reversal be forming from this zone?
Drop your thoughts in the comments!
Happy trading, everyone!
Caution Prevails as EUR/USD Tests Downtrend LimitsToday, EUR/USD continues to hover around 1.1780, following a mild downtrend amid ongoing economic uncertainty. With a light economic calendar and looming deadlines surrounding U.S. trade tensions—particularly with Europe—traders are steering clear of aggressive positions.
Despite the structurally weak U.S. dollar due to expectations that the Federal Reserve may cut interest rates, there is no clear bullish momentum for the euro, largely because of mixed signals from the European Central Bank (ECB).
As long as the pair fails to break through the technical resistance near 1.1760—the upper boundary of the current price channel—sellers maintain the upper hand.

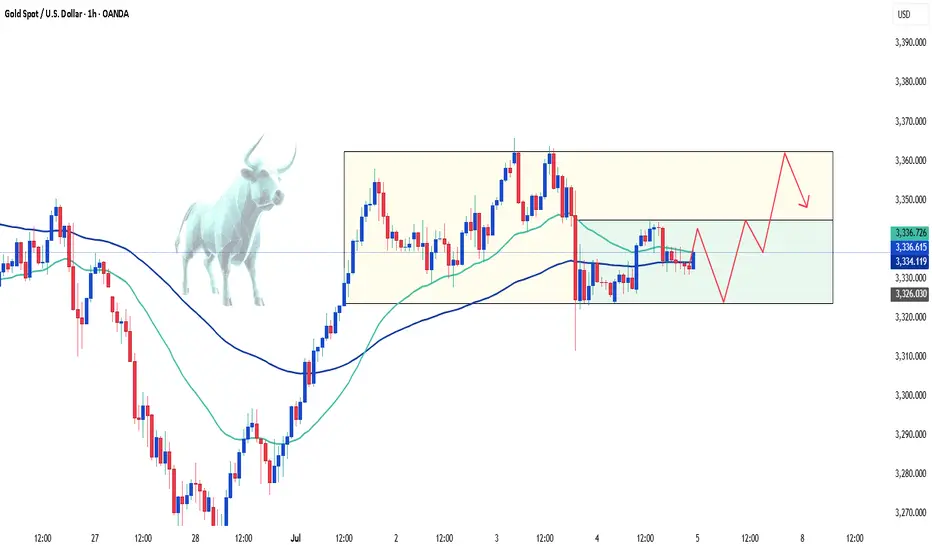
Gold Rebounds Sharply Amid Fed Bets and Risk-Off ShiftsYesterday, the precious metal faced selling pressure as investor risk appetite improved following record highs in major U.S. stock indices.
However, that bearish trend is quickly reversing due to renewed dip-buying activity. Early this morning, gold is trading around $3,335, marking a sharp rebound of over $40 from the previous session.
Expectations of Fed rate cuts and concerns over U.S. fiscal health continue to weigh on the USD, while geopolitical risks may further support the safe-haven appeal of gold.
📊 Key Economic Events to Watch This Week
Tuesday: Reserve Bank of Australia’s monetary policy meeting
Wednesday: FOMC minutes from June’s Fed meeting
Thursday: U.S. weekly jobless claims data
Stay alert – volatility may rise as these events unfold.

EUR/USD: Waiting for the Next Move – What’s Your Take?Hello traders, let’s dive into EUR/USD with Kevinn!
📈 Market Update:
The euro is currently under pressure following dovish remarks from ECB officials, which have increased expectations that interest rates will remain unchanged for a prolonged period. Meanwhile, the US dollar is showing mild weakness as markets begin pricing in potential Fed rate cuts later this year — though the shift hasn't been strong enough to trigger a breakout in EUR/USD.
Upcoming CPI reports will be crucial in shaping future monetary policy expectations and could define the short-term direction of this currency pair.
🧠 Personal Take:
EUR/USD is trading around the 1.0720 zone, with market momentum currently lacking. A short-term pullback toward the support zone near the 34 and 89 EMA is possible. However, from a technical standpoint, the long-term bullish structure remains intact — at least for now.
So what do you think about EUR/USD's direction? Drop your opinion below!
EUR/USD Stuck in Tight Range as Tariff Deadline LoomsEUR/USD remains confined within a narrow range around 1.1780, continuing its sideways movement. Market participants are adopting a cautious stance, and the pair’s upside potential appears limited as the U.S. tariff deadline approaches.

Gold Slips Sharply to Start the Week – What’s Next?Hello everyone! What are your thoughts on gold today?
As the new trading week kicks off, gold has taken a sharp dive, shedding over 200 pips and currently hovering around $3,316 at the time of writing.
The short-term bearish momentum remains intact, especially after breaking below the key $3,325 support level. The confluence of the EMA 34, EMA 89, and the former support-now-resistance zone forms a critical ceiling. Unless the bulls manage to reclaim this area, the downward trend is likely to persist, keeping sellers in control.
So, what’s your outlook for gold? Is this just a dip—or the start of a deeper correction?

Trade Setup – SELL GOLD (XAU/USD)✅ Trade Setup – SELL GOLD (XAU/USD)
📅 Date: July 7–10, 2025
🕒 Timeframe: 1H (Hourly)
🎯 Trade Parameters:
Sell Entry Zone: 3,322 – 3,330 USD/oz (previous support turned resistance + MA20 + Fibonacci 0.236)
Stop Loss (SL): 3,336 USD (above local resistance and moving average)
Take Profit (TP):
• TP1: 3,260 USD (near Fibonacci 0.618 and historical support)
• TP2: 3,168 – 3,160 USD (deeper support zone and Fibo 0.786)
📊 Technical Analysis:
Price has broken the short-term ascending trendline and is testing from below — suggesting a potential bearish continuation.
Recent candles closed below the 20 & 50-period moving averages, showing weak upside momentum.
Volume rises during bearish moves, and shrinks on retracements — indicating sellers are in control.
Bollinger Bands are expanding downward, confirming momentum is building to the downside.
🧭 Trading Strategy:
Wait for price to retest the 3,322–3,330 zone with bearish confirmation (e.g., engulfing, pin bar).
Partial take profit at 3,260, and hold remainder for TP2 if breakdown continues.
Place strict SL at 3,336 to minimize risk if resistance breaks.

Gold Holds the Line and Rallies – A Strong Weekly Close in SightAfter holding firm at the support level around $3,250 per ounce, gold is on track to end this shortened trading week with a notable gain. This is an encouraging sign for investors, highlighting that gold’s appeal remains strong despite recent volatility.
The recent sell-off was not entirely unexpected, as the market recalibrates its interest rate expectations. However, the long-term bullish trend for gold remains intact, even as the price consolidates within a narrow range.
Is EURUSD About to Reverse? Key Support in DangerHello traders, what are your thoughts on EURUSD?
Today, EURUSD is facing a clear risk of a downside correction following stronger-than-expected Nonfarm Payroll data. This immediately boosted the US dollar, threatening the pair’s recent bullish momentum.
On the H4 chart, a CHOCH (Change of Character) pattern has just formed, signaling weakening buying pressure. If the price breaks below the 1.1745 support, the following BOS (Break of Structure) sequence could confirm a shift to a bearish market structure. With the Fed likely to maintain higher interest rates for longer and delay rate cut expectations, the USD stands to benefit further.
What do you think — could this be the start of a major reversal?

Gold Pauses as Strong NFP Data Boosts the DollarHello traders!
Gold is currently hovering around $3,330 after Friday’s Non-Farm Payrolls (NFP) report came in stronger than expected, showing 147,000 new jobs — higher than both the previous reading (139,000) and forecasts (110,000). This pushed the US dollar slightly higher, placing temporary pressure on gold’s upside momentum.
However, broader market factors still support gold’s long-term bullish outlook. Concerns over US fiscal sustainability, continued central bank gold buying, and global growth fears remain key drivers for safe-haven demand.
Technically, gold continues to hold above the key support zone near $3,325, preserving its bullish structure. As long as this level holds, the upward trend remains valid.
👉 What’s your take after the latest NFP report? Will gold keep rising — or is a pullback on the way?
Will Gold Break Higher Ahead of US Jobs Data?Hello traders, what’s your take—will gold rise or fall today?
So far, the precious metal remains quiet, hovering around $3,345 without much movement since yesterday.
According to the CME FedWatch Tool, although the probability is still low, expectations are rising that the Federal Reserve might cut interest rates later this month. That’s a strong supportive factor for gold in the near term.
Technically, the next bullish target is a confirmed daily close above the key resistance level at $3,400.
On the news front, Thursday marks the most important data release of the month for the US—the June Non-Farm Payrolls (NFP) report, released a day early due to the Independence Day holiday. The market is expecting an increase of 110,000 jobs, down from 139,000 in May.
This release could be a gold mover: If the actual number is weaker than expected, it would likely reinforce Fed rate cut expectations—giving gold a bullish push.
