OBV + MACD Confirmed FVG📉 Bitcoin – Bearish FVG Retracement With EMA200, OBV & MACD Momentum Confluence
This chart highlights a clean bearish structure on BTC, defined by a consistent sequence of Lower Highs (LH) and Lower Lows (LL). Throughout this downtrend, multiple Fair Value Gaps (FVGs) have formed — each created by sharp institutional displacement that leaves behind inefficiencies in price.
As price continues trending below the EMA200, bearish order flow remains firmly intact. Each time BTC retraces into an unmitigated FVG, the market efficiently rebalances the imbalance before resuming downward continuation.
In this setup, the integration of FVGs + EMA200 + OBV + MACD Histogram builds a high-probability roadmap for identifying premium retracement zones and anticipating continuation moves.
The major FVG above current price sits directly under the EMA200 and aligns with weakening OBV momentum. This makes it the most structurally significant bearish reaction zone. A secondary FVG exists below it, but carries less importance due to weaker displacement and reduced confluence.
⸻⸻⸻⸻⸻⸻⸻⸻⸻⸻
📊 Key Observations
1️⃣ Prior Bearish FVG Reaction
A previously formed bearish FVG was cleanly mitigated, followed by immediate downside continuation.
This confirms that institutional order flow remains bearish and that FVG zones are functioning as efficient retracement magnets in the current trend.
2️⃣ High-Priority FVG Under EMA200 (Primary Zone)
This upper FVG has the strongest confluence:
Formed by strong bearish displacement
Sits directly below the EMA200, reinforcing trend direction
Aligns with market structure (LH → LL sequence)
OBV shows weakening buying pressure as price approaches the zone
MACD histogram is decreasing into FVG, signaling bearish momentum shift
This makes it the most likely level for a significant rejection if price retraces into it.
3️⃣ Secondary FVG Reaction Zone
A lower FVG also exists, but:
Formed during a smaller displacement
Does not align with EMA200 rejection
Carries weaker structural significance
It may still produce a minor reaction, but is lower probability compared to the primary FVG above.
4️⃣ OBV Momentum Context
OBV declines as price approaches the FVG, which is a critical confirmation.
When OBV decreases during a retracement, it signals absorption of buy-side pressure → strengthening the bearish continuation case.
5️⃣ MACD Histogram Confirmation
MACD histogram is rolling over and turning negative as price pushes toward the FVG.
This confirms bearish momentum returning, increasing the probability of a strong rejection from imbalance.
6️⃣ Structural Context
BTC maintains a clean LH–LL bearish sequence.
As long as price remains under the EMA200 and below the unmitigated FVGs, retracements are more likely to act as rebalancing moves rather than true reversal attempts.
⸻⸻⸻⸻⸻⸻⸻⸻⸻⸻
📊 Chart Explanation
Symbol → BITSTAMP:BTCUSD
Timeframe → 1D
This visualization demonstrates how Smart Money Concepts and momentum indicators align within a trending environment:
Clear LH → LL market structure
Multiple historical FVGs acting as premium retracement zones
A previously mitigated FVG confirming downside continuation
A high-confluence bearish FVG below the EMA200
OBV weakness during retracement phases
MACD histogram declining into FVG retest
Together, these elements create a textbook sequence:
displacement → inefficiency → retracement → mitigation → continuation
Price remains bearish unless BTC can break and close above the upper FVG with strong momentum and volume.
⸻⸻⸻⸻⸻⸻⸻⸻⸻⸻
📘 How EMA200, OBV & MACD Strengthen FVG Setups (Bullish + Bearish)
🔹 1. Trend Filter: EMA200
Below EMA200 → look for bearish FVG rejections
Above EMA200 → look for bullish FVG reactions
EMA200 acts as a dynamic mean-reversion anchor during trending markets.
🔹 2. OBV + FVG
OBV declining on FVG retest → bearish continuation
OBV rising into bullish FVG → bullish continuation
Volume trend strengthens or invalidates FVG reactions.
🔹 3. MACD Histogram + FVG
Falling histogram → bearish FVG confirmation
Rising histogram → bullish FVG confirmation
MACD shows whether momentum aligns with the imbalance.
🔹 Combined Logic (Works Both Ways)
Displacement creates an FVG
Price retraces into the FVG
Trend filter (EMA200) agrees
OBV + MACD confirm volume + momentum direction
Price rejects and continues trend.
⸻⸻⸻⸻⸻⸻⸻⸻⸻⸻
✅ Summary
Market structure remains bearish with LH → LL continuity
A previously filled FVG validated downside continuation
The upper FVG is the highest-probability zone (EMA200 + OBV + MACD alignment)
The secondary imbalance carries lower significance
OBV and MACD both confirm weakening buyer pressure into FVG
As long as BTC stays below EMA200, retracements into FVG are likely continuation setups
⸻⸻⸻⸻⸻⸻⸻⸻⸻⸻
⚠️ Disclaimer
📘 For educational purposes only
🙅 Not SEBI registered
❌ Not financial or investment advice
🧠 Smart-Money-Concepts explanation only
Macd-h

CONSOLIDATION BREAKOUT IN LTIMBuy LTIM (D) 5240, for 5700 and 6100. Add on dips till 5000 with stop at 4950 on weekly close. Stock ready to give breakout above 38.2% fibonacci levels and then will reach 50% and 62% eventually. Consolidation happening for last 12 months which shall give minimum 15% returns.
Both leading and lagging indicator MACD and EMA is indicating bullish momentum in LTIM

Nifty Bank Chart with RSI, MACD with W Pattern breakoutNifty Bank Chart with RSI , MACD with W Pattern break out - for our study.
Possibility of Break out is high as we can go for long


Tata elxsiWelll as we can see from the daily chart if it break the resistance and I think it will ,as from the macd histogram and rsi it's quite indicative it will

GIPCL: Short term to Mid term view-BullishDaily MACD Crossover, Weekly ADX positive trend, and all other indicators showing positive signals. Monthly MACD crossover happened but still price not yet moved much upside. Monthly indicators also positive. It may shootup anytime but patience is important to hold.
Vijayaraghavan.K,
Kovilpatti,Tuticorin Dist.

TATA ELXSI : Upmove expectedThe MACD is indicating an upward movement along with gradual increase in RSI.....Upward movement can be seen in 1-2 days.

ESCORTSDaily
Price Action - Triangle Breakout from Bottom
RSI > 60 Bullish
MACD - Buy Signal
Bolinger Upper Band - Broken which indicate momentum
ADX needs to increase to pick more momentum
Weekly:-
MACD needs to turn Buy signal
Futures data:-
Long Buildup on breakout

MACD , RSI ,BB BREAKOUTNSE:HINDALCO It gives good idea to buy. tomorrow MACD crosses SIGNAL line and RSI is above 60. As well as it breaks the bollinger band with big green candle .

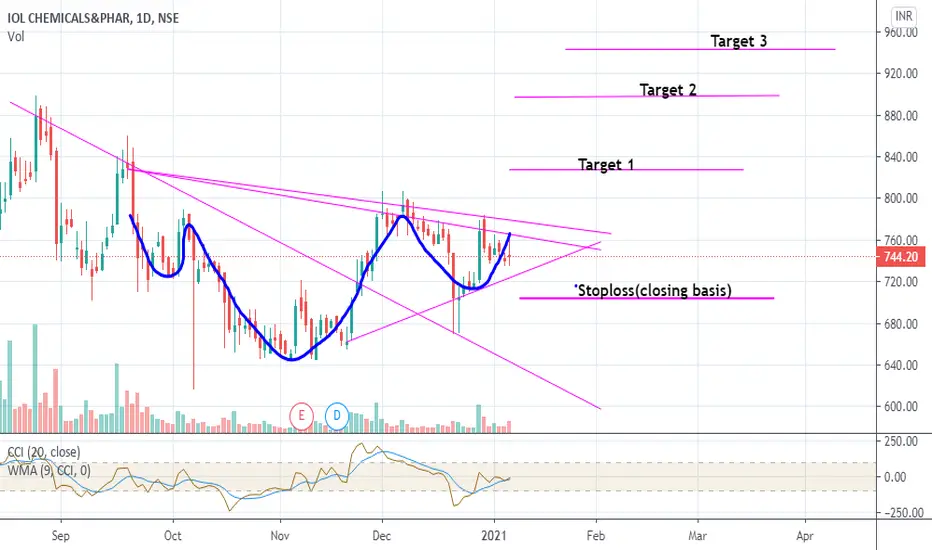
IOLCP: Short& Mid term view BullishRef chart. MACD crossover may happen on upcoming days in daily chart. This will trigger to price shoot-up. In daily chart Indicators are turning bullish from bearish . In monthly chart indicators are continuing the bullish momentum last few months. From this level it may move the further upside. Targets are given by using patterns.
****Note: If you noticed my earlier views, most of the views given before breakouts by using indicators. Risk takers no issues but Safe traders can take the trade after breakout.
Vijayaraghavn.K
Kovilpatti.
Dhanlakshmi Bank: Short term bullish viewDaily and weekly indicators showing bullish signals and monthly indicators also showing positive momentum. These will helps to reach the given target levels. Breakout also done.
Vijayaraghavan.K,
Kovilpatti

Nifty 50NIFTY 50 (MONTHLY):- NIFTY 50 MOVE IN CHANNEL AND MACD BULLISH DIVERGENCE I NOTICED WHICH MEANS WE ARE GOING FOR BIG MOVE LET SEE I DONT THINK WE WILL BE GO DOWN FOR MID FEB... LET SEE

Bear Started in Nifty50 MarketMy basic analysis using 14RSI shows divergence with negative RSI slope also this fact is supported by MACD Indicator. So I believe markets gonna go down.


