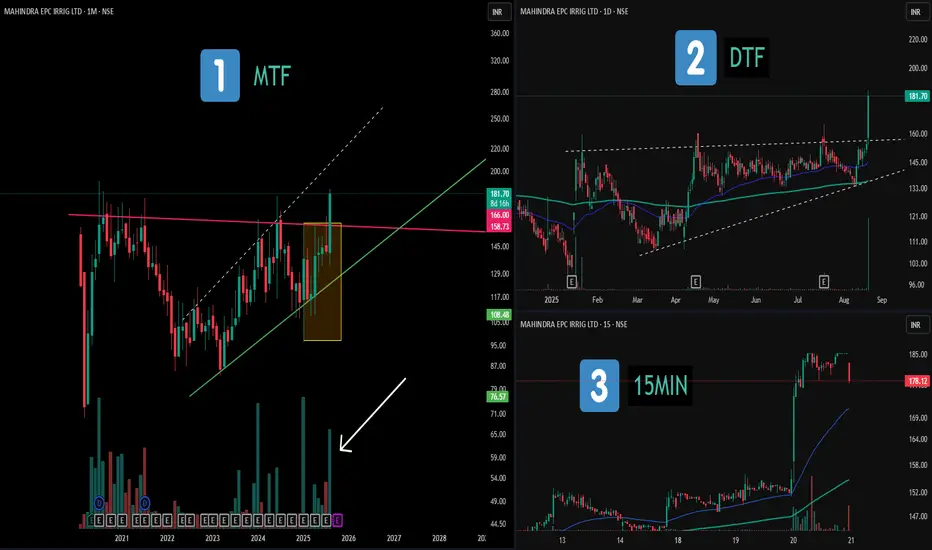
Multi-Timeframe Study: Consolidations and Patterns📝 Description:
1️⃣ MTF (Monthly) – Displays a broad consolidation structure with a hidden broadening formation and notable volume clusters marked in recent candles.
2️⃣ DTF (Daily) – Highlights an ascending triangle structure, with clear range boundaries and price compression before expansion.
3️⃣ 15MIN (Intraday) – Shows that the maximum price movement and volume activity occurred on a single candle, illustrating how momentum often concentrates in short bursts.
This chart setup serves as an educational view across multiple timeframes, showing how higher- and lower-TF structures can align.
⚠️ Disclaimer:
This post is purely for educational and structural analysis purposes. Not financial advice.
MAHEPC
Breakout in Mahindra EPC Irrigation Ltd...Chart is self explanatory. Levels of breakout, possible up-moves (where stock may find resistances) and support (close below which, setup will be invalidated) are clearly defined.
Disclaimer: This is for demonstration and educational purpose only. This is not buying or selling recommendations. I am not SEBI registered. Please consult your financial advisor before taking any trade.


#USHAMART USHAMART #RELIANCE #NIFTY #BANKNIFTY #IT #IOT #STEEL #USHAMART
Usha Martin Ltd.
NSE:USHAMART
NSE:USHAMART
CMP: 97.75
Short term quick target 107+
Long term higher expected.
SL: 89
Duration < 1 month
Factors:
BULLISH WEDGE BREAKOUT
Trend Following
Rising Volume with rising Prices.
Flag pattern breakout.
Pennant Pattern Breakout with Bullish Candle.
Retest Successful.
Higher Highs & Higher Lows.
Broken above RESISTANCE levels
Trading at SUPPORT levels
Earnings are strong.
Bullish Wedge Breakout
Risk Return Ratio is healthy.
And
Rising from Double Bottom Pattern to Flag Pattern forming.
If you like my work KINDLY LIKE SHARE & FOLLOW this page for free Stock Recommendations.
With 💚 from Rachit Sethia
