Mahindra & Mahindra: Reversing Gears—Short Drive Toward 3400”Mahindra & Mahindra is showing clear signs of Smart Money distribution on the higher timeframe. Price has tapped into a major HTF supply zone around 3600–3650, where institutional selling previously originated. The recent sweep of the highs looks like a classic liquidity grab, engineered to trap late buyers before a potential reversal.
After the liquidity sweep, price failed to sustain above premium pricing and has started shifting structure. The transition from a bullish market structure to a bearish market structure shift (MSS) suggests that Smart Money may be positioning for a downside move.
Internal liquidity beneath recent swing lows provides an ideal drawdown target, with the next significant HTF demand zone resting near the 3400 level—aligning perfectly with your short target.
As long as price remains in the premium zone and below the supply region, the setup favors short positions with expectation of price delivery toward the 3400 imbalance + demand confluence.
Happy Trading
Mahindraandmahindra

M&M - Bullish Momentum Near Resistance💹 Mahindra & Mahindra Ltd (NSE: M&M)
Sector: Automobiles | CMP: 3757.30 | View: Bullish Momentum Near Resistance
Chart Pattern: Ascending Structure with Resistance Retest
Candlestick Pattern: Strong Bullish Candle
Swing High: 3781
Swing Low: 3393
STWP Trade Analysis:
Bullish Breakout Level: 3781
Stop Loss: 3661.70
Momentum: Strong
Volume: High, above-average participation
M&M has printed a strong bullish candle directly into the resistance zone near 3780, supported by above-average volume and a steady rise from the demand levels around 3400–3500. The structure reflects a clean ascending formation, where buyers have defended every dip and carried the stock back into the upper supply band. The latest candle shows a decisive shift in tone, with momentum favouring bulls as the stock attempts a breakout continuation.
Resistances:
3787.43 | 3817.57 | 3866.23
Supports:
3708.63 | 3659.97 | 3629.83
STWP Stock Analysis:
Final Outlook:
Momentum: Strong | Trend: Neutral-to-Bullish | Risk: Moderate | Volume: High
M&M is showing strong follow-through strength from the recent swing low, reflecting renewed buying interest. RSI is balanced and gradually rising, Stochastic is turning upward from mid-levels, and MACD histogram shows improving momentum — all pointing toward a possible continuation if price sustains above the 3700 support band.
The price structure also aligns with a VCP-style contraction, where volatility has gradually tightened after each pullback. Today’s bullish candle marks an attempt at the first expansion leg into the resistance zone.
Volume remains healthy, and EMA compression is visible, signalling potential for a momentum release if the stock pushes cleanly above 3780–3818. The underlying trend remains neutral but improving, supported by a broad base built over the past weeks.
Watch for dips:
Minor pullbacks toward 3708–3659 can act as healthy retest zones, offering secondary opportunities in case of a delayed breakout.
Overall, M&M stands as a potential swing candidate, backed by strong momentum, improving volume behaviour, and a well-defined breakout structure forming near its upper resistance zone.
⚠️ STWP Legal Disclaimer
This document is strictly for educational and informational purposes. All examples, charts, levels, and option structures discussed are illustrative and are not intended as buy, sell, or hold recommendations. STWP does not provide investment advice, trading tips, signals, or personalized financial guidance of any kind, nor is it a SEBI-registered intermediary or research analyst. The analyses, illustrations, and risk–reward structures included here are generic in nature and based on publicly available data and observed market behaviour, which may change without notice. Financial markets involve significant risk; derivatives in particular carry the potential for substantial losses. Option premiums, implied volatility, open interest, delta, and other market variables can fluctuate rapidly and unpredictably.
Readers are solely responsible for their trading decisions, capital management, and risk assessment. Before making any investment or trading decision, please consult a SEBI-registered investment advisor. STWP, its representatives, and affiliates shall not be liable for any direct or indirect loss arising from the use of this material. Historical patterns or past market behaviour do not guarantee future outcomes, nor should any part of this document be interpreted as a promise of performance, accuracy, or returns.
Position Status: No active position in this instrument at the time of analysis.
Data Source: TradingView & NSE India.
💬 Found this useful?
🔼 Boost this post to support structured learning
✍️ Share your thoughts or questions in the comments
🔁 Forward this to traders who value clean technical studies
👉 Follow for disciplined, structured, STWP-style analysis
🚀 Stay Calm. Stay Clean. Trade With Patience.
Trade Smart | Learn Zones | Be Self-Reliant 📊

Mahindra & Mahindra's Inverse Head & Shoulders BreakoutMahindra & Mahindra's Inverse Head & Shoulders Breakout Signals Bullish Momentum with RSI Above 70
Mahindra & Mahindra Ltd. (M&M), currently trading around ₹3,648, is exhibiting a classic inverse head and shoulders pattern on its hourly chart—a bullish reversal setup that often precedes upward price movement. Coupled with a Relative Strength Index (RSI) reading above 70, the stock is showing signs of strong momentum, though traders must tread with technical precision.
With the inverse head and shoulders pattern completing and RSI above 70, Mahindra & Mahindra is technically poised for a bullish move. Traders should monitor price action closely, use disciplined stop-losses, and avoid over-leveraging. This setup favors momentum traders and short-term swing positions, especially if volume confirms the breakout.

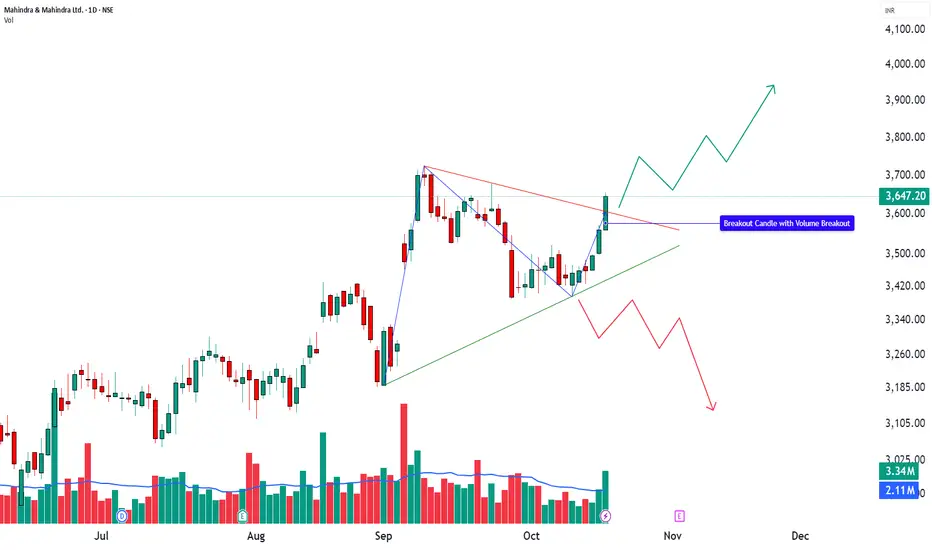
M&M Breaks Out with Volume Support | Structure Meets Momentum________________________________________
🚙 MAHINDRA & MAHINDRA LTD (NSE: M&M) | CMP ₹3,647.20 (+2.43%)
Sector: Auto | Date: 19 Oct 2025
________________________________________
🔹 Price Action:
M&M posted a strong bullish candle, closing near day’s high at ₹3,647.20 with gains of +2.43%.
Volume surged to 3.34M shares, nearly 2.2× the 20-day average volume (2.10M) — a clear sign of institutional and HNI participation.
The stock confirmed a bullish breakout above ₹3,656, marking a shift from a phase of consolidation to one of expansion.
________________________________________
🔹 Technical Analysis:
Momentum indicators are clearly aligned in favour of the bulls, confirming strength across multiple parameters. RSI (65.55) has broken above its midline, signalling momentum expansion, while MACD (9) shows a positive crossover that reinforces directional conviction. CCI (129.03) reflects sustained trend acceleration, and though Stochastic (96.65) remains in overbought territory, it supports ongoing breakout momentum. The VWAP at ₹3,629.84 acts as an immediate dynamic support, maintaining short-term control with buyers. Additionally, a Bollinger Band breakout accompanied by a BBSqueeze-Off indicates expanding volatility — often a precursor to a strong continuation phase when combined with rising volume and structural breakout confirmation.
________________________________________
🔹 Chart Analysis:
M&M broke out from a symmetrical triangle structure, ending a multi-week consolidation phase.
The breakout candle formed with a wide body and heavy volume, closing near the high — a typical sign of breakout conviction.
Price structure shows higher lows and rising volume, confirming trend continuation rather than exhaustion.
________________________________________
🔹 Key Levels:
Resistance: 3,682 / 3,717 / 3,778
Support: 3,586 / 3,525 / 3,490
VWAP: 3,629.84
A short-term pullback toward VWAP or ₹3,586 could act as a healthy retest before continuation.
Holding above ₹3,525 will keep the structure intact, maintaining bullish control.
________________________________________
🔹 STWP Trade Analysis:
Bias: Bullish
Breakout Level: ₹3,656
Intraday Support: ₹3,619
Swing Support: ₹3,456
Intermediate Support: ₹3,421
Momentum: Strong
Trend: Bullish
Risk: Low
Volume: High
📌 Observation: The breakout candle supported by rising volume and MACD confirmation signals a trend continuation setup with clearly defined risk zones.
________________________________________
🔹 HNI Trade Setup:
Fresh HNI accumulation seen around ₹3,647–₹3,656, supported at ₹3,501, and additional buying interest visible near ₹3,639 with support at ₹3,475.
This structure indicates layered accumulation, suggesting that larger players are positioning within the consolidation rather than chasing price above resistance.
________________________________________
🔹 Final Outlook:
Momentum: Strong | Trend: Bullish | Risk: Low | Volume: High
M&M’s structure indicates a breakout-driven continuation phase backed by volume and indicator alignment.
As long as price holds above ₹3,525, the trend bias remains bullish, with scope for upside toward ₹3,717–₹3,778 in the near term.
A dip toward VWAP or EMA supports would represent healthy price normalization, not weakness.
________________________________________
🔹 Learning Note (Educational Purpose):
This setup showcases how volume + structure + indicator confluence confirms a genuine breakout.
It also demonstrates how smart money accumulates during compression, not after expansion — a crucial lesson for breakout traders.
M&M provides a textbook example of how post-consolidation breakouts evolve into expansion phases.
________________________________________
🔹 STWP Mentor Note:
“Momentum isn’t about chasing; it’s about recognizing conviction early.
M&M’s breakout is a fine example of structure, participation, and patience working in perfect rhythm — where price doesn’t just move, it evolves with purpose.”
________________________________________
───────────────────────────────────────────────
⚠️ **DISCLOSURE & DISCLAIMER (SEBI-Compliant)**
───────────────────────────────────────────────
📘 **Purpose:**
This content is created **solely for educational and informational purposes** to help readers understand market structure, price action, and technical analysis.
It does **not constitute investment advice**, research recommendation, or a solicitation to buy or sell any security.
👤 **Author Disclosure:**
The author is **not a SEBI-registered investment adviser or research analyst.**
All chart studies, price levels, and observations are based on publicly available data (e.g., **NSE India**, **TradingView**) and are presented purely for **learning illustration**.
📊 **Position Status:**
No active position in * * at the time of publication.
“The author may sometimes trade in the securities discussed, but such trades are independent and shared here only for educational understanding.”
⚠️ **Risk Disclosure:**
Trading and investing involve financial risk. Market movements can be unpredictable, and losses may exceed invested capital.
Readers are strongly advised to consult a **SEBI-registered investment adviser** before making any trading or investment decisions.
🧠 **Responsibility Clause:**
By engaging with this post, you acknowledge that you are **solely responsible for your own trading or investment decisions**, and that this content is intended only for **market education and awareness**.
───────────────────────────────────────────────
💬 **Did You Find This Useful?**
If this analysis helped you understand price structure or market psychology better:
🔼 **Boost** to support transparent & structured financial education.
✍️ **Comment** your insights, observations, or questions — let’s learn together.
🔁 **Share** this post with learners and aspiring traders who value discipline.
📚 **Follow @STWP** for more structured, educational breakdowns on stocks & setups.
🚀 *Stay Calm. Stay Clean. Trade With Patience.*
💡 *Trade Smart | Learn Zones | Be Self-Reliant.*
───────────────────────────────────────────────
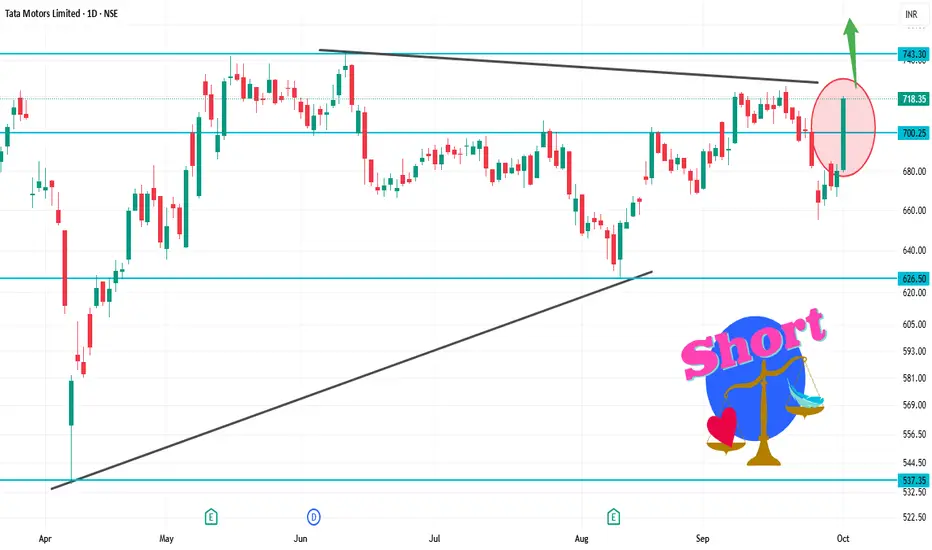
TATAMOTORS 1D Time frameCurrent Price: ₹718
Day Range (today): Around ₹705 – ₹725
52-Week Range: ₹535 – ~₹1,000
📏 Key Levels with ₹718 in focus
Immediate Resistance: ₹750 – ₹800 (needs breakout above this zone)
Current Level: ₹718 → price is right between support and resistance
Immediate Support: ₹700 – ₹705 (if broken, could fall further)
Next Support: ₹650 – ₹660 (major zone to watch)
🧠 What this means
Since price is just above support (₹705) and below resistance (₹750), it’s at a decision point.
If Tata Motors holds above ₹705–₹710, buyers may try to push toward ₹740–₹750.
If it fails and breaks below ₹705, price may revisit ₹660 levels.
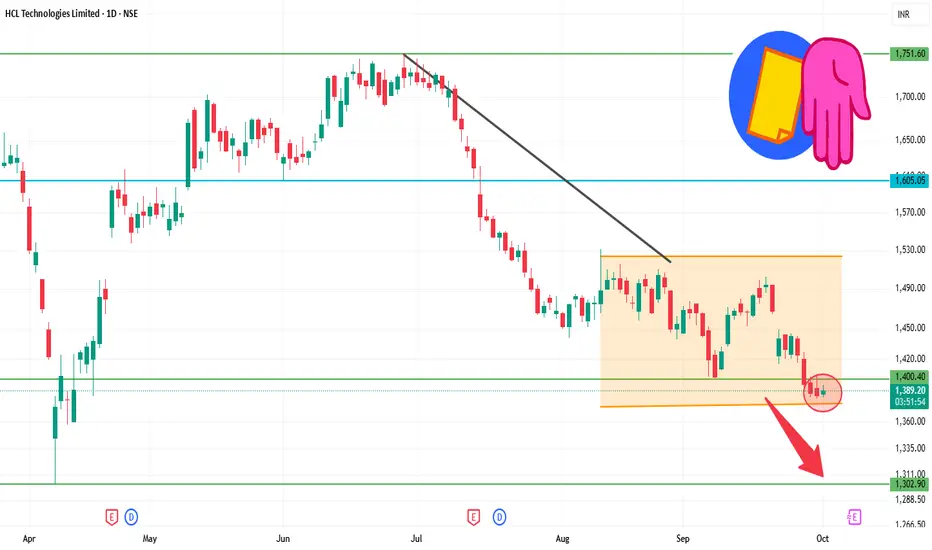
HCLTECH 1D Time frameOpening Price: ₹1,387.40
Closing Price: ₹1,387.40
Day Range: ₹1,383.10 – ₹1,395.00
Previous Close: ₹1,387.40
📉 Trend Analysis
Short-Term Trend: Bearish — The stock is trading below key moving averages, confirming the bearish trend.
Medium-Term Trend: Neutral — The stock is in a consolidation phase, characterized by lower highs and lower lows.
Long-Term Trend: Neutral — No significant trend identified; the stock is trading within a range.
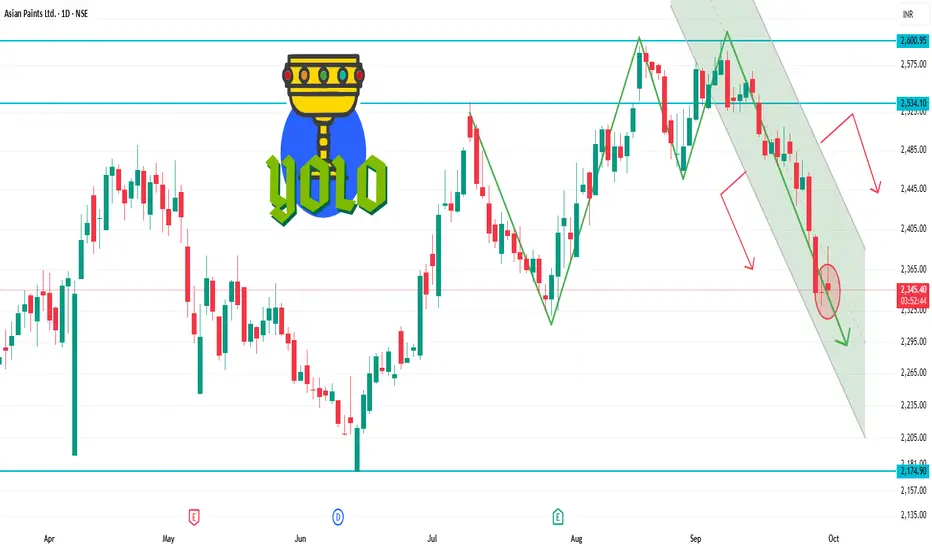
ASIANPAINT 1D Time frameCurrent Price Snapshot
Current Price: ₹2,345.50
Day’s Range: ₹2,342.00 – ₹2,388.80
52-Week Range: ₹2,124.75 – ₹3,358.00
Technical Indicators
RSI (14-day): 44.19 — indicates a neutral to slightly bearish momentum.
MACD: -4.010 — suggests bearish momentum.
Moving Averages:
5-day: ₹2,396.00 — indicates a Sell signal.
50-day: ₹2,389.00 — indicates a Sell signal.
200-day: ₹2,350.00 — indicates a Neutral signal.
Technical Summary: Predominantly Sell signals across various indicators.
Summary
Above ₹2,388.80: Potential rise toward ₹2,400 – ₹2,420.
Below ₹2,342.00: Potential fall toward ₹2,320 – ₹2,300.
Between ₹2,300 – ₹2,380: Likely range-bound movement.
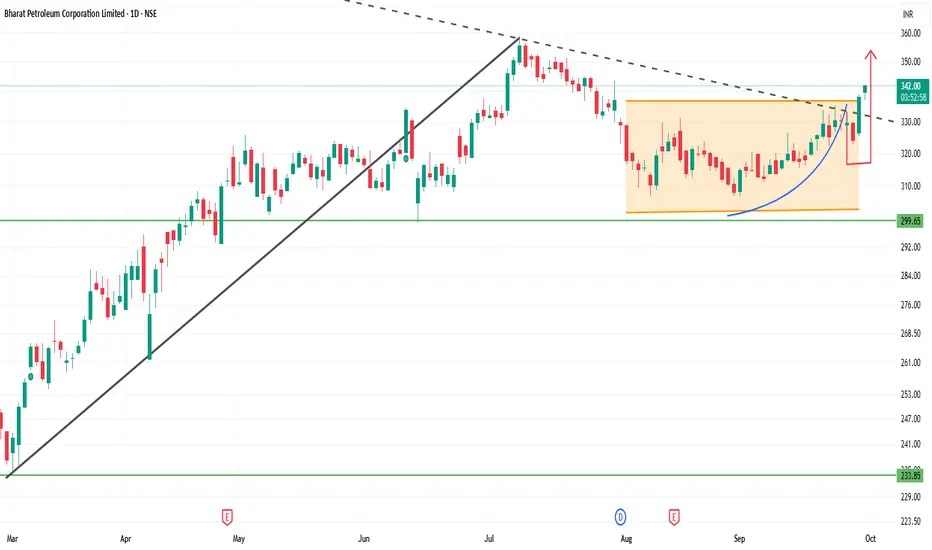
BPCL 1D Time frameCurrent Price Snapshot
Last Traded Price: ₹340.20
Day’s Range: ₹337.15 – ₹340.85
52-Week Range: ₹234.01 – ₹373.35
Technical Indicators
RSI (14-day): 53.27 — indicates a neutral momentum.
MACD: 2.49 — suggests a bullish trend.
Moving Averages:
5-day: ₹327.97 — indicates a Sell signal.
50-day: ₹322.14 — indicates a Buy signal.
200-day: ₹296.14 — indicates a Buy signal.
Pivot Points:
Support: ₹327.13
Resistance: ₹337.93
Summary
Above ₹340.85: Potential rise toward ₹345 – ₹350.
Below ₹337.15: Potential fall toward ₹330 – ₹325.
Between ₹330 – ₹340: Likely range-bound movement.
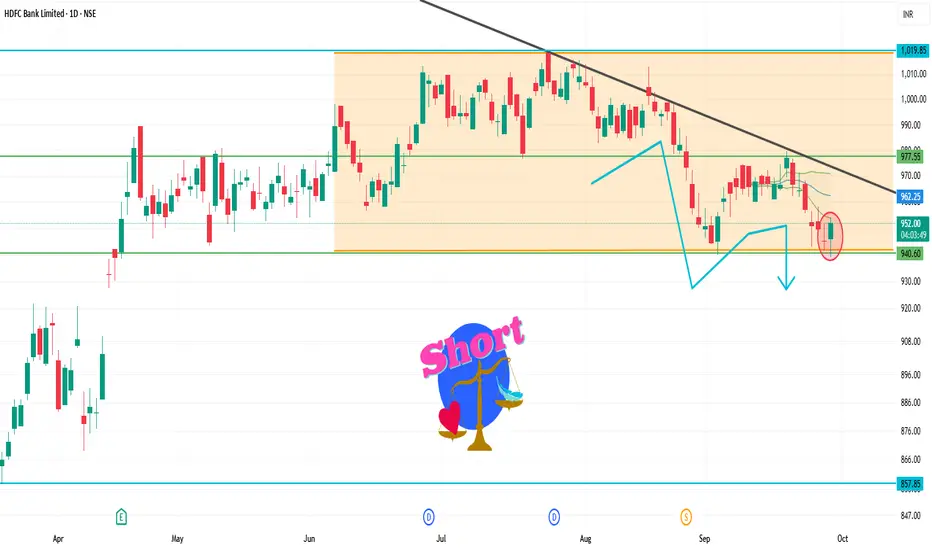
HDFCBANK 1D Time frameCurrent Market Snapshot
Current Price: ₹954.05
Opening Price: ₹945.10
Day's Range: ₹939.10 – ₹953.00
Previous Close: ₹945.05
🔑 Technical Indicators
Relative Strength Index (RSI): 35.08 – indicating a neutral to bearish condition.
Moving Average Convergence Divergence (MACD): -6.02 – suggesting bearish momentum.
Moving Averages: Trading below the 50-day and 200-day moving averages, indicating a bearish trend.
📈 Key Support & Resistance Levels
Immediate Support: ₹939
Immediate Resistance: ₹953
Pivot Point: ₹946
📉 Market Sentiment
Trend: The stock is trading below its 50-day and 200-day moving averages, indicating a bearish trend.
Volume: Trading volume is higher than average, suggesting increased investor activity.
📈 Strategy (1D Timeframe)
1. Bullish Scenario
Entry: Above ₹953
Stop-Loss: ₹939
Target: ₹960 → ₹965
2. Bearish Scenario
Entry: Below ₹939
Stop-Loss: ₹953
Target: ₹930 → ₹925
⚠️ Risk Management
Limit risk to 1% of capital per trade.
Always use stop-loss to protect against unexpected market movements.
Monitor broader market trends and sector-specific news that may impact stock performance.
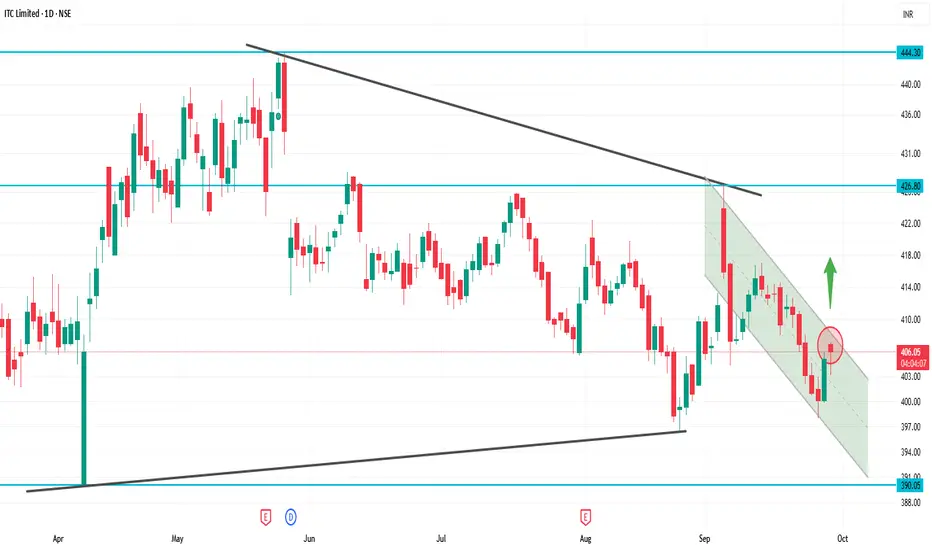
ITCITC Daily Snapshot
Current Price: ~₹405
Day’s Range: ~₹401 – ₹406
🔍 Key Levels
Support: Around ₹399 – ₹401 (near-term buying zone)
Resistance: Around ₹409 – ₹412 (supply zone)
📈 Technical Picture
Trend: Slightly bearish to sideways, but stabilizing above ₹405 gives some strength
RSI (Daily): Neutral zone, neither overbought nor oversold
Moving Averages: Price is close to short-term averages, so a decisive breakout above ₹409 is needed for bullish confirmation
VWAP: Trading near VWAP, showing balance between buyers and sellers
✅ Summary
At ₹405, ITC is near the middle of its range.
If it holds above ₹405 and breaks ₹409–₹412, bullish momentum can pick up.
If it falls below ₹401, it may retest support near ₹398.
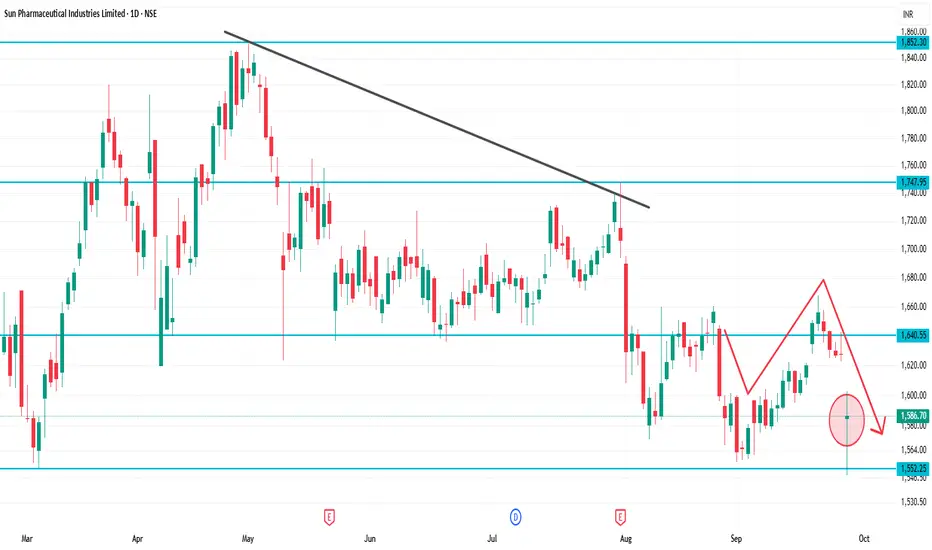
SUNPHARMA 1D Time frameCurrent Price: ~₹1,586
Day Range: ~₹1,582 – ₹1,600
52-Week High: ~₹1,960
52-Week Low: ~₹1,553
📈 Technical Outlook
Immediate Support: ₹1,580 (very close to current price)
Strong Support: ₹1,553 – ₹1,560 (52-week low zone)
Immediate Resistance: ₹1,600 – ₹1,620
Major Resistance: ₹1,650 – ₹1,670
Trend Bias:
Stock is weak, testing lower supports.
If it breaks below ₹1,580, then ₹1,553 may be tested.
A bounce is only possible if it sustains above ₹1,600.
📌 Step-by-Step Market View
Above 1,600: Chance for small recovery toward ₹1,620 – ₹1,650.
Stays between 1,580 – 1,600: Consolidation zone.
Breaks below 1,580: Weakness may extend to ₹1,553.
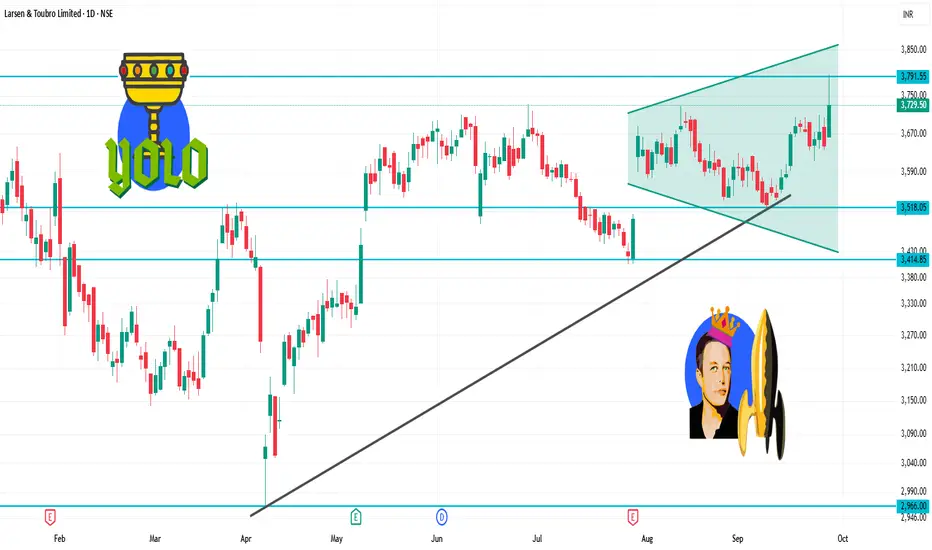
LT 1D Time framePrevious Close: ₹ 3,644
Today Open: ₹ 3,664
Day’s High: ₹ 3,795
Day’s Low: ₹ 3,661
Current / Last Traded Price: around ₹ 3,730
⚡ Strategy
Bullish Side:
Buy on dips near ₹ 3,700 – 3,720 with stop loss below ₹ 3,660. Target ₹ 3,760 → ₹ 3,795.
Bearish Side (Only if Weakness):
If price falls below ₹ 3,660, short opportunities may open toward ₹ 3,600.
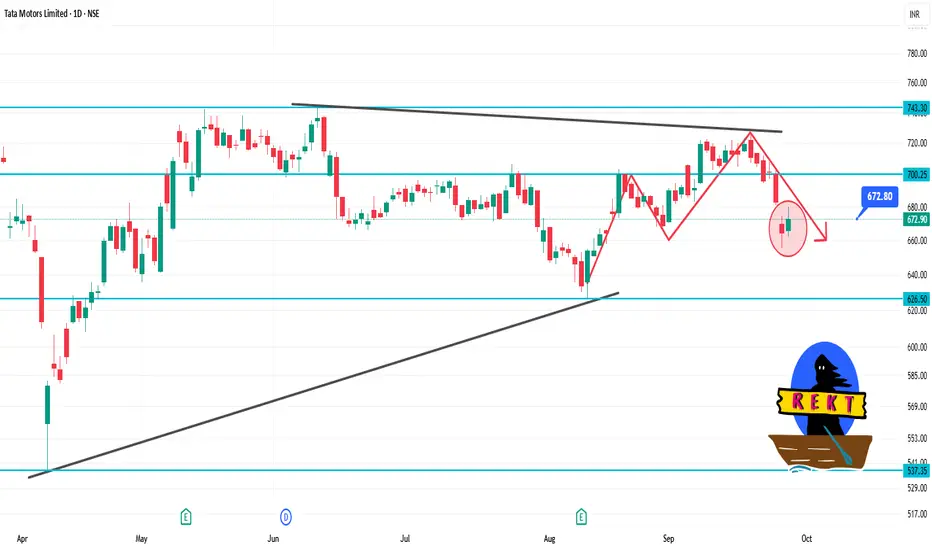
TATAMOTORS 1D Time frameCurrent Price: ₹673.00
Day's Range: ₹662.35 – ₹680.35
Previous Close: ₹664.30
Volume: 15,780,434 shares traded
Market Cap: ₹247,780 crore
52-Week High: ₹1,000.40
52-Week Low: ₹535.75
Face Value: ₹2.00
Beta: 1.30
🧾 Financial Highlights
P/E Ratio (TTM): 11.69
P/B Ratio: 0.00
EPS (TTM): ₹57.54
Dividend Yield: 0.89%
ROE: 28.1%
Book Value: ₹315
📈 Technical Insights
Trend: The stock has shown resilience with strong long-term performance over three years, despite recent challenges compared to the Sensex.
Support Levels: ₹662.35, ₹650.00
Resistance Levels: ₹680.35, ₹700.00
📌 Key Takeaways
Recent Performance: Tata Motors' shares rose over 2% today, snapping a two-day decline, following the announcement that Jaguar Land Rover (JLR) had commenced a phased restart of its operations after a cyberattack.
Analyst Sentiment: Despite recent volatility, Tata Motors remains a top pick among analysts for long-term investment.
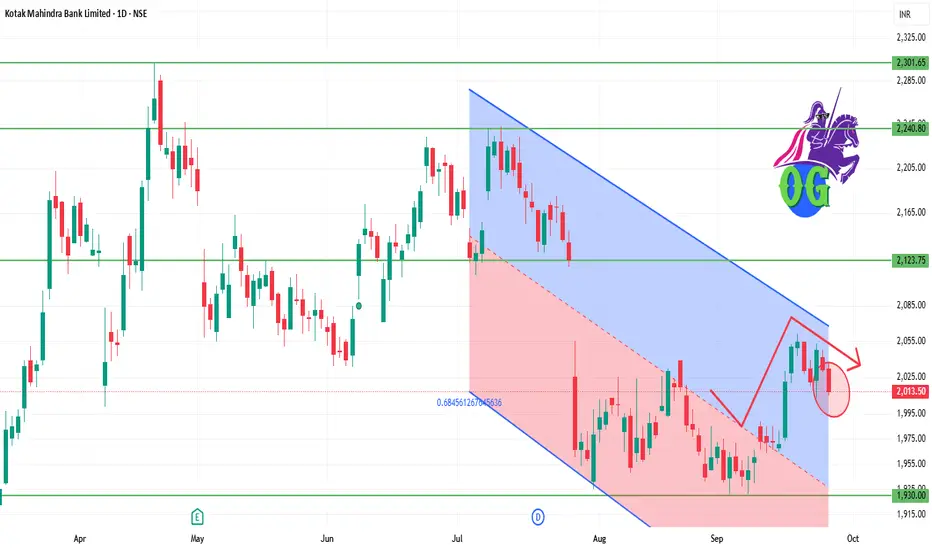
KOTAKBANK 1D Time frame📊 Daily Snapshot
Closing Price: ₹2,013.60
Day’s Range: ₹2,012.50 – ₹2,031.30
Previous Close: ₹2,031.30
Change: Down –0.72%
52-Week Range: ₹1,679.00 – ₹2,302.00
Market Cap: ₹4.04 lakh crore
P/E Ratio: 21.09
Dividend Yield: 0.12%
EPS (TTM): ₹96.30
Beta: 0.80 (indicating lower volatility)
🔑 Key Technical Levels
Immediate Support: ₹2,000.00
Immediate Resistance: ₹2,030.00
All-Time High: ₹2,302.00
📈 Technical Indicators
RSI (14-day): 45.2 – indicating a neutral condition.
MACD: Negative, suggesting bearish momentum.
Moving Averages: Trading below the 50-day and 200-day moving averages, indicating a bearish trend.
📉 Market Sentiment
Recent Performance: Kotak Mahindra Bank's stock declined by 0.72% on September 25, 2025, underperforming the broader market.
Volume: Trading volume was significantly lower than its 50-day average, indicating decreased investor activity.
📈 Strategy (1D Timeframe)
1. Bullish Scenario
Entry: Above ₹2,030.00
Stop-Loss: ₹2,000.00
Target: ₹2,050.00 → ₹2,070.00
2. Bearish Scenario
Entry: Below ₹2,000.00
Stop-Loss: ₹2,030.00
Target: ₹1,980.00 → ₹1,960.00
SBIN 1D Time frame📊 Daily Snapshot
Closing Price: ₹861.15
Day’s Range: ₹859.95 – ₹870.15
Previous Close: ₹866.20
Change: Down –0.59%
52-Week Range: ₹680.00 – ₹880.50
Market Cap: ₹794,895 crore
P/E Ratio: 10.01
Dividend Yield: 1.85%
EPS (TTM): ₹86.06
Beta: 1.00 (indicating average market volatility)
🔑 Key Technical Levels
Support Zones: ₹860.00 – ₹854.00 – ₹844.00
Resistance Zones: ₹876.00 – ₹886.00 – ₹892.00
All-Time High: ₹912.00
Fibonacci Pivot Point: ₹865.68
📈 Strategy (1D Timeframe)
1. Bullish Scenario
Entry: Above ₹876.00
Stop-Loss: ₹859.00
Target: ₹886.00 → ₹892.00
2. Bearish Scenario
Entry: Below ₹859.00
Stop-Loss: ₹866.00
Target: ₹854.00 → ₹844.00

MARUTI 1D Time frame📊 Daily Snapshot
Closing Price: ₹16,240
Day’s Range: ₹16,063 – ₹16,375
52‑Week Range: ₹10,725 – ₹16,375
Market Cap: ₹5.1 lakh crore
P/E Ratio: 35.1
Dividend Yield: 0.83%
EPS (TTM): ₹463.5
Beta: 0.88 (lower volatility)
🔑 Key Levels
Support Zone: ₹16,100 – ₹16,150
Resistance Zone: ₹16,300 – ₹16,375
All-Time High: ₹16,375
📈 Strategy (1D Timeframe)
1. Bullish Scenario
Entry: Above ₹16,300
Stop-Loss: ₹16,150
Target: ₹16,500 → ₹16,600
2. Bearish Scenario
Entry: Below ₹16,100
Stop-Loss: ₹16,150
Target: ₹15,900 → ₹15,800

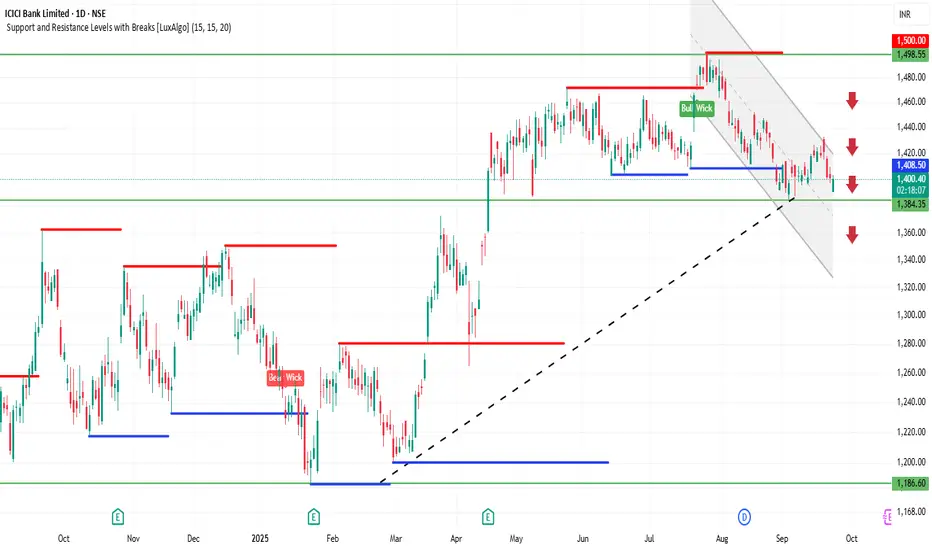
ICICIBANK 1D Time frame📍 Today’s Expected Range (Intraday Approximation)
Expected High: ₹1,403–₹1,410
Expected Low: ₹1,391–₹1,385
These are approximate intraday levels. Actual prices may fluctuate slightly due to market volatility.
🔍 Key Points
Current price: ₹1,400–₹1,401, close to resistance.
If price breaks above ₹1,410 with strong volume → bullish momentum likely.
If price drops below ₹1,385 → short-term correction or pullback possible.
📊 Suggested Trading Strategy
Bullish Scenario
If ICICI Bank breaks ₹1,403–₹1,410, you can buy, targeting ₹1,420–₹1,430.
Stop-loss: ₹1,395
Bearish Scenario
If ICICI Bank drops below ₹1,385, you can sell/short, targeting ₹1,375–₹1,370.
Stop-loss: ₹1,390
Range-Bound / Sideways
If price trades between ₹1,385–₹1,403, it’s better to wait and avoid trading until a clear breakout occurs.
💡 Summary
Resistance Zone: ₹1,403–₹1,410
Support Zone: ₹1,385–₹1,391
Strategy: Trade in the direction of the breakout, and always use stop-loss to manage risk.
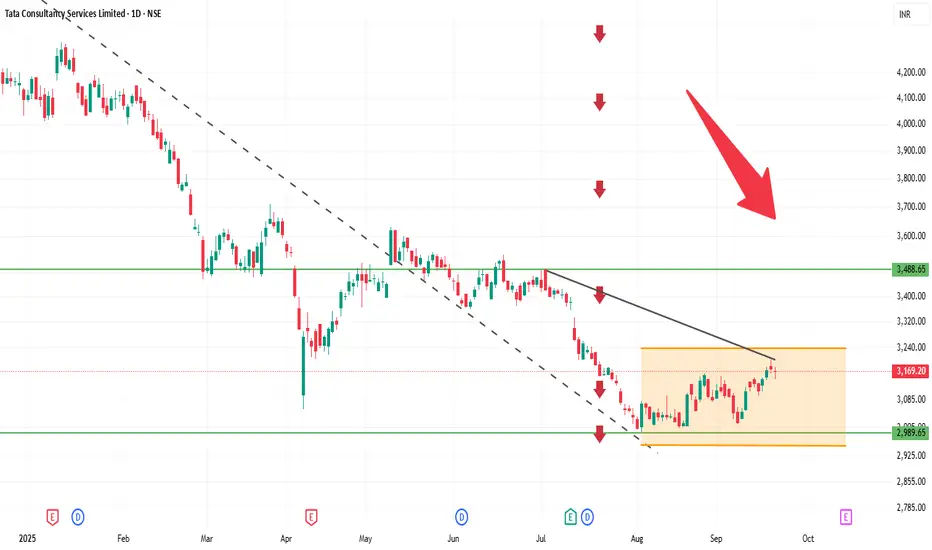
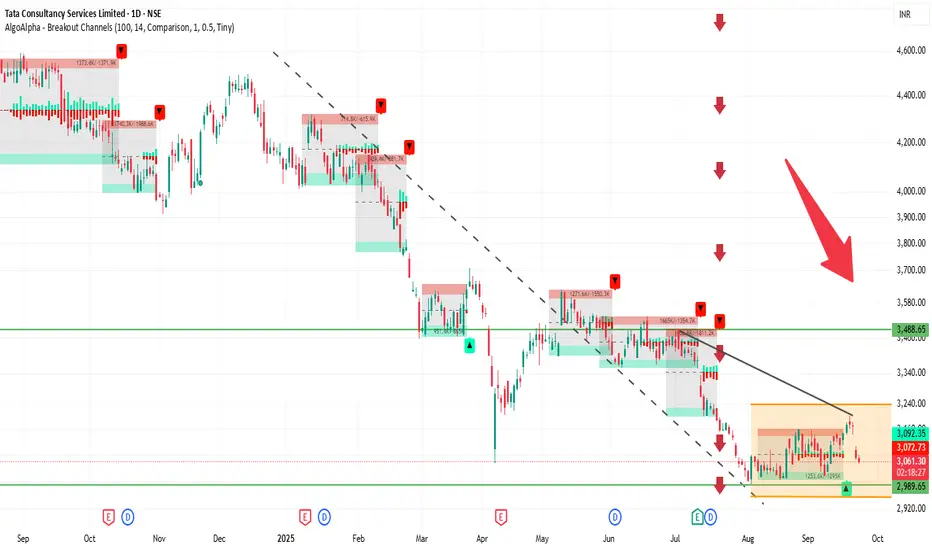
TCS 1D Time frame📍 Current Price & Range
Current price: ₹3,063.80
Day’s High / Low: ₹3,106.90 / ₹3,052.00
52-week High / Low: ₹4,494.90 / ₹2,991.60
🔍 Key Levels
Immediate resistance: ₹3,100–₹3,110
Next resistance: ₹3,200–₹3,250
Immediate support: ₹3,050–₹3,060
Psychological / strong support: ₹3,000
📊 Indicators & Momentum
Price is just below near-term resistance, showing hesitation.
Short-term trend is neutral to slightly bearish; momentum is weak.
RSI and MACD suggest neutral to weak momentum, no strong reversal yet.
Stock is trading well below its 52-week high, indicating it has already corrected significantly.
🔮 Possible Scenarios
Bullish breakout → Sustaining above ₹3,110 could push price toward ₹3,200–₹3,250.
Sideways / consolidation → Likely to trade between ₹3,050–₹3,110 if no strong catalyst.
Bearish pullback → Breaking below ₹3,050 may take price toward ₹3,000, and further down to ₹2,950–₹2,900 if weakness continues.
👉 Outlook: At the current level (₹3,073.80), TCS is in a neutral zone. The next directional move depends on either a breakout above resistance or a fall below support.
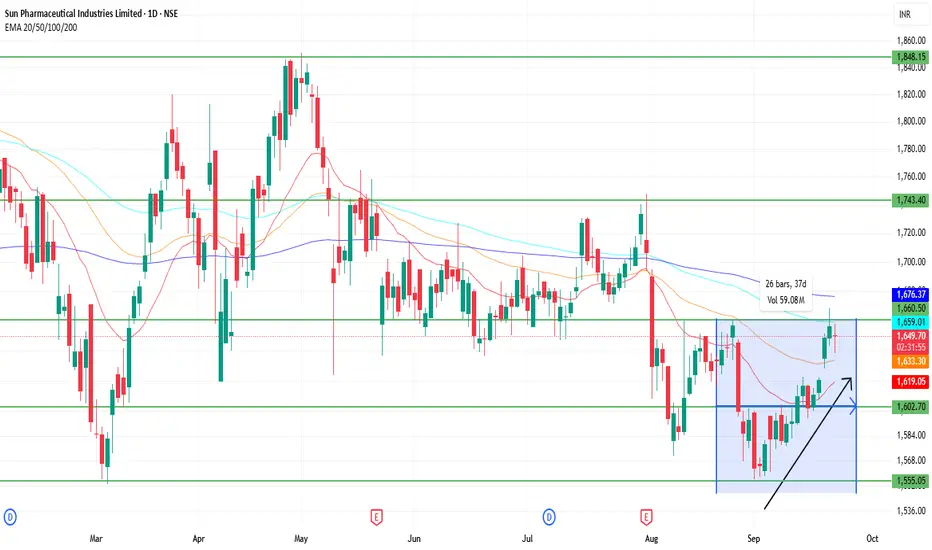
SUNPHARMA 1D Time frame🔍 Current Price
Approximately ₹1,646 – ₹1,650
🧮 Strategy / Trade Ideas
Long Setup:
If price holds above ₹1,630 – ₹1,620 and shows reversal signals (bullish candle etc.), opportunity to go long.
Target zones: first towards ₹1,655 – ₹1,660, then potentially ₹1,675 – ₹1,680.
Stop-loss could be just below support around ₹1,620 to manage risk.
Short / Pullback Setup:
If price faces resistance near ₹1,655 – ₹1,660 and fails to break with conviction.
Potential downside toward ₹1,630 first, then ₹1,600 if that support doesn’t hold.
Breakout Setup:
If price clears and sustains above ₹1,675 – ₹1,680, especially closing above ₹1,745 – ₹1,755, there may be scope for further upside.
✅ Summary
Sun Pharma on the daily chart is moderately bullish. Key for continuation is holding above support in lower ₹1,600-₹1,630 zone, and overcoming resistance around ₹1,655-₹1,660. A breakout above ₹1,675-₹1,680 would strengthen bullish case; failure to hold support could lead to downside.
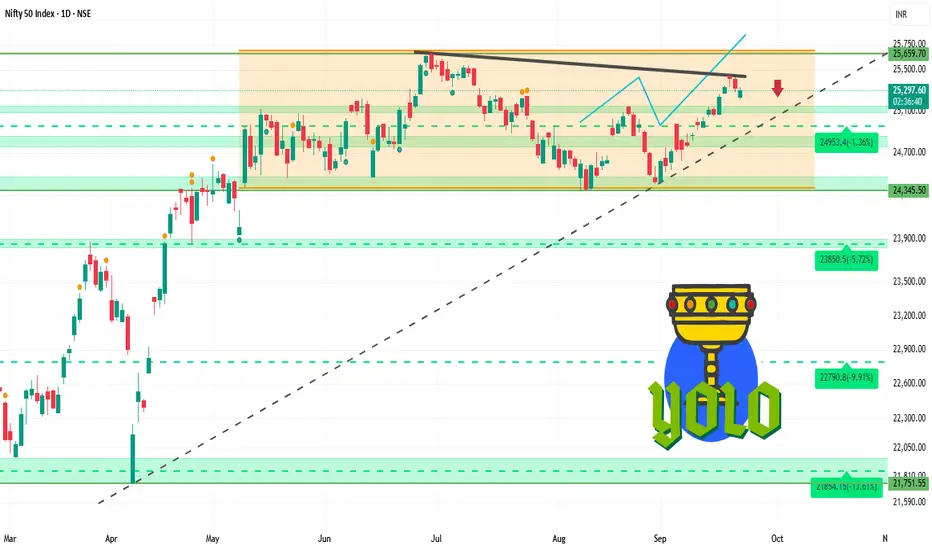
NIFTY 1D Time frame🔍 Current Market Snapshot
Current Level: ₹25,292.45
Day’s Range: ₹25,211.60 – ₹25,331.70
Previous Close: ₹25,327.05
Market Sentiment: Neutral to mildly bearish
📊 Technical Indicators
Moving Averages: The Nifty 50 index is trading slightly below its short-term moving averages, indicating potential resistance.
RSI (14): Approximately 50, suggesting a neutral stance with no clear overbought or oversold conditions.
MACD: Neutral, with the MACD line and signal line close together, indicating indecision in market momentum.
Stochastic Oscillator: Neutral, fluctuating around the midline, reflecting a lack of strong directional movement.
🧮 Strategy / Trade Ideas
Long Setup:
Entry: Consider entering near support levels (~₹25,200) if bullish reversal signals appear.
Stop Loss: Place below ₹24,800 to manage risk.
Target: First resistance around ₹25,400, then ₹25,700.
Short Setup:
Entry: If price fails to break above resistance (~₹25,400) and shows signs of reversal.
Stop Loss: Above ₹25,800.
Target: Downside toward ₹25,200, then ₹24,900.
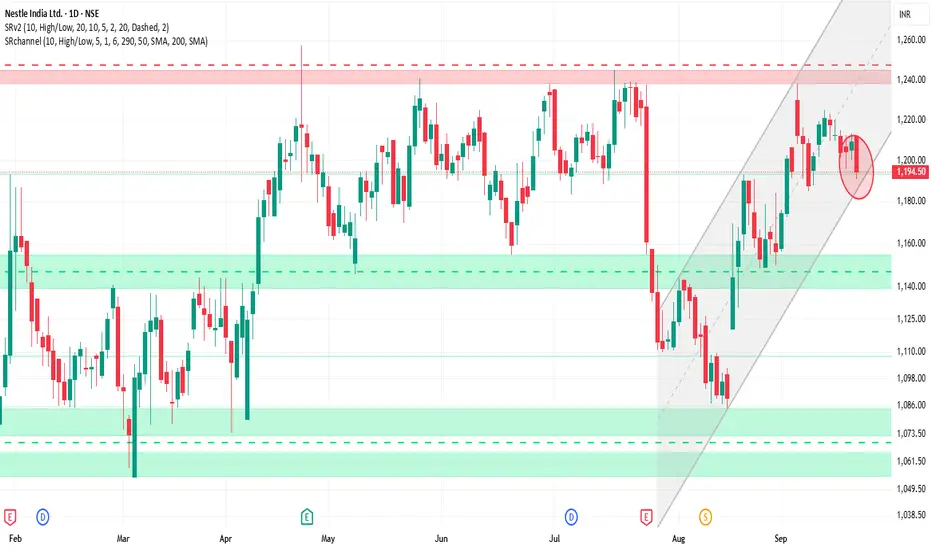
NESTLEIND 1D Time frame📊 Current Snapshot
Closing Price: ₹1,194.50
Day’s Range: ₹1,190.20 – ₹1,212.00
52-Week Range: ₹1,055.00 – ₹1,389.00
Volume: Approximately 2.4 million shares traded
Market Cap: ₹2,30,337 Crores
P/E Ratio: 78.40 (reflecting premium valuation)
Dividend Yield: 2.26%
⚙️ Technical Indicators
Relative Strength Index (RSI): 47.51 – Neutral
Moving Average Convergence Divergence (MACD): -4.12 – Bearish
Moving Averages: Mixed signals; short-term averages above the current price, while long-term averages are below, indicating potential resistance.
Pivot Points: Central pivot around ₹1,194.73, suggesting a balanced market sentiment.
🎯 Potential Scenarios
Bullish Scenario: A breakout above ₹1,197.26 with strong volume could target ₹1,202.16 and higher levels.
Bearish Scenario: Failure to hold above ₹1,187.46 may lead to a decline toward ₹1,183.83.
⚠️ Key Considerations
Market Sentiment: Nestlé India has shown strong performance recently, but broader market conditions can impact its movement.
Volume Analysis: Watch for volume spikes to confirm breakout or breakdown signals.
Technical Indicators: While the RSI indicates a neutral stance, the MACD and moving averages suggest caution.
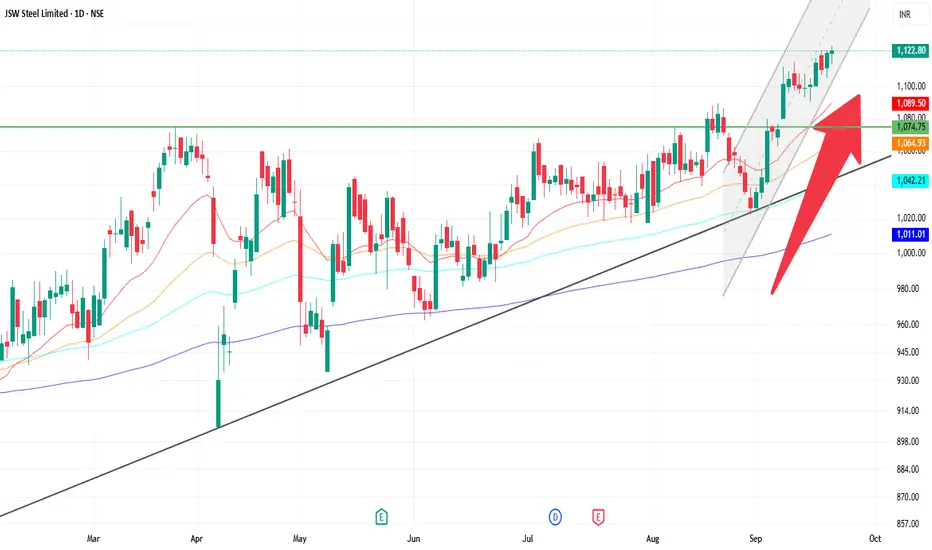
JSWSTEEL 1D Time frame📊 Current Overview
Current Price: Around ₹1,122 – ₹1,123
Recently touched 52-week high levels.
Trend is overall bullish with strong momentum.
🔍 Support & Resistance
Immediate Support: ₹1,110 – ₹1,100
Next Support: ₹1,085
Immediate Resistance: ₹1,125 – ₹1,130
Next Resistance: ₹1,140+
📈 Indicators
Moving Averages (5, 10, 20, 50, 100, 200): All pointing bullish, price is trading above them.
RSI (14): Around 67, showing strong momentum but close to overbought zone.
MACD & ADX: Both suggest continuation of uptrend.
🎯 Possible Scenarios
Bullish Side: A breakout above ₹1,130 can push towards ₹1,140 – ₹1,150.
Bearish Side: If price rejects at resistance, it may pull back to ₹1,110, and deeper towards ₹1,085.
TCS 1D Time frameCurrent Price: Around 3,174
Current Trend: Stock is in a sideways to slightly bullish phase after consolidation.
Support Zone: Strong support at 3,140 – 3,150. Buyers may defend this level.
Resistance Zone: Key resistance at 3,200 – 3,220. A breakout above 3,220 can trigger fresh upside.
Indicators: Daily candles indicate mild buying interest; volume is stable.
Outlook:
Above 3,220 → bullish momentum may extend toward 3,250+.
Below 3,140 → weakness may push toward 3,100–3,120.
👉 In short:
Range: 3,140 – 3,220.
Neutral to slightly bullish; breakout will determine next move.