Mahindraandmahindra

M&M triangle pattern breakout with reverse Head & ShoulderM&M triangle pattern breakout with reverse Head & Shoulder NSE:M_M
MEDIUM TERM TRADE - M&MA clean pole and Flag pattern in M_M.
M_M is consolidating inside an descending triangle which can be considered as a flag in higher time frame for a long time . now it has given a breakout from the pattern and we can try for an opportunity in here.
entry = 785
target = 950
sl = 750


Mahindra cie low risk share good momentum as well as good futureAS seen in Chart, ask in comment if u need to tell me something, this is just the idea provided.

Simple Trade Setup | M&M | 09-08-2021NSE:M_M
Simple Trade Setup for M_M for 09-08-2021.
Chart and levels are easy to understand.
Do comment your doubt or suggestion.
all the best for trading in next week.

mahindra and mahindra chart analysismahindra and mahindra chart analysis for intraday and swing trading

Mahindra & Mahindra : head and shoulder weekly potential shorti would like short Mahindra and Mahindra for the breach of a possible head and shoulder pattern working out.
all timeframes are in sideways right however for swing trades it may make sense to see if momentum dips further below 40
to be sure.Auto sector also in general is not doing that great either in short term.


M&MPole and flag pattern in progress on chart. One can look for long opportunities, if breakout happens on chart.

Add M&M to your WatchlistIt is in a good phase and can give breakout in either direction and in Few Weeks


mahindra and mahindra chart analysismahindra and mahindra chart analysis for intraday and swing trading

m_m_if market is positiveGuys, keep eye on M_M. If market again become bullish then one can go bullish in M_M
(for educational purpose only)

Mahindra and Mahindra has formed a good pattern, good swingMahindra and Mahindra has been going down for a long time and now it has formed a pattern, if it reaches the support zone, we can expect a good up move to 800-850 range.

m&m opened its gates for lower levels. stay cautiousDescription given in chart itself.
stay cautious if you have this in your portfolio
Disclaimer: Only for educational purpose. Do your due diligence before investing/trading.

15 MIN M&M CHART - HOLD FEW DAYS15 MIN M&M ANALYSIS. HOLD THE TRADE A FEW DAYS IT HAS A BULLISH VIEW. TRADE WITH DISCIPLINE.


Mahindra And Mahindra - Long till July End /August 1st Week.Mahindra And Mahindra has formed a beautiful cup and handle and first target of 1011 can be expected by August beginning, traders can go long on M&M, and Fibo Extension levels with trend angle gives clear target of 1000+ in July.

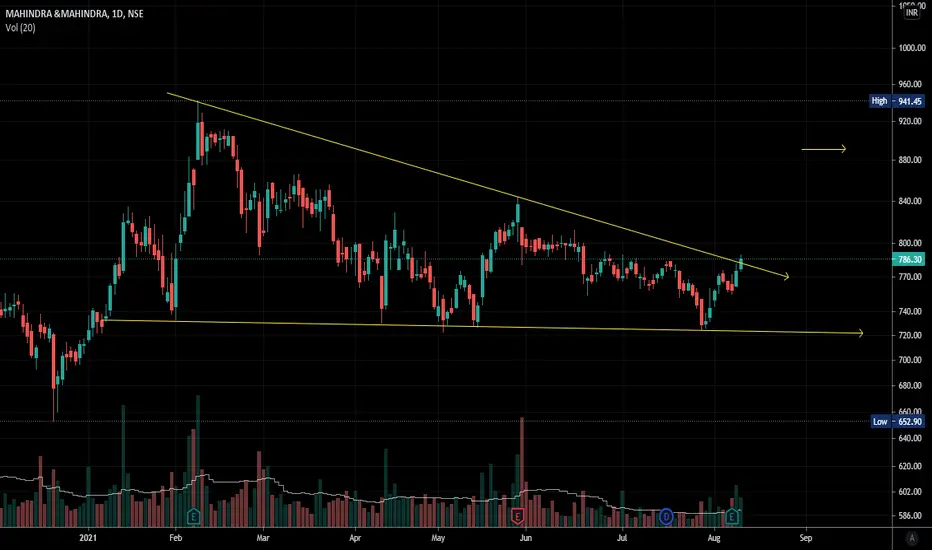
Mahindra & Mahindra - Potential Bullish ScenarioKey Highlights:
1. Bullish market structure
2. Trendline breakout
3. Bullish above 785
4. Support zone: 736-753
5. Target: 816, 865, 911, 952
6. Stop loss: 730
You are always advised to use an appropriate Risk-Reward ratio as per your strategy.
P.S: This is NOT investment advice. This chart is meant for learning purposes only. Invest your capital at your own risk.

M_M trading strategy M & M first gave breakout patterns and now it is creating a symmetrical triangle pattern so keep your eye on it and trade on levels
