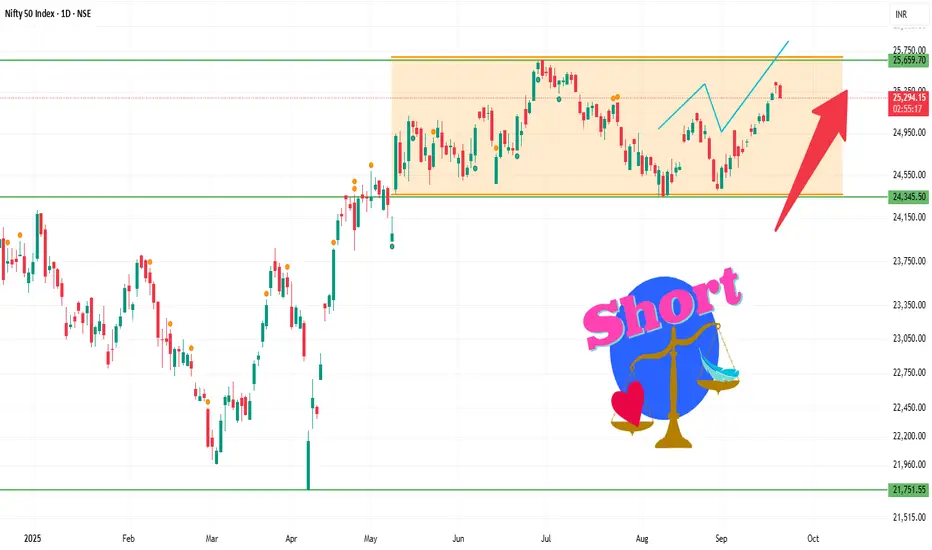
Nifty 1D Time frameCurrent Facts
Current Level: ~25,300–25,310
Trend: Mildly bullish; Nifty is trading above short-term moving averages (20-day & 50-day EMA).
Momentum Indicators:
RSI (14-day): ~60 → positive but not overbought.
MACD: Positive → supports short-term bullish bias.
Price Action: Daily candles show small upper wicks → slight profit-booking near resistance levels.
⚙️ Outlook
Bullish Scenario:
Holding above 25,270 → retest 25,350–25,370 and possibly 25,420–25,450.
Range / Consolidation:
Price oscillates between 25,270 – 25,350 → sideways action expected.
Bearish Scenario:
Close below 25,250 → downside risk toward 25,180–25,200 or lower.
⚠️ Facts
25,300–25,310 acts as a short-term pivot — above it favors bulls, below it favors bears.
Immediate resistance is at 25,350–25,370; breakout here can trigger upside momentum.
Support at 25,250 is crucial; failure to hold may result in deeper correction.
Mahindraandmahindra
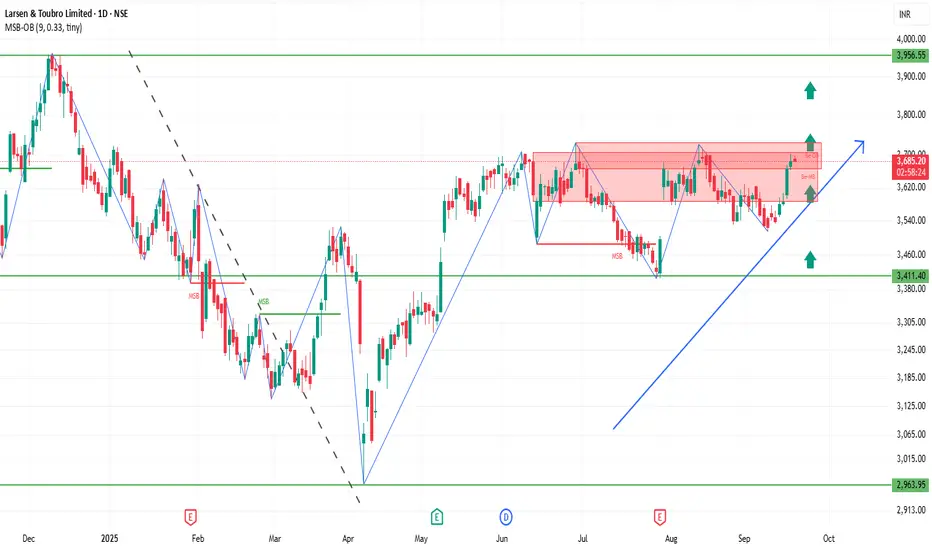
LT 1D Time frameCurrent Snapshot
Price: ₹3,695 (slightly higher than yesterday’s level).
Stock is holding near resistance but still above strong supports.
Trend is bullish to sideways.
📌 Key Levels
Immediate Resistance: ₹3,740 – ₹3,800.
Immediate Support: ₹3,650 – ₹3,670.
Stronger Support: ₹3,600, and deeper support near ₹3,100 on longer timeframe.
✅ Outlook
If LT sustains above ₹3,670, bulls remain strong and a breakout above ₹3,740 could push toward ₹3,800+.
If it falls below ₹3,650, then short-term weakness may test ₹3,600.
As long as it stays above ₹3,600, the larger trend remains intact.
INFY 1D Time frameCurrent Snapshot
Price is trading near ₹1,545.
Stock is holding above the 50-day moving average, showing underlying strength.
Near medium-term averages (100-day and 200-day), so trend is stable with mild bullish bias.
⚙️ Indicators / Momentum
RSI (14): Mid-to-high range, showing steady strength but not overbought yet.
MACD: Positive, suggesting upward momentum is intact.
Overall Momentum: Slightly bullish with chances of consolidation near resistance.
📌 Key Levels
Immediate Resistance: ₹1,550 – ₹1,560.
Immediate Support: ₹1,510 – ₹1,520.
Stronger Support: ₹1,450 – ₹1,480 zone if bigger pullback happens.
✅ Outlook
As long as the stock stays above ₹1,510, trend remains bullish.
Breakout above ₹1,560 could open further upside targets.
If price slips below ₹1,510, short-term weakness may pull it toward ₹1,450 – ₹1,480.

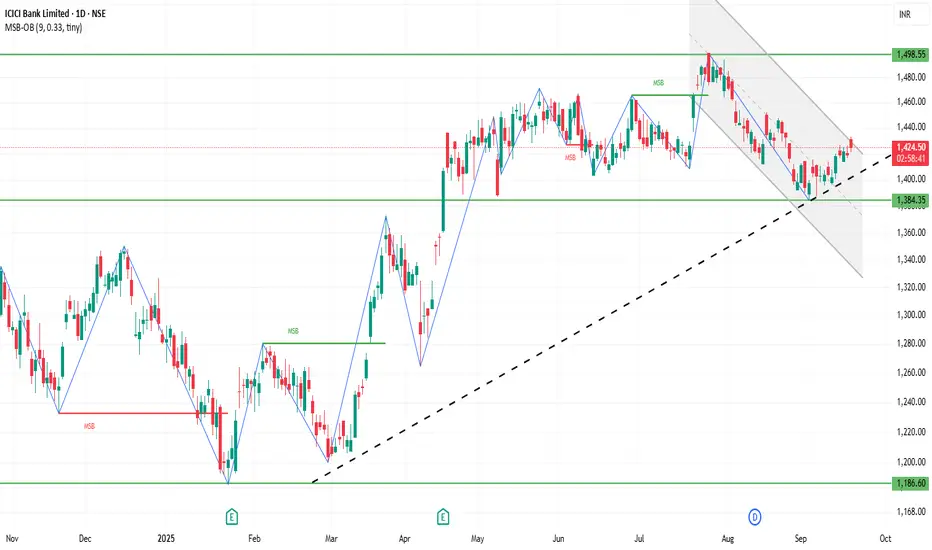
ICICIBANK 1D Time frameCurrent Snapshot
Price is around ₹1,402 – ₹1,420.
Stock is facing some short-term weakness, trading close to or slightly below short-term averages.
Longer-term trend is still stable as the price is well above its 200-day moving average.
⚙️ Indicators / Momentum
RSI (14): Neutral zone, not overbought or oversold.
MACD: Mixed, showing weak bearish pressure in the short term.
Moving Averages:
Short-term (5–10 day) → Mixed / sideways.
Medium-term (50–100 day) → Acting as resistance.
Long-term (200 day) → Still supportive, trend remains intact.
📌 Key Levels
Immediate Resistance: ₹1,440 – ₹1,450.
Immediate Support: ₹1,394 – ₹1,400.
Stronger Support: ₹1,340 – ₹1,350 zone.
SENSEX 1D Time frameCurrent Status
Sensex Level: 82,623
Change: +594.95 points (+0.73%)
Opening: 81,852
Day’s Range: 81,780 – 82,443
52-Week Range: 71,425 – 85,978
📈 Market Sentiment
Trend: Mildly bullish
Leading Sectors: Auto, Realty, Telecom
Investor Mood: Optimistic, but watching global cues
🔍 Key Levels to Watch
Immediate Support: 81,800 – 81,850
Resistance Zone: 82,400 – 82,500
Psychological Milestone: Breaking above 82,500 may push higher
🧭 Outlook
Sensex is showing positive momentum supported by strong sectors.
Bulls are slightly stronger, but resistance near 82,400–82,500 may cap upside.
A drop below 81,800 could bring downside pressure toward 81,500–81,400.

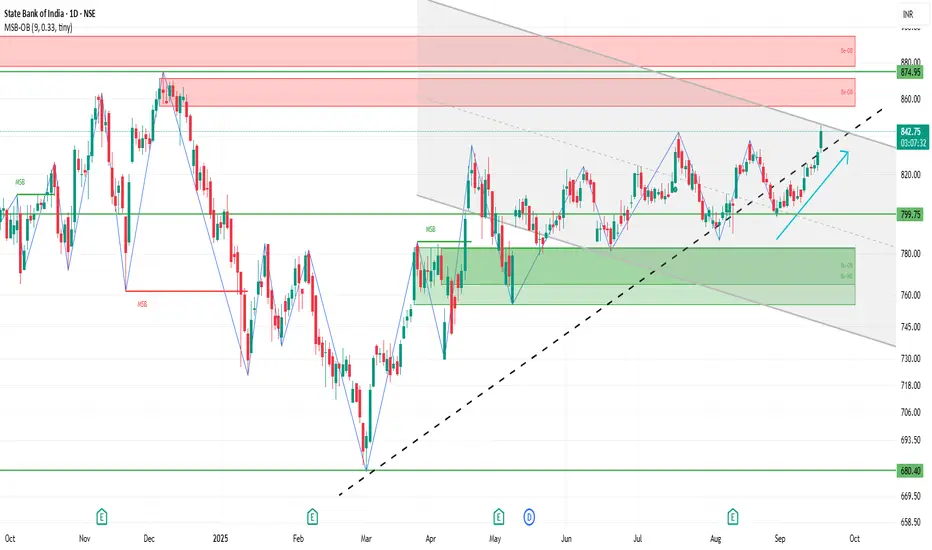
SBIN 1D Time frameCurrent Stock Price
Current Price: ₹842.25
Day’s Range: ₹831.00 – ₹845.80
52-Week Range: ₹680.00 – ₹875.45
Market Cap: ₹7.68 lakh crore
P/E Ratio: 9.77
EPS (TTM): ₹86.06
Dividend Yield: 1.91%
Book Value: ₹527.66
📈 Trend & Outlook
Short-Term Trend: Bullish; trading above key support levels and showing positive momentum.
Resistance Levels: ₹845.80 (day’s high), ₹875.45 (52-week high)
Support Levels: ₹831.00 (day’s low), ₹818.32 (weekly pivot)
Investor Sentiment: Positive, with institutional interest and favorable outlook.
🧭 Key Notes
Immediate support around ₹831–₹818; if it holds, price may rise toward resistance.
If it drops below ₹818, downside may extend toward ₹800 or lower.
Overall, bulls are slightly stronger, but watch resistance near ₹845–₹875.
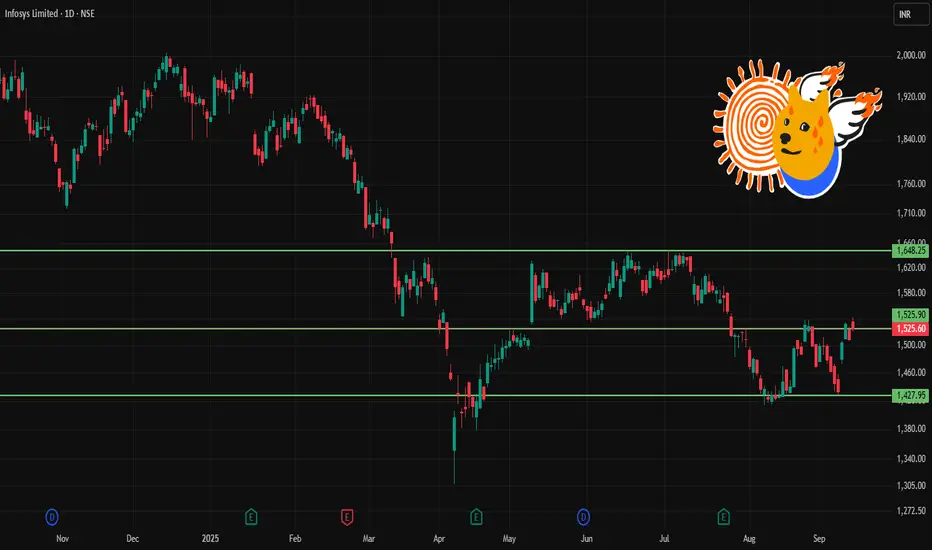
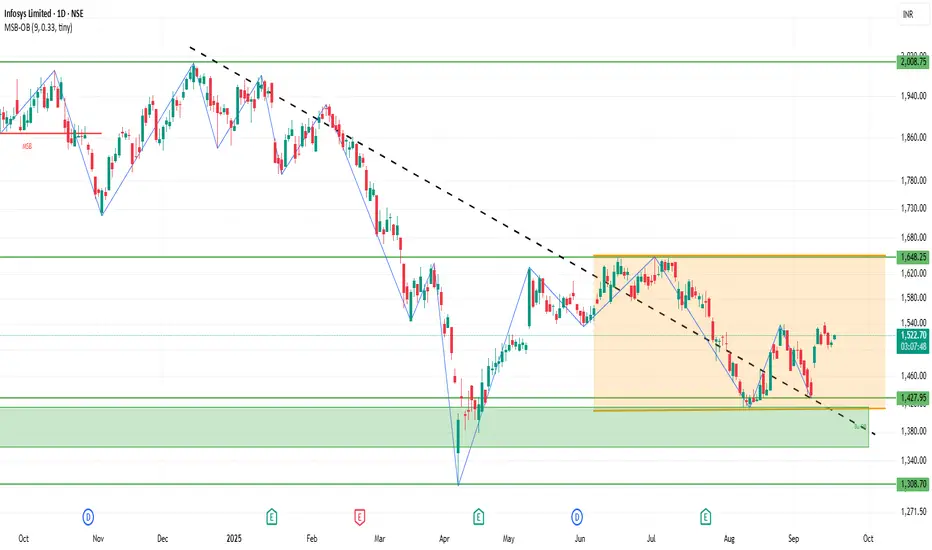
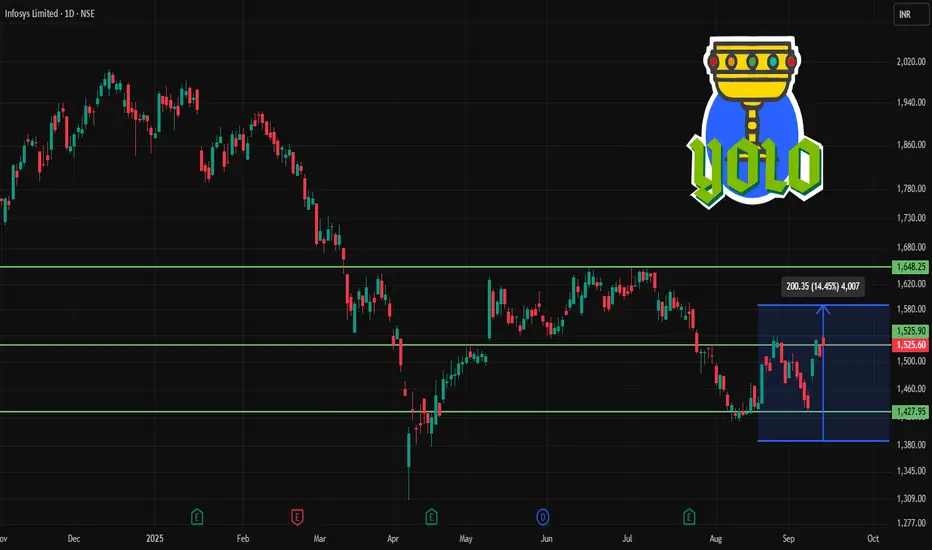
INFY 1D Time frameCurrent Stock Price
Current Price: ₹1,525.60
Day’s Range: ₹1,521.10 – ₹1,542.90
52-Week Range: ₹1,307.00 – ₹2,006.45
Market Cap: ₹6.33 lakh crore
P/E Ratio (TTM): 23.0
EPS (TTM): ₹65.63
Dividend Yield: 2.82%
Book Value: ₹230.65
📈 Trend & Outlook
Short-Term Trend: Bullish; the stock is trading near its 52-week high, indicating strong investor confidence.
Resistance Levels: ₹1,542.90 (day’s high), ₹2,006.45 (52-week high).
Support Levels: ₹1,521.10 (day’s low), ₹1,500.00 (psychological support).
Investor Sentiment: Positive, with strong institutional interest and favorable analyst outlooks.
🧭 Analyst Insights
Valuation: The stock is trading at a P/E ratio of 23.0, which is below the sector average of 28.56, suggesting potential value.
Growth Prospects: The company’s strong earnings growth and robust capital position support its premium valuation.
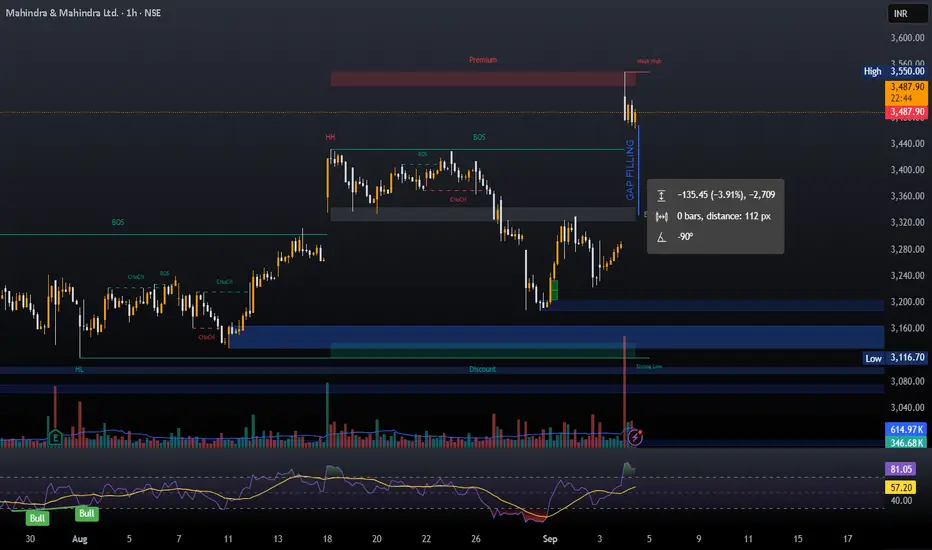
M&M ShortThe GST news has already been factored in and M&M was already trading at its al tie high. A gap up at all time high always gives an opportunity for a sell trade for the gap filling. One can look for sell in M&M with 3550 as resistance zone. Keep track of this chart and see if this concept works or not. Follow for more such concepts.
Jai Shree Ram.
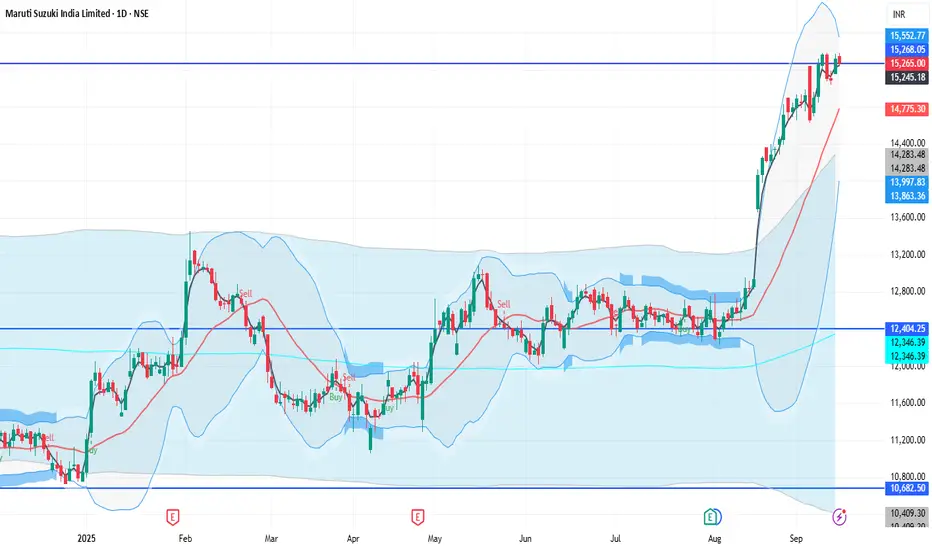
MARUTI 1D Time frame📊 Price Levels
Current Price: Around ₹15,265
Day’s High: ~₹15,378
Day’s Low: ~₹15,249
52-Week High: ~₹15,384
52-Week Low: ~₹10,725
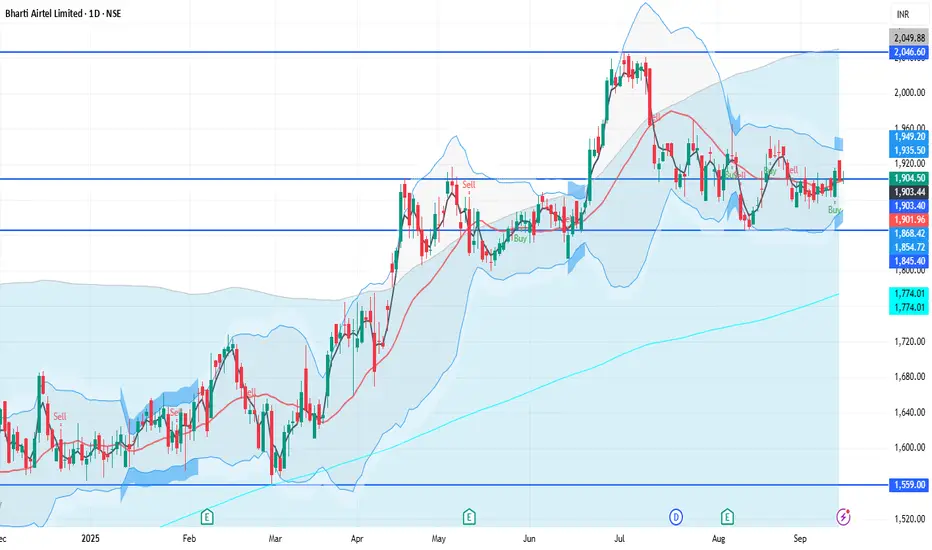
BHARTIARTL 1D Time frameUpdated Snapshot
Current Price: ₹1,903 – ₹1,906
Day’s Range: ₹1,901.60 – ₹1,925
Previous Close: ₹1,902.60
🔹 Support & Resistance
Support 1: ₹1,900 – ₹1,895
Support 2: ₹1,880 – ₹1,870
Resistance 1: ₹1,920 – ₹1,925
Resistance 2: ₹1,950 – ₹1,960
HDFCBANK 1D Time framePrice Action
Current Price: ₹967.10 (approx)
Day’s Range: ₹965 – ₹970
52-Week Range: ₹806.50 – ₹1,018.85
🔹 Support & Resistance
Immediate Support: ₹960 – ₹958
Next Support: ₹954 – ₹950
Immediate Resistance: ₹970 – ₹975
Higher Resistance: ₹980

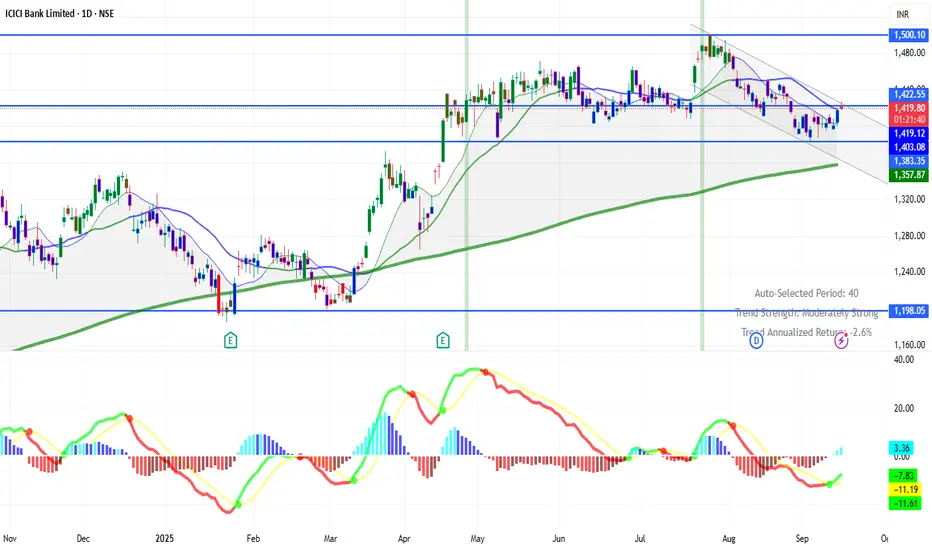
ICICIBANK 1D Time frameCurrent Price: ₹1,422 (approx)
Previous Close: ₹1,417.70
52-Week Range: ₹1,186 – ₹1,500
🔹 Support & Resistance (Daily)
Immediate Support: ₹1,390 – ₹1,392
Next Support: ₹1,360 – ₹1,365
Immediate Resistance: ₹1,407 – ₹1,415
Next Resistance: ₹1,416+
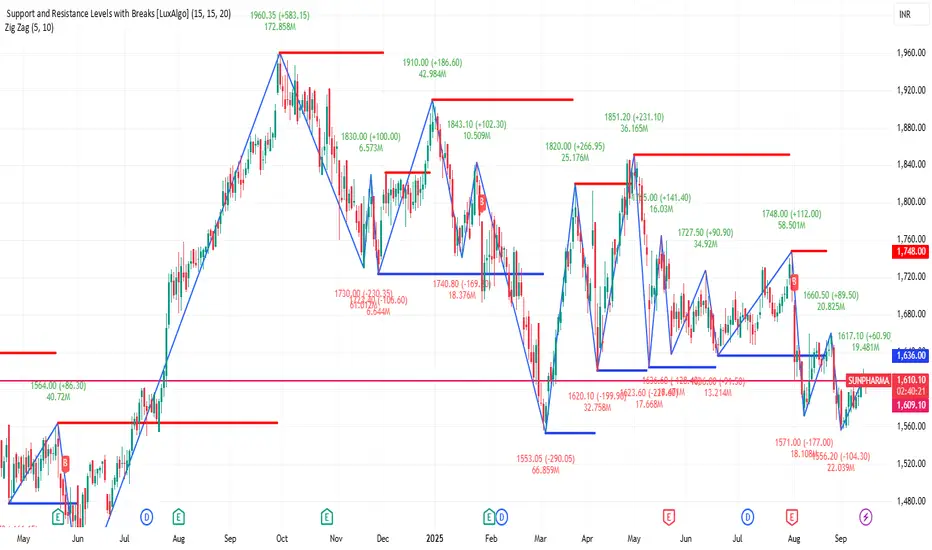
SUNPHARMA 1D Time frameUpdated Snapshot
Current Price: ₹1,607
Day’s Range: ₹1,595 – ₹1,617
Previous Close: ₹1,610
🔹 Support & Resistance
Immediate Support (S1): ₹1,600 – ₹1,595
Next Support (S2): ₹1,585 – ₹1,580
Immediate Resistance (R1): ₹1,615 – ₹1,617
Next Resistance (R2): ₹1,630 – ₹1,635
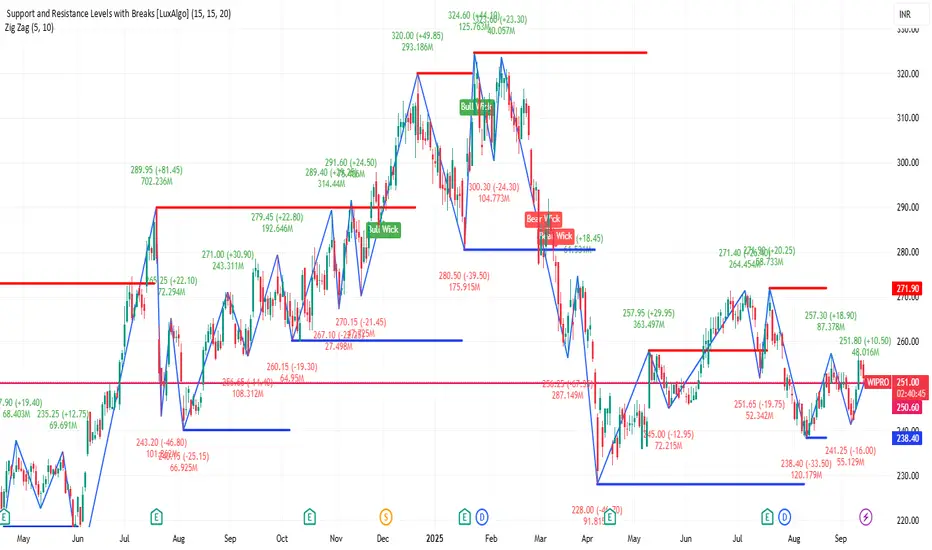
WIPRO 1D Time frameCurrent Price
₹251.50
🔹 Market Snapshot
Day’s Range: ₹249.60 – ₹251.79
Previous Close: ₹251.94
52-Week Range: ₹228.00 – ₹324.60
Market Cap: ₹2.64 lakh crore
P/E Ratio (TTM): 19.53
P/B Ratio: 3.20
Dividend Yield: 2.39%
Book Value per Share: ₹78.57
EPS (TTM): ₹12.84
INFY 1D Time frameCurrent Price & Trend
Current Level: ~₹1,525
Trend: Neutral to bullish → stock is slowly recovering from recent lows.
Momentum: Buying support is visible near ₹1,500 zone.
Indicators
RSI: Around 59 → healthy, not yet overbought.
MACD: Positive crossover → signals upward momentum.
Moving Averages: Price is above short-term averages, but medium-term trend is still consolidating.
Bullish Scenario
If INFY sustains above 1,540, it can move toward 1,560 – 1,600.
A breakout above 1,600 could trigger further rally toward 1,650.
NIFTY 1D Time frameCurrent Price & Trend
Level: ~25,114
Day’s Range: 25,038 – 25,139
52-Week Range: 21,743 – 26,277
Trend: Neutral to bullish; trading near the higher end of the yearly range.
Bullish Scenario
If NIFTY sustains above 25,000, upside targets are 25,250 – 25,500 in the short term.
Strong buying volumes could lead to new highs beyond 26,000.

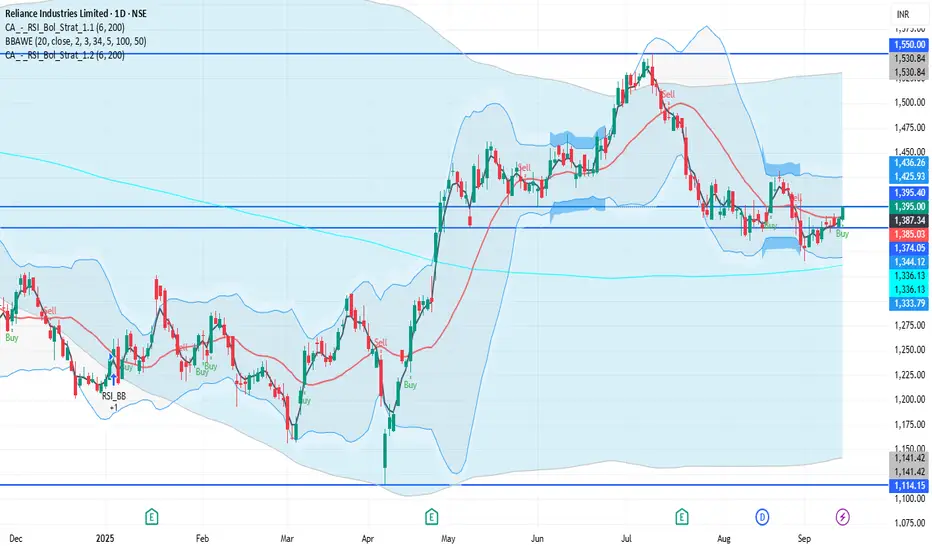
RELIANCE 1D Time frameCurrent Price & Trend
Price: ₹1,395.00
Trend: Neutral to mildly bullish; trading approximately 10.1% below its 52-week high of ₹1,551.00, achieved on July 9, 2025.
Momentum: Indicators suggest a neutral to slightly bullish outlook.
Bullish Scenario
Breakout Above ₹1,396: A sustained move above ₹1,396 could target ₹1,400 – ₹1,420 in the short term.
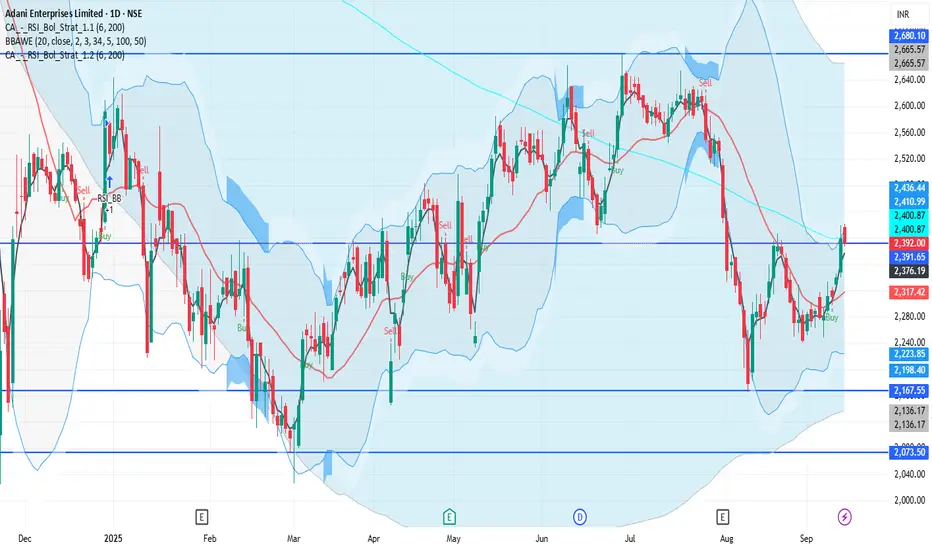
ADANIENT 1D Time frameCurrent Price & Trend
Price: ₹2,392.00
Trend: Neutral; trading approximately 25.5% below its 52-week high of ₹3,211.00, achieved on July 1, 2025.
Momentum: Indicators suggest a neutral to slightly bearish outlook.
Bullish Scenario
Breakout Above ₹2,420: A sustained move above ₹2,420 could target ₹2,440 – ₹2,450 in the short term.
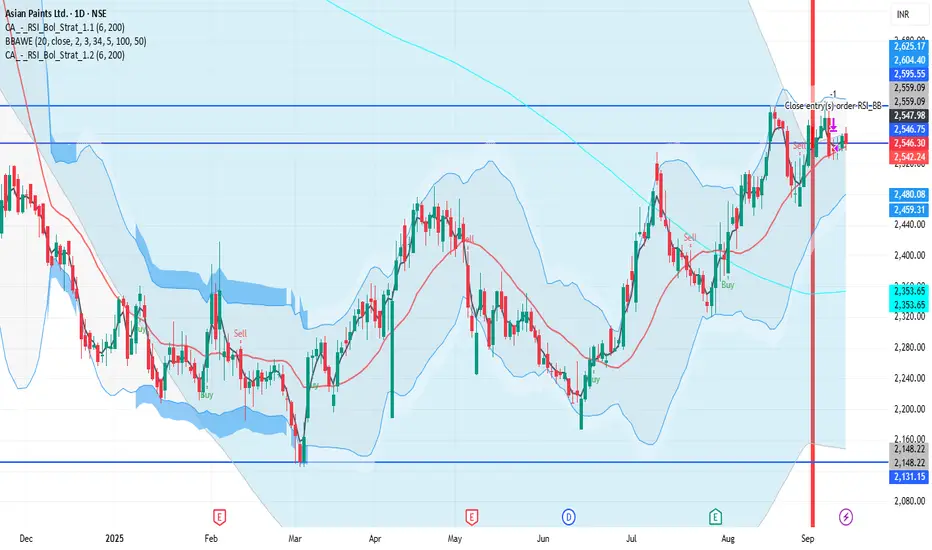
ASIANPAINT 1D Time frameCurrent Price & Trend
Price: ₹2,546.30
Trend: Consolidating near recent highs; trading approximately 25% below its 52-week high of ₹3,394.90.
Momentum: Indicators suggest a neutral to slightly bearish outlook.
Bullish Scenario
Breakout Above ₹2,580: A sustained move above ₹2,580 could target ₹2,600 – ₹2,620 in the short term.
⚠ Bearish Scenario
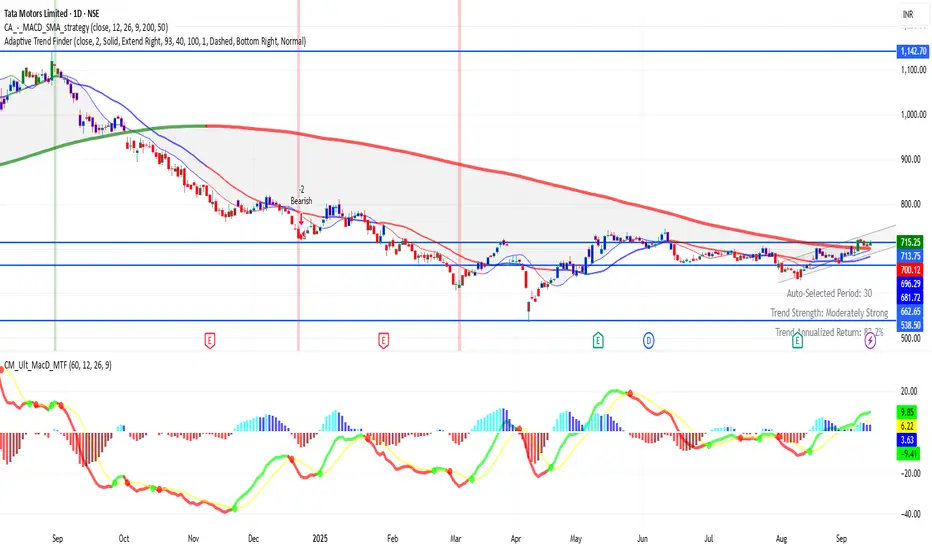
TATAMOTORS 1D Time frameCurrent Status
Price is around ₹715
The stock has been showing strength recently, with many of its moving averages (short- to long-term) supporting the rise.
Technical indicators like RSI, MACD, ADX etc. lean positive — buyers seem to have the upper hand.
There’s an inverted Head & Shoulders pattern forming, which is a bullish reversal signal if confirmed. Support zones are holding up so far.
Bullish Scenario
If Tata Motors stays above ₹700–705 support and breaks past ~₹720–725 with volume:
Possible upside to ~₹730-₹740
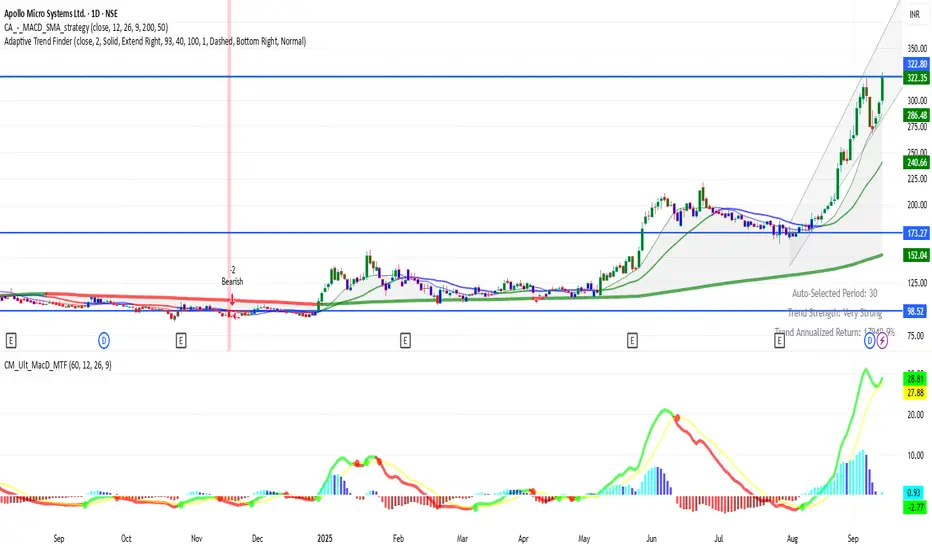
APOLLO 1D Time frame Current Status
Price: ₹322
Trend: Strong uptrend, stock recently made fresh highs.
Momentum: Very strong, but slightly overbought in daily indicators.
Key Levels
Immediate Resistance: ₹326 – ₹330 (recent high zone)
Next Resistance: ₹340 – ₹345 (if breakout continues)
Immediate Support: ₹300 – ₹305
Stronger Support: ₹280 – ₹285
HDFCBANK 1D Time frame📉 Current Market Snapshot
Closing Price: ₹967.80
Day's Range: ₹962.25 – ₹970.75
52-Week High: ₹1,018.85
52-Week Low: ₹806.50
Market Cap: ₹14,85,200 crore
P/E Ratio (TTM): 21.44
P/B Ratio: 3.38
Dividend Yield: 1.13%
EPS (TTM): ₹45.97
Book Value: ₹339.84
Face Value: ₹1.00
Volume: 14,363,519 shares
VWAP: ₹966.64

INFY 1D Time frame📉 Current Market Snapshot
Current Price: ₹1,525.60
Previous Close: ₹1,509.70
Day's Range: ₹1,521.10 – ₹1,542.90
52-Week High: ₹2,006.45
52-Week Low: ₹1,307.00
Market Cap: ₹6,33,794 crore
P/E Ratio: 23.0
Dividend Yield: 2.82%
ROE: 28.72%
Debt-to-Equity Ratio: 0.09
Beta: 1.11
EPS (TTM): ₹65.63
Face Value: ₹5.00
VWAP: ₹1,529.86
Volume: 12,856,963 shares
ATR (14): ₹5.72
MFI: 71.75