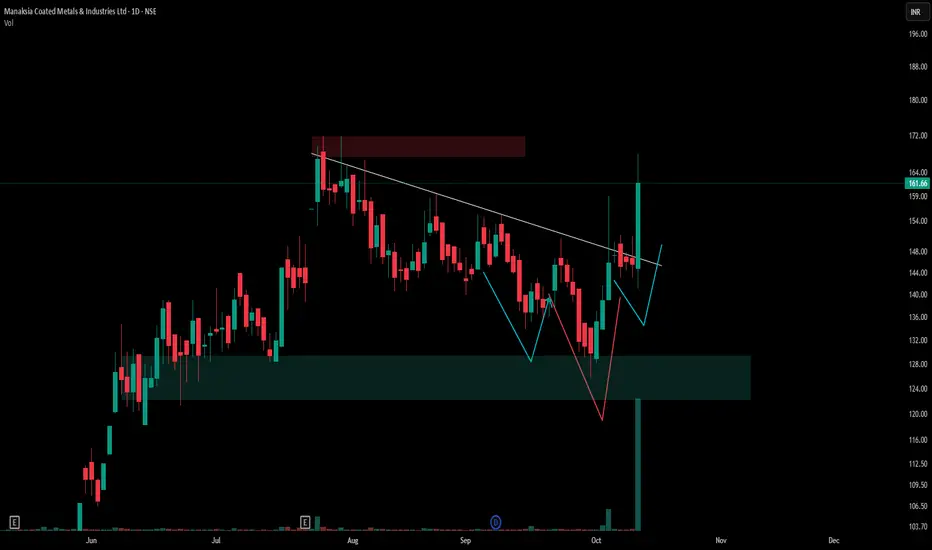
Observing Key Structural Patterns in Manaksia Coated MetalsThe daily chart of Manaksia Coated Metals & Industries Ltd (NSE) displays a confluence of notable technical formations. There is a clearly defined demand zone (highlighted in green) that has provided support for multiple sessions, as well as a supply area (marked at the upper region), signifying previous resistance.
A visually tight Volatility Contraction Pattern (VCP) is present, where price swings narrow progressively, indicating potential accumulation and increasing trader interest. The chart also reveals an inverted head and shoulders pattern, depicted using blue and red lines, which is often recognized as a classic reversal formation in technical analysis.
No attempt is made to forecast price movement; the Chart purely reflects observed market structure and patterns.
Disclaimer
This post is for educational and observational purposes only. It does not constitute financial advice or a trading recommendation. Always conduct your own research and consult a certified financial advisor before making investment decisions.
Manakslacoated
Manaksla (D) - Surges 11%, Challenges All-Time High ResistanceManaksla Coated Metals & Ind is showing significant strength, with a powerful surge today pushing it directly against its all-time high resistance. While the underlying trend is bullish, a confirmed breakout is still needed to signal the next leg up.
The Context: Uptrend and Consolidation
The stock has been in a healthy uptrend, which recently culminated in the formation of a new All-Time High (ATH). Following this peak, the stock entered a sideways consolidation phase over the past few weeks, a common and often constructive pattern as it absorbs previous gains before its next potential move.
Today's Powerful Move
Today's session (Monday, October 13, 2025) saw a significant increase in buying pressure:
- Strong Price Gain: The stock surged by +11.05% .
- High Volume: This move was supported by a robust volume of 25.95 million shares .
Crucially, despite this strong surge, the stock closed the day still within its consolidation range , right at the doorstep of the ATH resistance. This sets up a critical test for the days ahead.
This bullish intent is backed by strong technical indicators. The short-term Exponential Moving Averages (EMAs) and the Relative Strength Index (RSI) are both in a bullish state across the Monthly, Weekly, and Daily timeframes.
Outlook and Key Levels to Watch
The immediate future of the stock hinges on its ability to overcome the ATH resistance.
- Bullish Breakout Trigger: A decisive close above the All-Time High on strong volume would confirm a breakout. This would signal a continuation of the primary uptrend, with a potential next target of ₹210 .
- Potential Pullback Scenario: If the stock is rejected from this resistance and fails to break out, it may pull back towards the lower end of its consolidation range. The key support level to watch is ₹128 , which, as you noted, could present a favorable buying opportunity for those looking to enter on a dip.
In conclusion, Manaksla is at a critical juncture. The battle at the all-time high resistance is the key event to monitor. A breakout would affirm the bulls are in control, while a rejection would suggest a longer period of consolidation.
