MANAPPURAM FINANCE LTDMANAPPURAM – The stock has been in a strong uptrend channel, after hitting 285, it corrected and formed a falling wedge. Now it’s attempting a breakout above the wedge.
Buy above 270 with the targets of 285 and 300 | Stop loss 260
Manappuramfinance

Manappuram Finance LtdThe stock is currently moving within an ascending broadening wedge, a pattern that usually indicates a bearish reversal. However, it is forming higher highs and higher lows. The support line has been well respected, with multiple touches and no breakdowns.
Consider buying above 285, aiming for targets of 315 and 350.

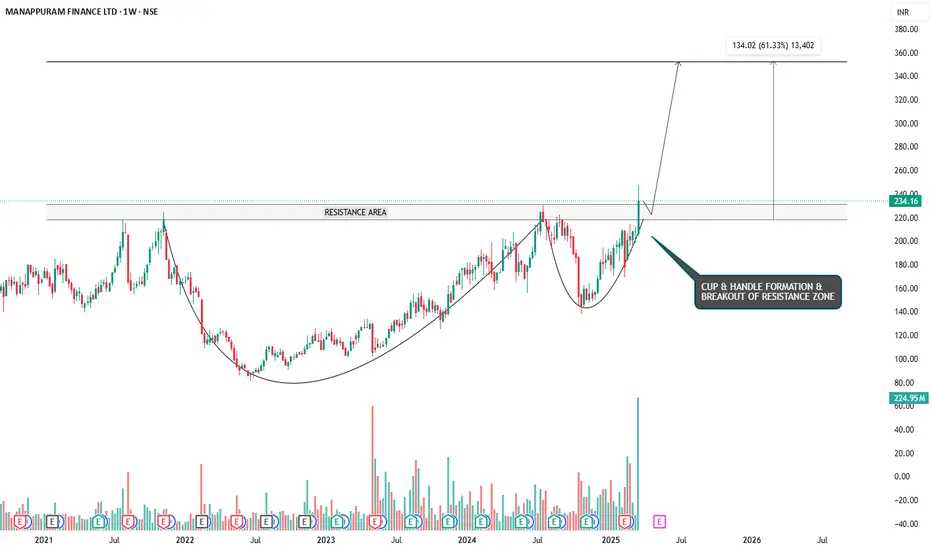
RIDING THE WAVE - CUP & HANDLE BREAKOUT IN MANAPPURAM FINANCESymbol - MANAPPURAM
CMP - 234.16
Manappuram Finance is a Non-Banking Finance Company (NBFC), which provides a wide range of fund based and fee based services including gold loans, money exchange facilities, etc. The Company is a Systemically Important Non-Deposit taking NBFC.
Manappuram Finance Ltd. has recently demonstrated a significant bullish breakout, having formed a classic cup and handle pattern on a larger time frame and breaking out with strong volume. The cup and handle pattern is a well-regarded bullish breakout formation, and when it occurs on weekly or larger time frames, it tends to be highly reliable, indicating a robust upward momentum.
Currently, the stock price may retest the breakout zone, which coincides with the previous resistance area; now turned support - around the 230 to 217 range. This retest is a natural price action behavior and offers an attractive entry point for long positions before the stock continues its upward trajectory.
The target for this breakout, based on technical projections, is around 350, representing a 60% upside from the current market price. Given the strength of the breakout and the established pattern, this target appears achievable over the medium term.
For risk management, a stop loss can be placed around the 197 level, providing a reasonable cushion in case of a price reversal.
From a broader perspective, the formation of a cup and handle pattern coupled with a successful breakout on higher time frames adds a significant bullish bias to the stock. Investors looking for a favorable risk-to-reward setup may find this an opportune time to initiate or add to their positions in Manappuram Finance.
Disclaimer: The information provided here should not be construed as a buy or sell recommendation. It reflects my personal analysis and my trading position. Please consider this trading idea for educational purposes only. Thank you!
MANAPPURAM FINANCE LTD - APPROACHING RESISTANCE AREASymbol - MANAPPURAM
Manappuram Finance Ltd. has been experiencing a recovery from lower levels in recent weeks. The stock has bounced back from support zones and is now testing key resistance areas. However, it faces considerable challenges at higher levels, showing signs of consolidation as it approaches its resistance zones.
The overall trend appears to be in recovery, following a significant dip. However, the stock is facing resistance at higher levels, indicating a potential pause or consolidation before any significant movement.
Short-term trend looks slightly bearish, as the stock has encountered selling pressure at resistance levels and is currently consolidating. Long-term trend remains positive, driven by the company’s strong fundamentals in the gold loan market.
The stock is currently trading within an ascending triangle pattern and is consolidating near key resistance levels. My personal bias is towards the downside, and we could potentially see a sell-off from the resistance zone towards the triangle support trendline, with the possibility of a move below it.
The trade strategy could involve looking for short opportunities near the resistance zone, especially if the stock fails to break out and begins to reverse. However, if the stock manages to break above the resistance trendline of the ascending triangle, the bias would shift to the upside.
Disclaimer - Do not consider this as a buy/sell recommendation. I'm sharing my analysis & my trading position. You can track it for educational purposes. Thanks!

MANAPPURAM - SWING TRADE - 23rd December #stocks#MANAPPURAM (1W TF)
Swing Trade Analysis given on 23rd December, 2023
Pattern: ASCENDING CHANNEL BREAKOUT
- Breakout of Channel Resistance - Done ✓
- Volume Spike Buildup - Done ✓
- Retracement & Consolidation - In Progress
#stocks #swingtrade #chartanalysis #priceaction #traderyte

Breakout In Manappuram Finance !Manappuram Finance has just demonstrated a noteworthy breakout from an Ascending Channel pattern, which has helped it hit 52-week high levels. A general bullish biasness towards the stock is indicated by this upturn.
After carefully examining the daily charts, it is apparent that a Change in Polarity (CIP) pattern has developed near the Rs 131 price level. The stock's upward trajectory is thereby strengthened.
Along with this, the stock price managed to sustain above crucial moving averages i.e. 50,100, and 200 SMA. Hence, strong bullish momentum can be expected in upcoming few weeks.
CMP: 146
Buy above 154.
Target: 185-190
Stoploss: 138.
Please do your own research before initiating any trade. Always keep stoploss in order to protect your capital.
#Follow us for more such information and educational ideas. Give it a like if you appreciate the idea. Queries will be answered in comment section.

Manappuram finance trade idea explained I daily make educational content videos for swing / positional trading

MANAPPURAM FINANCE - 87% RETURNS!!!BUY - MANAPPURAM FINANCE
CMP - Rs. 130
Target - 1: Rs. 157
Target - 2: Rs. 209
Target - 3: Rs. 264
.
.
Technicals -
1) Cup and Handle Pattern BO
.
.
Fundamentals -
Manappuram Finance Limited is a retail credit product and financial services provider in India, primarily through its gold loan business.
1) According to the company's financial snapshot, the Price to Earnings Ratio and EV to EBITDA ratios indicate that the company is undervalued.
2) The Debt-to-Equity ratio has decreased, and the book value has increased. The company has seen a steady increase in total assets for the last three years, along with a good return on equity and a good net margin.
.
.
This is just a view, please trade at your own risk.
.
.
Follow me for more!

Manappuram Finance | Long | CMP 110.40Manappuram Finance CMP-110.40 Dated 6 March 2023
1. Trendline fake breakout
2. Increased buy volumes
3. MACD , Stochiastic RSI crossovers
4. Recent buy by SBI-Mutual Fund
Target1- 125.65
Target2- 140.95
SL - 100
Disclaimer :
I am not a SEBI registered Analyst so please do your own Analysis before taking any action.
The above view is shared just for educational purpose.
By no means shall be responsible for any losses amounting out of it incase if any trades on it.
It is just a view, please trade at your own risk.
