Man Industries (W): Bullish, Turnaround with Volatility(Timeframe: Weekly | Scale: Logarithmic)
The stock is in a confirmed structural uptrend (Higher Lows) following a year-long correction. It is currently battling a critical multi-year resistance zone, backed by strong fundamental news and rising volume.
📈 1. The Structural Turnaround (The "Big Picture")
- The Cycle: Trend analysis:
- Consolidation: Jan 2024 – July 2024.
- The Peak (ATH): The stock hit a major high in July 2024
- The Correction: A downtrend followed, bottoming out in March 2025.
- The Reversal: Since March 2025, the stock has shifted character, forming a clear series of Higher Lows, signaling that buyers are stepping in at higher prices.
🚀 2. The Catalyst & Recent Action (Week of Nov 17)
- The Catalyst (The "Why"): The recent surge is driven by the company signing a Memorandum of Understanding (MoU) with Aramco Asia India (a subsidiary of Saudi Aramco) to explore a manufacturing facility in Saudi Arabia. This news triggered the volume spike.
- The Breakout Attempt: Last week (Nov 17-21), the stock attacked the horizontal resistance zone.
- Surge: It rallied +5.60% for the week.
- Volume: The move was supported by 5.22 Million in volume —a significant pickup compared to the "dry" correction phase.
- The Rejection: Despite hitting a new 52-week high intraday (₹472.40 on Nov 20), the stock failed to close above the resistance, facing profit-taking near the highs.
📊 3. Technical Indicators
- Trend: Short-term EMAs are in a PCO (Price Crossover) state on Monthly & Weekly charts, confirming the uptrend.
- Momentum (RSI):
- Weekly/Monthly: RSI is rising, supporting the longer-term bullish view.
- Daily: The Daily RSI dipped on Friday, reflecting the immediate rejection/profit-taking at resistance.
🎯 4. Future Scenarios & Key Levels
The "Shooting Star" style rejection on the weekly chart makes the coming week critical.
🐂 Bullish Case (Breakout Confirmation)
- Trigger: A sustained close above the ₹465–₹475 zone.
- Target 1: ₹545
- Target 2: ₹645 (Blue-sky extension).
🐻 Bearish Case (Support Test)
- Trigger: If the "failed breakout" leads to further profit-taking.
- Support: The immediate support lies at ₹420. Holding this level is crucial to maintain the "Higher Low" bullish structure.
Conclusion
The stock is structurally bullish but is digesting a supply overhang at the All-Time Highs. The Aramco news provides a strong floor, but patience is needed for a decisive close above ₹475 to confirm the next leg up.
Manindustries

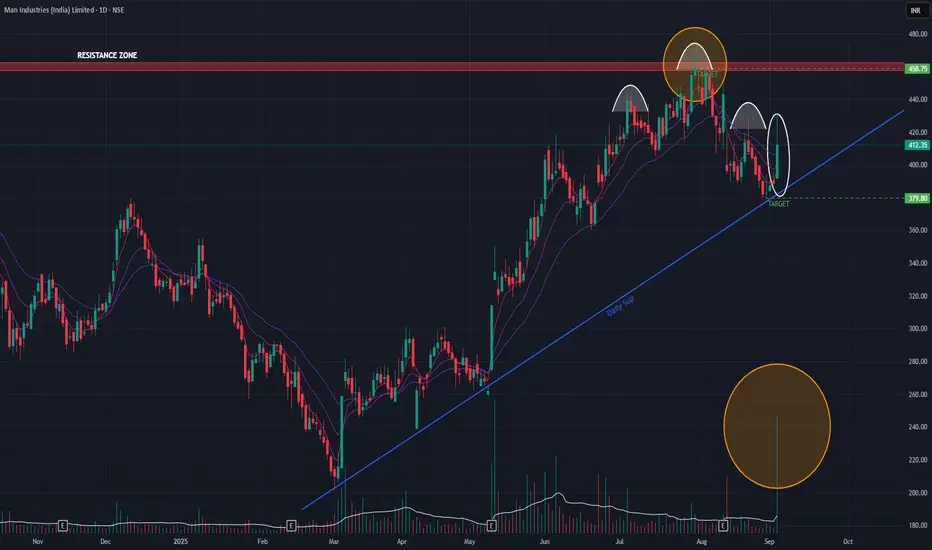
Man Industries (Daily Timeframe) - Upside or Downside??Man industries has been on an uptrend since March 03, 2025 and it tried to BreakOut of the key resistance zone, but invain. Today the stock gained 6% with huge volume. Since March 03, 2025, the stock has been respecting the angular support trendline while making Higher Lows. If we observe carefully, an H&S pattern is formed at the top which indicates a bearish trend. Short-term EMAs are also in Negative Cross-over state.
If the stock gains momentum on the upside, then it may rise to the range of 458. On the downside, the stock may reach the immediate support of 379.
To monitor.
MANINDS - Weekly Chart AnalysisOn a monthly timeframe it's a multiyear breakout. On a weekly timeframe from May2023 it was struggling to sustain above the 147.10 levels. This week though it has managed to sustain above and also closed above its crucial resistance of 178. Now 138-162.50 levels (also swing low) shall act as a support for further move upwards. So this should be an ideal Stoploss levels.
Volumes are very good on monthly as well as weekly timeframe. Price is sailing above its key moving averages.
As off now it has not breached the ATH levels(229-240). So that shall be considered as 1st target as selling pressure shall be seen around these levels.
As per the trend based fib 219, 260 & 375 levels can be tested in future.
Disclaimer: This is just an analysis and not a buy/sell recommendation. If you intend to trade this counter then do your own due diligence and trade at your own risk.

MAN INDUSTRIES: 17 Years BreakoutMANINDS is breaking out of a massive 17 year resistance. Recently also crossed a huge cup and handle pattern. High volumes and High RSI.

MAN Industries Analysis Stock given BO then retesting and again near BO with massive volume burst, follow chart for proper entry and exit levels.

Man Industry base formation doneChart -> Man Industry Weekly
A good base has been broken out with a good candle and volume build-ups.
CMP: 105
Good Range: 95 to 105
Target: 113, 120 and 133
SL: 92 Weekly Close
Disclaimer: This is for educational purposes only, not any recommendations to buy or sell. As I am not SEBI registered, please consult your financial advisor before taking any action.

