Market Outlook & Trade Setup – Friday, 6th Feb 2026
Today is RBI'S policy announcement wherein we are expecting no change in the repo rate.
🔹 NIFTY: Gift Nifty (25,626: -22)
* Previous Close: 25,642
* Expected Range: 25,500 - 25,700
🔹 SENSEX
* Previous Close: 83,313
* Expected Range: 83,300 - 83,400
🌍 Global & Market Sentiment
* DJIA: -592| S&P: -84
💰 Institutional Activity (Cash Market)
* FII: Net Buyers: - ₹ 2151 Cr
* DII: Net Buyers: + ₹ 1130 Cr
🔥 Events this Week:
India - RBI Interest Rate Decision
📌 Sectoral Focus (Positive)
Bank, NBFC, Auto, Realty
👉 Commodities in Focus: Copper, Gold, Silver, Crude
✌️Important Quarterly Results: Bosch, CESC, Crompton, SUNTV, Whirlpool
📈 Trade smart. Manage risk. Stay disciplined.
Marketoutlook

Market Outlook & Trade Setup – Thursday, 5th Feb 2026Major indices has been in a complete range with not much activity. The latest shocker was for the IT stocks, where the IT Index corrected by 6% yesterday due to the fear of AI eating into their primary revenue sources.
Today is SENSEX weekly expiry and currently it's quoting near it's 100 MA of 83,681, much movement will not be expected as of now unless there is another big trend in anyone of the sectors like IT or Banks, or any of the major stocks.
🔹 NIFTY: Gift Nifty (25,803)
* Previous Close: 25,776
* Expected Range: 25,500 - 26,000
🔹 SENSEX
* Previous Close: 83,817
* Expected Range: 83,000 - 84,000
🌍 Global & Market Sentiment
* DJIA: +260 | S&P: -35
💰 Institutional Activity (Cash Market)
* FII: Net Buyers: ₹ 30 Cr
* DII: Net Buyers: ₹ 250 Cr
🔥 Events this Week:
India - S&P Global Manufacturing PMI (Jan)
📌 Sectoral Focus (Positive)
IT, Power
👉 Commodities in Focus: Copper, Gold, Silver, Crude
✌️Important Quarterly Results: Bharti Airtel, JK Paper, JM Financial, LICI, RVNL, South Bank, Hero Moto
📈 Trade smart. Manage risk. Stay disciplined.

Market Outlook & Trade Setup – Wednesday, 4th Feb 2026Nifty opened at a major gap up yesterday of 1200 points following the midnight announcement of the India US trade deal being secured leading to a huge upsurge in sectors across the board. However the momentum got lost in the initial 15 mins of the market opeing following which the index moved in a range throughout the day.
Gold & Silver futures in MCX bounced back to gain more than 6% and 15% yesterday.
🔹 NIFTY: Gift Nifty (25,769)
* Previous Close: 25,727
* Expected Range: 25,500 - 26,000
🔹 SENSEX
* Previous Close: 83,739
* Expected Range: 83,000 - 84,000
🌍 Global & Market Sentiment
* DJIA: -167 | S&P: - 58
💰 Institutional Activity (Cash Market)
* FII: Net Buyers: ₹ 5236 Cr
* DII: Net Buyers: ₹ 1014 Cr
🔥 Events this Week:
India - S&P Global Manufacturing PMI (Jan)
📌 Sectoral Focus (Positive)
Banks, Energy, Auto, Real Estate
👉 Commodities in Focus: Gold, Silver
✌️Important Quarterly Results: Bajaj Finserv, Century Ply, Tata Power
📈 Trade smart. Manage risk. Stay disciplined.

XAUUSD (GOLD) | BREAKOUT VS BREAKDOWN LEVEL | 29th Jan'2026XAU/USD (Gold) Outlook | 29 Jan 2026
Gold (XAU/USD) is trading near 5513, maintaining a strong bullish structure across daily, weekly, and monthly timeframes. Price is holding well above key moving averages, indicating sustained buying momentum. As long as gold stays above the 5515–5495 support zone, the upside bias remains intact with potential continuation toward 5555–5590. A decisive break below 5495 may trigger short-term corrective pressure, but the broader trend remains positive.
Breakout & Breakdown Levels
Bullish Breakout: Above 5555 | Bearish Breakdown: Below 5495
Disclaimer: This content is for educational purposes only and not financial advice. Trading involves risk; manage your position size wisely.

Nifty spot 25683.30 by Daily Chart view - Weekly UpdateNifty spot 25683.30 by Daily Chart view - Weekly Update
- Support Zone 25425 to 25725 for Nifty Index
- Resistance Zone 26000 to 26200 >>> ATH 26373.20 for Nifty Index
- Deep rooted Fear plus Geo-Political events dampening Domestic Markets

XAUUSD (Gold) TECHNICAL OUTLOOK | 6th Jan'2026Gold is trading near 4,450, consolidating after a strong bullish rally. Price remains well above key moving averages, keeping the overall trend firmly bullish across intraday to higher timeframes.
Bullish View:
As long as gold holds above 4,445–4,450, upside momentum remains intact. A move above 4,470 can push prices toward 4,490 and 4,505–4,515, with 4,550 as a major resistance zone.
Bearish View:
A break below 4,445 may trigger a short-term pullback toward 4,430 and 4,410–4,395. Unless these levels break decisively, dips are likely corrective.
Intraday Focus:
Prefer buy-on-dips near support, while watching 4,500–4,515 for possible rejection.
Conclusion:
Trend remains strongly bullish. Expect volatility, but bias favors buyers unless key supports fail.

XAUUSD (Gold) Technical Outlook - 24/12/2025XAUUSD – Gold Technical Snapshot (Intraday)
Gold remains bullish across higher timeframes (Daily–Monthly). Price is trading near 4,492, close to the day’s high, with all major moving averages aligned upward. Momentum indicators support the uptrend, though overbought conditions suggest possible short-term pullbacks.
Key_Levels
Support: 4,480 / 4,465
Pivot: 4,495
Resistance: 4,520 → 4,550 → 4,575
Outlook & Strategy
Bias stays bullish above 4,480
Buy pullbacks near support or breakouts above 4,520
Below 4,465, expect a corrective move toward 4,440–4,410
Disclaimer: This analysis is for educational purposes only and not financial advice. Trading involves risk—always manage your risk and do your own research.

BTC Technical Outlook – Cycle High WatchBitcoin is potentially entering the final push of the current cycle, with price action forming a Head & Shoulders (H&S) structure near the newly formed ATH. While this pattern is not confirmed yet, it does raise caution for a possible local top.
📈 Upside Scenario:
Our immediate focus remains on the $111,000 zone, which aligns with a potential liquidity grab area. A push into this region followed by strong rejection would strengthen the bearish case.
📉 Risk Zone to Monitor:
If rejection occurs near $111K, attention will shift to the neckline area, which will be crucial in confirming the H&S breakdown.
⚠️ Key Takeaway:
Bullish continuation remains valid until rejection is confirmed
$111K = key upside target & decision zone
Neckline break would confirm trend exhaustion
_Wait for confirmation. Trade the reaction, not the prediction._

EUR/USD – Trap or Trend Continuation?EUR/USD – Trap or Trend Continuation?
The market has recently transitioned from a strong directional advance into a phase of hesitation and balance. After a sustained upward expansion marked by clear momentum and orderly price progression, buying pressure has begun to slow. This slowdown is evident through reduced follow-through, shorter price extensions, and increased overlap between successive price movements.
Current price action reflects a state of consolidation rather than continuation. The market is no longer accelerating higher, but it is also not showing aggressive selling. This suggests that participants who benefited from the prior move are reassessing exposure, while new buyers are less willing to commit at current levels. As a result, price is fluctuating within a relatively narrow range, indicating temporary equilibrium between demand and supply.
Attempts to push higher have been met with limited acceptance, hinting at exhaustion in the recent upward move. Momentum appears to be waning, and price behavior shows signs of distribution, where activity becomes choppy and directional conviction weakens. This phase often precedes either a corrective move or a renewed expansion, depending on which side regains control.
If downside pressure increases, price is likely to seek lower valuation areas where participation previously increased. Such a move would be considered a corrective adjustment within the broader context of the prior advance rather than an outright reversal, unless selling becomes impulsive and sustained. Conversely, if buyers regain confidence and price is accepted above the recent consolidation zone, the market could resume its prior expansion with renewed strength.
Overall, the market is at an inflection point. The dominant move that brought price to current levels has lost momentum, and the next meaningful direction will depend on whether balance resolves in favor of continuation or correction. Patience is warranted until price demonstrates clear acceptance in one direction, as trading during this phase carries elevated risk of false moves.

"Gold in Firm Bullish Control""Gold in Firm Bullish Control"
Gold is currently trading in a constructive upward environment, where price behavior reflects sustained participation from institutional buyers rather than speculative spikes. Recent movements show that upside progress has been built through measured advances followed by controlled pauses, a pattern that typically appears when the market is preparing for continuation rather than exhaustion.
Market activity suggests that buy-side interest remains dominant, with pullbacks being absorbed efficiently and failing to generate follow-through selling. This indicates that bearish pressure lacks commitment, while bullish participation remains organized and patient. The absence of aggressive downside momentum during pauses reinforces confidence in the prevailing direction.
Volatility has compressed after an expansion phase, which often precedes another directional move. This compression reflects balance at higher price levels, a sign that the market is accepting value above prior ranges. Such acceptance generally supports further upside attempts once activity re-expands.
From a flow perspective, price reactions imply that liquidity has already been tested and cleared, reducing immediate downside vulnerability. The market now appears positioned for continuation rather than correction, with sentiment favoring gradual appreciation rather than sharp reversals.
Overall Assessment:
Gold remains in a positive continuation phase, where conditions favor further upward progress as long as market behavior continues to show acceptance at elevated levels and pullbacks remain corrective in nature

The Modern Market Explosion: Dynamics, Drivers, and Implications1. Technological Revolution as a Catalyst
At the heart of the modern market explosion lies the technological revolution. Advancements in computing power, cloud technologies, artificial intelligence (AI), blockchain, and high-frequency trading have reshaped how markets operate. Trading that once took hours or days can now occur in milliseconds, allowing for near-instantaneous execution of orders. Automated trading algorithms can respond to micro-movements in the market, amplifying both liquidity and volatility.
The rise of fintech platforms has democratized access to markets, allowing retail investors to participate in arenas that were once dominated by institutional players. Mobile trading apps, digital wallets, and online brokerage platforms have exponentially increased the volume of participants in stock, cryptocurrency, and derivatives markets. This surge in participation has not only inflated trading volumes but has also created price swings driven by social sentiment, speculation, and viral trends—phenomena particularly visible in meme stocks and digital asset markets.
2. Globalization and Interconnected Markets
Globalization has intensified market interdependence. Modern markets are no longer isolated; a major economic event in one country reverberates across the world in real-time. Supply chain disruptions in East Asia, geopolitical conflicts in Europe, or policy shifts in the United States can instantaneously affect stock indices, commodity prices, and currency valuations across multiple continents.
Emerging markets have become key drivers of this explosive growth. Economies in Asia, Africa, and Latin America, leveraging technology and international trade, are attracting massive foreign investments. Capital flows across borders are faster and larger than ever, contributing to dynamic asset reallocation and, occasionally, market bubbles. Globalization has also intensified competition, forcing companies to innovate rapidly and adopt digital solutions to remain relevant, further energizing sectors like technology, e-commerce, and renewable energy.
3. Investor Psychology and Behavioral Shifts
The modern market explosion is heavily influenced by investor psychology. Behavioral finance has highlighted that markets are not purely rational; human emotions, herd behavior, and cognitive biases play critical roles. Social media platforms, online forums, and news aggregators amplify information and, in some cases, misinformation. Platforms like Reddit, Twitter, and Telegram have empowered collective action among retail investors, creating sudden surges in trading activity and price volatility.
This phenomenon has been vividly observed in meme stocks, cryptocurrencies, and trending tech shares. Fear of missing out (FOMO), speculative mania, and rapid shifts in sentiment contribute to market explosions, often decoupling asset prices from traditional valuation metrics. The combination of retail-driven momentum and institutional responses forms a feedback loop that accelerates price movements, creating both opportunities and risks.
4. Monetary Policies and Liquidity Surges
Central banks worldwide have played a significant role in the explosive growth of modern markets. In response to financial crises, pandemics, and recessions, central banks have implemented unprecedented monetary interventions, including near-zero interest rates, quantitative easing, and direct market support. These policies have flooded global markets with liquidity, encouraging borrowing, investment, and risk-taking.
High liquidity environments often push investors toward higher-yielding assets such as equities, real estate, and alternative investments, inflating prices. This influx of capital has amplified market bubbles, accelerated technological sector valuations, and supported the rapid rise of digital assets. However, this liquidity-driven expansion is fragile, sensitive to interest rate adjustments, inflationary pressures, and geopolitical uncertainties, making modern markets highly reactive to policy signals.
5. Sectoral Shifts and Innovation Drivers
Certain sectors have emerged as key drivers of the modern market explosion. Technology, artificial intelligence, biotechnology, renewable energy, and electric vehicles are attracting enormous capital inflows due to their disruptive potential. Startups in these sectors are achieving valuations in record times, often reaching “unicorn” status within a few years of founding.
Digital transformation across traditional industries—finance, healthcare, logistics, and manufacturing—has also created new market opportunities. Cloud computing, data analytics, Internet of Things (IoT), and AI-driven automation have increased productivity and generated investor optimism. These sectors often experience rapid price appreciation as innovation expectations sometimes outpace earnings, further contributing to market acceleration and speculative excitement.
6. Cryptocurrency and Decentralized Finance (DeFi)
Cryptocurrencies and decentralized finance platforms have added a new dimension to the modern market explosion. Blockchain technology enables digital assets to exist outside traditional banking systems, creating entirely new marketplaces for investment and exchange. Bitcoin, Ethereum, and other cryptocurrencies have experienced explosive growth, driven by both institutional adoption and retail enthusiasm.
DeFi platforms allow peer-to-peer lending, borrowing, and trading without intermediaries, challenging traditional financial systems. These innovations have increased market accessibility, liquidity, and speculative potential, creating a high-risk, high-reward environment. Cryptocurrencies also respond to global macroeconomic trends, regulatory developments, and social media-driven hype, contributing to sudden market surges and declines.
7. Risks, Volatility, and Market Sustainability
While the modern market explosion presents enormous opportunities, it is accompanied by heightened risks. Volatility has intensified, with sudden price swings becoming commonplace. The interconnected nature of global markets means that crises can propagate rapidly, as seen during events like the 2008 financial crisis and the COVID-19 pandemic.
Overvaluation of certain sectors, speculative bubbles, geopolitical tensions, cyber threats, and policy missteps are persistent risks. Investors must balance the allure of rapid gains with disciplined risk management. Market regulation, transparency, and investor education remain critical to sustaining long-term growth while mitigating systemic risks.
8. Implications for Businesses, Investors, and Society
The explosion of modern markets has broad implications beyond finance. Businesses face pressure to innovate, scale quickly, and adopt digital solutions. Investors encounter both unprecedented opportunities and challenges in portfolio diversification, risk management, and information analysis. Society, in turn, experiences economic benefits through job creation, technological advancement, and increased access to capital, but also faces risks related to inequality, market speculation, and financial instability.
Financial literacy and technological understanding have become essential for navigating the modern market. Stakeholders who leverage data analytics, AI tools, and global market intelligence gain a strategic advantage, while those who fail to adapt risk being left behind.
9. Conclusion
The modern market explosion is a multifaceted phenomenon driven by technology, globalization, investor behavior, policy interventions, and sectoral innovation. It is characterized by rapid growth, high liquidity, speculative surges, and heightened volatility. While it offers remarkable opportunities for wealth creation, entrepreneurship, and global economic integration, it also demands sophisticated risk management, regulatory oversight, and informed participation.
Understanding the interplay between technology, capital flows, investor psychology, and policy dynamics is crucial for anyone seeking to navigate these markets successfully. The modern market is not merely expanding; it is accelerating, transforming, and redefining the global economic landscape at an unprecedented pace. Investors, businesses, and policymakers must embrace agility, knowledge, and strategic foresight to harness its potential while mitigating its inherent risks.
Euro Under Pressure from Strong USDThe euro continues to show weakness against the dollar as global risk sentiment cools and investors shift toward safer assets. Market participants remain cautious ahead of key inflation data from the Eurozone and upcoming comments from Federal Reserve officials, which could clarify the next phase of U.S. monetary policy.
The recent euro recovery attempts have met consistent supply, reflecting pressure from subdued European growth and stronger U.S. economic resilience. The dollar remains supported by robust labor market conditions and persistent inflation expectations, which sustain demand for U.S. yields and Treasury assets.
Liquidity patterns suggest that institutions are still offloading positions near recent highs, keeping EUR/USD confined within a broader corrective cycle. Energy price fluctuations and diverging rate expectations between the ECB and the Fed continue to weigh on sentiment.
Overall, the pair remains under macroeconomic strain, with capital flows favoring the dollar as global markets seek stability am

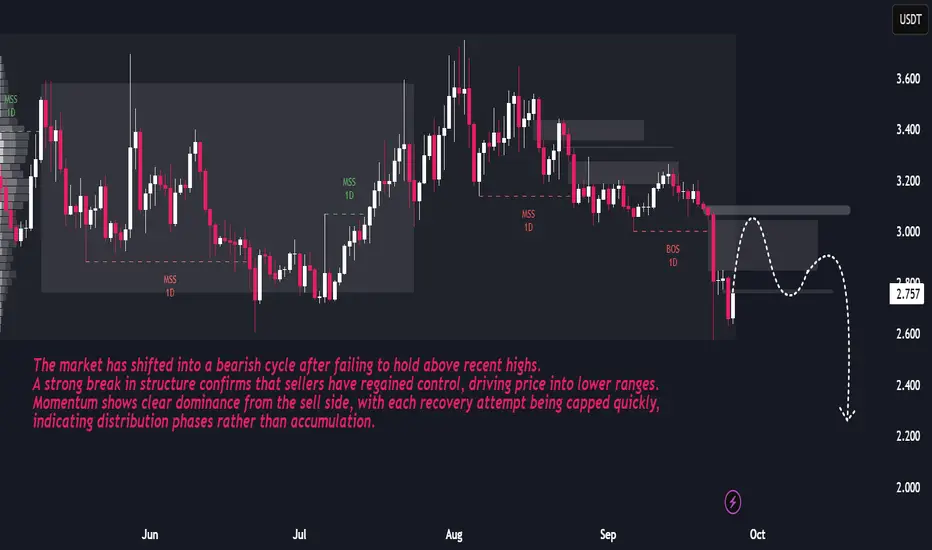
Toncoin Market Report: Bearish Pressure vs Potential ReboundThe market has entered a clear distribution phase after repeated failures to sustain higher levels. Recent structure shifts on the daily timeframe highlight strong bearish control, with downside momentum accelerating as buyers continue to lose strength. The sharp breakdown signals that liquidity has shifted toward lower zones, creating pressure for further declines.
While short-term rebounds may emerge, these are more likely to serve as corrective pullbacks rather than true trend reversals. The overall flow indicates that sellers remain in command, and price is expected to gradually seek lower value areas as part of an extended bearish cycle
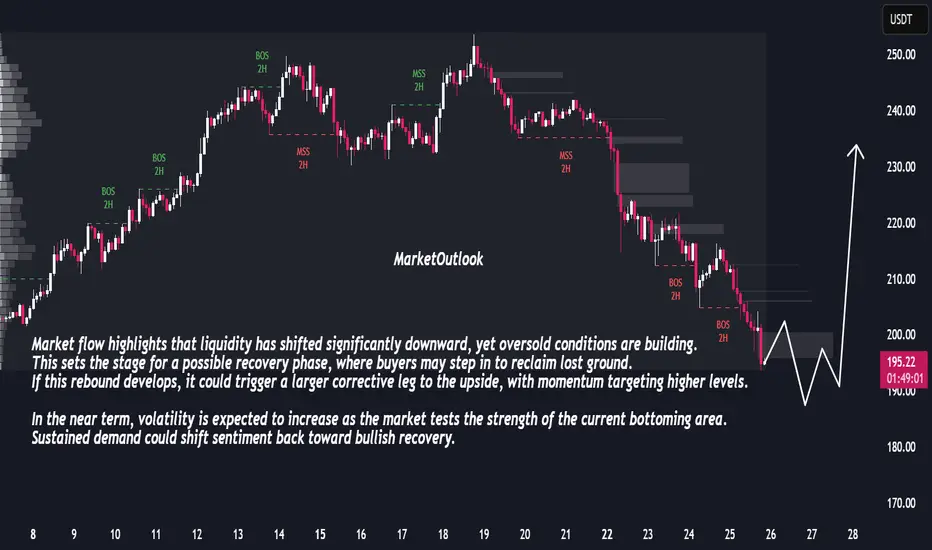
Bullish Reversal Ahead: Market Prepares for Sharp RecoveryThe market has been under consistent selling pressure, with a clear sequence of bearish breaks in structure confirming downside control. Price has now entered a zone where momentum shows signs of slowing, suggesting potential exhaustion in the recent decline. The sharp extension lower indicates that sellers may be reaching a short-term limit, creating conditions for a corrective rebound.
Market flow highlights that liquidity has shifted significantly downward, yet oversold conditions are building. This sets the stage for a possible recovery phase, where buyers may step in to reclaim lost ground. If this rebound develops, it could trigger a larger corrective leg to the upside, with momentum targeting higher levels.
In the near term, volatility is expected to increase as the market tests the strength of the current bottoming area. Sustained demand could shift sentiment back toward bullish recovery.
Nifty50 - Set to March towards 30KNifty is showing strong bullish momentum backed by multiple signals
Trendline Breakout from consolidation
Cup & Handle Formation indicating continuation
Three White Soldiers Candles
Reversal from Crucial Support near 24,300
Multi-Timeframe Alignment (Daily, 4H, Weekly)
Entry: 25,670
With strong confluence of bullish signals, Nifty50 looks set to march towards the 30K in Next 5-6 Months

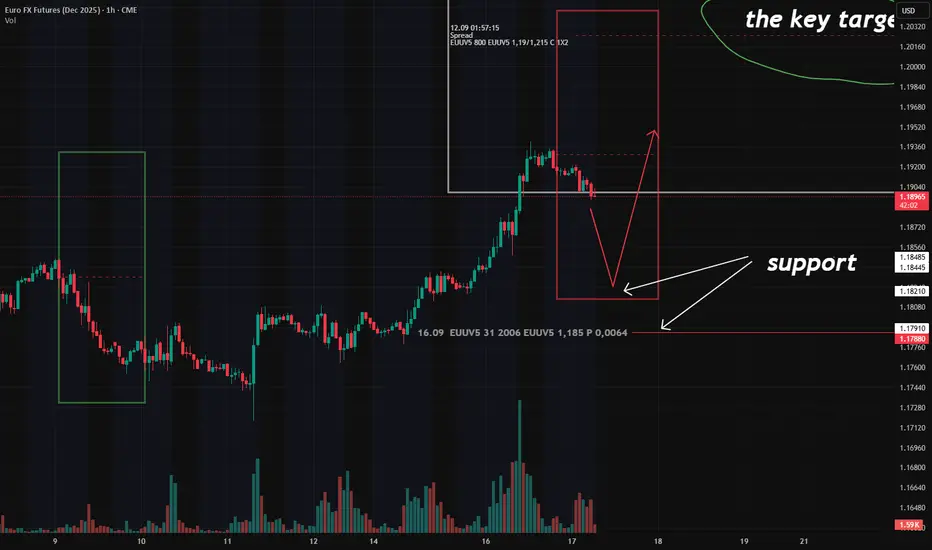
Market Sentiment: Optimism for Euro – But Here’s My Plan According to last CME report, there’s clear bullish sentiment across major currencies trading against the US dollar.
We’re seeing naked calls placed at multiple levels above current prices:
1.38 on GBP
1.295 on CHF
In other words: options traders are pricing in further USD weakness.
This aligns with earlier signals:
1.The JPY 'Butterfly' (still active)
2. The EUR 'Ratio spread' — also still in play
So what’s my move today?
✅ First: I exited all positions this morning.
No overexposure ahead of the Fed decision.
🎯 Now: I’m watching for long entries near the ER zone (see chart).
Notably, just below ER low boundary - put at 1.185 (act as support), which appeared in the report.
The option is worth ~$900K — not huge, but significant enough to catch my eye.
I’ll watch closely — and only enter if price respects it.
Caution ahead of US PPI report | Priority on Sell setups🟡 XAU/USD – 10/09 | Captain Vincent ⚓
🔎 Captain’s Log – Market Context
US 10-year bond yields rebound, signaling the market is awaiting key inflation data.
At 07:30, US PPI report will be released – a crucial figure that could strongly influence FED rate expectations.
Investors are also eyeing US CPI in the coming days to assess the inflation outlook.
The US Supreme Court accepted Trump’s appeal, but this news has not yet had a notable impact on Gold.
⏩ Captain’s Summary: Ahead of inflation data, Gold often tends to correct lower due to cautious sentiment.
📈 Captain’s Chart – Technical Analysis
Storm Breaker (Key Resistance):
Bearish OB: 3654 – 3660 (short-term upper cap)
ATH Watchtower: 3700 – 3702 (Sell Zone – possible new ATH test)
Golden Harbor (Strong Support):
Buy Zone: 3601 – 3602
OB Dock: 3582 – 3585
Currently, price is around 3640 – 3645, after a technical rebound from support. High probability that Gold will retest nearby resistance before a downward correction.
🎯 Captain’s Map – Trade Scenarios
⚡ Quick Boarding (SELL – Daily Priority)
Entry 1: 3654 – 3660
SL: 3668
TP: 3654 → 3650 → 3618 → 3610
Entry 2 – ATH Test: 3701 – 3703
SL: 3711
TP: 3688 → 3675 → 3665 → 365x
✅ Golden Harbor (BUY – Only at deep support)
Buy Zone: 3601 – 3603
SL: 3592
TP: 3610 → 3620 → 3630
⚓ Captain’s Note
“The golden ship faces turbulent seas today as it sails near Storm Breaker 🌊 (3654 – 3660) . Before the fierce winds called US PPI , sailors should prioritize dropping anchor with short-term SELL positions at resistance. Golden Harbor 🏝️ (3601 – 3603) remains a safe haven below, but only when the ship corrects deeply should it dock. On this voyage, Quick Boarding 🚤 is for scalp maneuvers, while the main current is still steered by the stormy waves of inflation.”

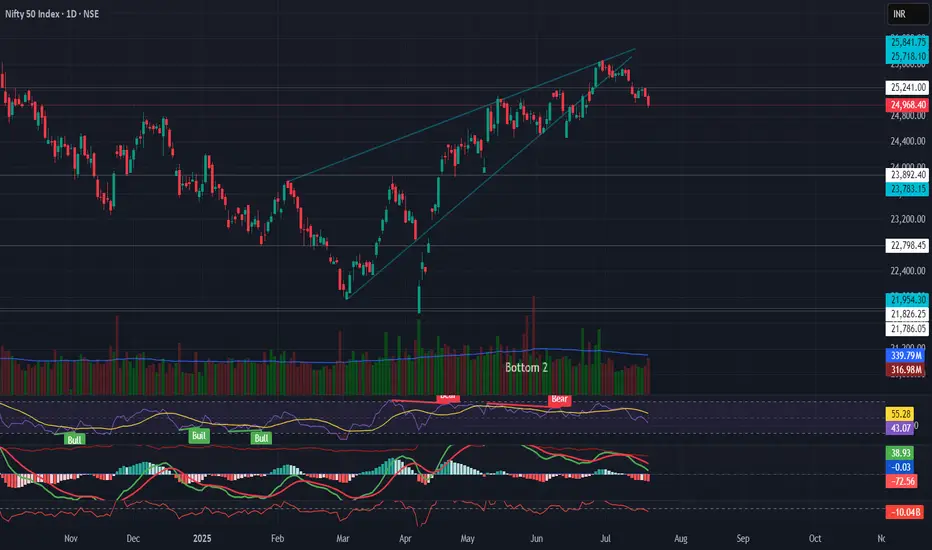
NIFTY Technical Breakdown – Rising Wedge Pattern🔻 NIFTY Technical Breakdown – Rising Wedge Pattern
The Nifty 50 has broken down from a rising wedge pattern on the daily timeframe, a bearish reversal formation that often signals distribution at the top.
📉 Key Observations:
Rising wedge breakdown after extended rally
RSI bearish divergence confirming weakness
MACD crossover turning negative
Volume gradually decreasing during the rise, indicating exhaustion
ADX flattening, showing weakening trend strength
📌 Support Levels to Watch:
23,783 – Key swing support
22,798 – Previous breakout zone
📌 Sectoral Rotation:
Defensive sectors like Pharma & FMCG are gaining strength
FII selling pressure, rising DXY, and global uncertainty continue to weigh on sentiment
⚠️ Outlook:
Caution warranted in the short term. Watch for sustained close below 24,900 for further downside confirmation. Macro and global cues to play a key role ahead.
💬 What’s your view on Nifty's near-term direction?
#Nifty50 #TechnicalAnalysis #RisingWedge #MarketOutlook #TradingView #ChartStudy #IndiaMarkets #BearishSetup #NiftyBreakdown #Puneet0130
The Great S&P 500The S&P 500 is sitting comfortably on its scripted support, just waiting to see if it holds or breaks. Let’s hope our current American businessmen don’t make any decisions that might actually improve things! Wouldn't want him accidentally turning the world into a better place.

Nifty still going Down? Application of Elliott waves and FiboNSE:NIFTY has corrected by 3500 pts (13.3%) from its high of 26,277 in Sep’24.
In post COVID era this is the 2nd biggest correction in terms of % and biggest in points.
Let us use Elliot wave theory and the Fibonacci retracement tool
Wave Time Start to End Points (percentage from top)
Wave (X) ( (i) to (ii) ) Oct-21 to Jun-22 18,604 to 15,183 3,421 pts (18.4%)
Wave Y ( iii to iv ) Sep-24 to Feb-25 26,277 to 22,986 3,290 pts (13.28%)
Wave Z ( I to ii ) Dec-22 to Mar-23 18,887 to 16,828 2,059 pts (10.79%)
Wave (X) ≈ Wave Y || 3421 ≈ 3290 (Δ4%)
Wave Y ≈ 168% * Wave Z || 3290 ≈ 161.8%*2059 (i.e. 3331) (Δ1%)
*In stock market waves will hardly be exactly equal, 5% of deviation is acceptable to me.
While Wave Y & Z are of same degree, wave (X) is of higher than these two.

"Bank Nifty: Weakening Support at 53,352–53,400 - Bears Gaining"On 9th December, Bank Nifty (BN) began with a bullish move, taking support at 53,352 and climbing approximately 350+ points by 11:15 AM. However, bears took control afterwards, pushing BN back to the same support zone around 53,352–53,400 levels.
Analysis: BN has tested the 53,352 to 53,400 support zone three times between 5th and 9th December. This marks the fourth time it is testing this level, and during the second half of the session, bears gained control. This behavior indicates that the support at these levels is weakening and may not hold strong, especially if there is a bearish push in the morning session. A close look at the 15-minute timeframe suggests that the support is likely to be breached if selling pressure intensifies.
Additionally, On-Balance Volume (OBV) is showing weaker volume support on the upside. Even though the price action on the chart appears slightly bullish, the OBV indicator highlights a divergence, with declining volume during upward moves (marked with a blue circle). This confirms that the bullish momentum lacks sufficient volume backing.
While it appears that BN may be vulnerable to a potential decline, the situation could change with a gap-up or gap-down opening, which could shift the market sentiment.
Support Levels: 52,950, 52,670
Resistance Levels: 53,700, 53,900, 54,200

NIFTY : the wild guesscmp :24000
my predictions for market for next few quaters.
its a meme/joke kinda wild guess or gut feeling i m having based on my exp and no there is no logical explanation for this madness i drew .
i hope u take it with no seriousness(unless it happens perfectly then u need to call me rainmaker ).
stay away from banks, they are fragile and smallcap
keep money for black swan event and when in doubt stay out .
better to hold money than lose it.
cya people in 4 months.

Time to be Cautious in Nifty50 ?Nifty Ends Above 22,000 today, For First Time.
Time to be cautious?
The setup for 2023 was very powerful as its previous calendar year witnessed only 10 new 52-week highs, while for 2024, its previous calendar year saw a staggering 29 new 52-week highs. Today markets opened at new lifetime highs marking the second new lifetime high in just 15 days of calendar year 2024. Reliance alone is the biggest contributor in last 1000 point Nifty gain.
Furthermore, IT sector has led the Nifty rally and has spiked significantly in the last three trading sessions because of results backed by cheaper valuations.
The markets are clearly in bull's favor but the recent upswing warrants a certain degree of caution as, many times, such sharp rallies do not sustain. There is high probability that there will be profit booking in areas of ebullience, specially in small-cap & mid-cap space.
Though the larger texture of the market is still on the positive side & current leg of rally may extend up to 22,400 levels but due to temporary overbought conditions, upcoming interim budget & elections, markets may remain volatile & in profit booking mode.
We can see a selling market only after sustaining below 21750-21700 levels but right now THE TIME IS NOT TO SHORT BUT TO BE CAUTIOUS DEFINITELY.
