[INTRADAY] #BANKNIFTY PE & CE Levels(30/12/2025)A flat opening is expected in Bank Nifty, with the index trading near the 59,000 zone, which continues to act as a short-term balance area. Price action over the last few sessions shows sustained selling pressure from higher levels, followed by a mild pullback and sideways movement. This indicates that the market is still in a consolidation-to-weak structure, where buyers are attempting to defend lower supports while sellers remain active near resistance.
On the upside, the 59,050–59,100 zone is the immediate resistance and a crucial trigger for bullish momentum. If Bank Nifty manages to hold above this zone, buying opportunities in buying can be considered, with upside targets at 59,250, 59,350, and 59,450+. A sustained move above this resistance may lead to short covering and a recovery toward higher levels.
On the downside, failure to hold the 58,950–58,900 zone can invite renewed selling pressure. In such a scenario, selling positions may be considered with downside targets at 58,750, 58,650, and 58,550-, where stronger demand is expected to emerge. Until a clear breakout or breakdown occurs, traders should continue to trade range to range, avoid aggressive positions, and strictly follow risk management in this consolidation-driven setup.
Marketprofile

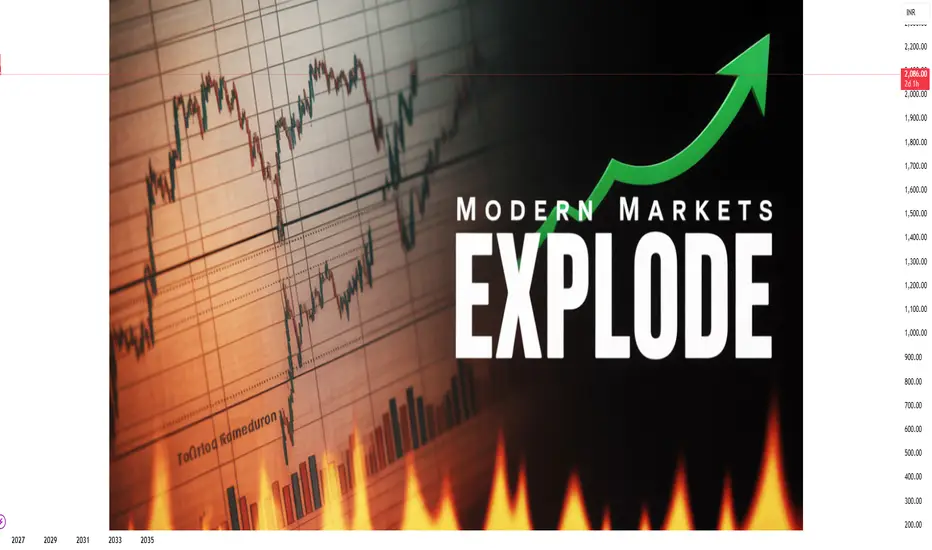
The Modern Market Explosion: Dynamics, Drivers, and Implications1. Technological Revolution as a Catalyst
At the heart of the modern market explosion lies the technological revolution. Advancements in computing power, cloud technologies, artificial intelligence (AI), blockchain, and high-frequency trading have reshaped how markets operate. Trading that once took hours or days can now occur in milliseconds, allowing for near-instantaneous execution of orders. Automated trading algorithms can respond to micro-movements in the market, amplifying both liquidity and volatility.
The rise of fintech platforms has democratized access to markets, allowing retail investors to participate in arenas that were once dominated by institutional players. Mobile trading apps, digital wallets, and online brokerage platforms have exponentially increased the volume of participants in stock, cryptocurrency, and derivatives markets. This surge in participation has not only inflated trading volumes but has also created price swings driven by social sentiment, speculation, and viral trends—phenomena particularly visible in meme stocks and digital asset markets.
2. Globalization and Interconnected Markets
Globalization has intensified market interdependence. Modern markets are no longer isolated; a major economic event in one country reverberates across the world in real-time. Supply chain disruptions in East Asia, geopolitical conflicts in Europe, or policy shifts in the United States can instantaneously affect stock indices, commodity prices, and currency valuations across multiple continents.
Emerging markets have become key drivers of this explosive growth. Economies in Asia, Africa, and Latin America, leveraging technology and international trade, are attracting massive foreign investments. Capital flows across borders are faster and larger than ever, contributing to dynamic asset reallocation and, occasionally, market bubbles. Globalization has also intensified competition, forcing companies to innovate rapidly and adopt digital solutions to remain relevant, further energizing sectors like technology, e-commerce, and renewable energy.
3. Investor Psychology and Behavioral Shifts
The modern market explosion is heavily influenced by investor psychology. Behavioral finance has highlighted that markets are not purely rational; human emotions, herd behavior, and cognitive biases play critical roles. Social media platforms, online forums, and news aggregators amplify information and, in some cases, misinformation. Platforms like Reddit, Twitter, and Telegram have empowered collective action among retail investors, creating sudden surges in trading activity and price volatility.
This phenomenon has been vividly observed in meme stocks, cryptocurrencies, and trending tech shares. Fear of missing out (FOMO), speculative mania, and rapid shifts in sentiment contribute to market explosions, often decoupling asset prices from traditional valuation metrics. The combination of retail-driven momentum and institutional responses forms a feedback loop that accelerates price movements, creating both opportunities and risks.
4. Monetary Policies and Liquidity Surges
Central banks worldwide have played a significant role in the explosive growth of modern markets. In response to financial crises, pandemics, and recessions, central banks have implemented unprecedented monetary interventions, including near-zero interest rates, quantitative easing, and direct market support. These policies have flooded global markets with liquidity, encouraging borrowing, investment, and risk-taking.
High liquidity environments often push investors toward higher-yielding assets such as equities, real estate, and alternative investments, inflating prices. This influx of capital has amplified market bubbles, accelerated technological sector valuations, and supported the rapid rise of digital assets. However, this liquidity-driven expansion is fragile, sensitive to interest rate adjustments, inflationary pressures, and geopolitical uncertainties, making modern markets highly reactive to policy signals.
5. Sectoral Shifts and Innovation Drivers
Certain sectors have emerged as key drivers of the modern market explosion. Technology, artificial intelligence, biotechnology, renewable energy, and electric vehicles are attracting enormous capital inflows due to their disruptive potential. Startups in these sectors are achieving valuations in record times, often reaching “unicorn” status within a few years of founding.
Digital transformation across traditional industries—finance, healthcare, logistics, and manufacturing—has also created new market opportunities. Cloud computing, data analytics, Internet of Things (IoT), and AI-driven automation have increased productivity and generated investor optimism. These sectors often experience rapid price appreciation as innovation expectations sometimes outpace earnings, further contributing to market acceleration and speculative excitement.
6. Cryptocurrency and Decentralized Finance (DeFi)
Cryptocurrencies and decentralized finance platforms have added a new dimension to the modern market explosion. Blockchain technology enables digital assets to exist outside traditional banking systems, creating entirely new marketplaces for investment and exchange. Bitcoin, Ethereum, and other cryptocurrencies have experienced explosive growth, driven by both institutional adoption and retail enthusiasm.
DeFi platforms allow peer-to-peer lending, borrowing, and trading without intermediaries, challenging traditional financial systems. These innovations have increased market accessibility, liquidity, and speculative potential, creating a high-risk, high-reward environment. Cryptocurrencies also respond to global macroeconomic trends, regulatory developments, and social media-driven hype, contributing to sudden market surges and declines.
7. Risks, Volatility, and Market Sustainability
While the modern market explosion presents enormous opportunities, it is accompanied by heightened risks. Volatility has intensified, with sudden price swings becoming commonplace. The interconnected nature of global markets means that crises can propagate rapidly, as seen during events like the 2008 financial crisis and the COVID-19 pandemic.
Overvaluation of certain sectors, speculative bubbles, geopolitical tensions, cyber threats, and policy missteps are persistent risks. Investors must balance the allure of rapid gains with disciplined risk management. Market regulation, transparency, and investor education remain critical to sustaining long-term growth while mitigating systemic risks.
8. Implications for Businesses, Investors, and Society
The explosion of modern markets has broad implications beyond finance. Businesses face pressure to innovate, scale quickly, and adopt digital solutions. Investors encounter both unprecedented opportunities and challenges in portfolio diversification, risk management, and information analysis. Society, in turn, experiences economic benefits through job creation, technological advancement, and increased access to capital, but also faces risks related to inequality, market speculation, and financial instability.
Financial literacy and technological understanding have become essential for navigating the modern market. Stakeholders who leverage data analytics, AI tools, and global market intelligence gain a strategic advantage, while those who fail to adapt risk being left behind.
9. Conclusion
The modern market explosion is a multifaceted phenomenon driven by technology, globalization, investor behavior, policy interventions, and sectoral innovation. It is characterized by rapid growth, high liquidity, speculative surges, and heightened volatility. While it offers remarkable opportunities for wealth creation, entrepreneurship, and global economic integration, it also demands sophisticated risk management, regulatory oversight, and informed participation.
Understanding the interplay between technology, capital flows, investor psychology, and policy dynamics is crucial for anyone seeking to navigate these markets successfully. The modern market is not merely expanding; it is accelerating, transforming, and redefining the global economic landscape at an unprecedented pace. Investors, businesses, and policymakers must embrace agility, knowledge, and strategic foresight to harness its potential while mitigating its inherent risks.
#NIFTY Intraday Support and Resistance Levels - 21/11/2025Nifty is expected to open flat today, indicating a neutral start without any immediate directional push. A sustained move above the 26050–26100 zone will activate the long setup, aiming for upside targets of 26150, 26200, and 26250+.
If the index manages to break above the major resistance at 26250, the next bullish leg may extend toward 26350, 26400, and 26450+. On the downside, a reversal short opportunity will come only if Nifty rejects the 26250–26200 zone, where targets toward 26150, 26100, and 26050- become active.
Since the opening is flat, price action around these key levels will decide the trend for the day, and the market may remain range-bound initially until either side breaks decisively.

Introduction and Types of Financial Markets1. Introduction to Financial Markets
A financial market is a marketplace where buyers and sellers engage in trading financial assets such as stocks, bonds, currencies, and derivatives. These markets play a crucial role in the financial system by ensuring the allocation of resources, facilitating liquidity, and enabling price discovery.
1.1 Definition
Financial markets can be defined as structured systems through which financial instruments are issued, bought, sold, or exchanged. These instruments represent claims on real assets or future income and include equities, debt instruments, currencies, and derivatives.
Key definitions:
Investopedia: "A financial market is any marketplace where trading of securities occurs, including the stock market, bond market, forex market, and derivatives markets."
Mishkin and Eakins: "Financial markets are markets where funds are transferred from savers to borrowers."
1.2 Importance of Financial Markets
Financial markets serve as a backbone for economic growth. Some of their major functions include:
Capital Formation: Financial markets channel funds from savers to investors, facilitating business expansion and economic development.
Liquidity: Investors can quickly buy or sell financial instruments, ensuring access to cash when needed.
Price Discovery: Financial markets determine the price of assets based on supply and demand dynamics.
Risk Management: Markets offer instruments such as derivatives to hedge against price fluctuations.
Efficiency: Efficient markets ensure optimal allocation of resources, reducing the cost of capital for businesses.
Economic Indicator: The performance of financial markets often reflects the health of an economy.
2. Key Functions of Financial Markets
Financial markets are not just for trading—they perform several vital functions that sustain the economy:
Mobilization of Savings: They attract individual and institutional savings and channel them into productive investments.
Facilitating Transactions: They enable the smooth transfer of funds between buyers and sellers.
Reducing Transaction Costs: Standardized processes reduce the cost of trading and make markets efficient.
Providing Marketability: Investors can sell securities quickly in liquid markets without significant losses.
Credit Availability: Financial markets provide mechanisms for borrowing and lending funds for various purposes.
Investment Opportunities: They provide diverse options for investing based on risk-return preferences.
Regulation and Stability: Well-regulated financial markets ensure transparency, fairness, and stability.
3. Classification of Financial Markets
Financial markets can be classified based on different criteria, such as the type of instrument traded, maturity period, and mode of trading. Broadly, they are divided into money markets and capital markets.
3.1 Money Market
The money market deals with short-term debt instruments that typically mature within one year. It is essential for managing liquidity in the economy.
Characteristics:
Short-term instruments
Low risk and low returns
High liquidity
Participants include commercial banks, corporations, and governments
Major Instruments in Money Market:
Treasury Bills (T-Bills): Government-issued short-term securities with maturities ranging from 91 to 364 days.
Commercial Paper (CP): Unsecured, short-term promissory notes issued by corporations to meet working capital needs.
Certificates of Deposit (CDs): Time deposits offered by banks, tradable in secondary markets.
Repurchase Agreements (Repos): Short-term borrowing using securities as collateral.
Significance: Money markets allow governments, banks, and corporations to efficiently manage short-term funding requirements.
3.2 Capital Market
The capital market deals with long-term securities with maturities beyond one year. It is divided into the primary market and the secondary market.
3.2.1 Primary Market
The primary market is where new securities are issued for the first time. It is crucial for capital formation.
Initial Public Offering (IPO): Companies raise funds from the public by issuing shares.
Follow-on Public Offer (FPO): Additional shares are issued by a company after an IPO.
Private Placements: Securities are sold directly to a limited number of institutional investors.
Rights Issue: Existing shareholders are offered new shares proportionate to their holdings.
Significance: The primary market provides the initial funding for companies, helping them expand operations and invest in growth.
3.2.2 Secondary Market
The secondary market is where previously issued securities are traded between investors.
Stock Exchanges: Organized platforms like NYSE, NASDAQ, and NSE facilitate trading of equities.
Over-the-Counter (OTC) Market: Securities are traded directly between parties without a centralized exchange.
Significance: Secondary markets provide liquidity, enabling investors to buy or sell securities easily, while also helping in price discovery.
4. Types of Financial Markets Based on Instruments
Apart from the money and capital market distinction, financial markets can also be classified based on instruments:
4.1 Stock Market (Equity Market)
Deals in company shares.
Provides investors ownership in corporations.
Helps companies raise equity capital for growth.
Examples: NYSE, NASDAQ, BSE, NSE.
4.2 Bond Market (Debt Market)
Deals in bonds and debentures issued by governments and corporations.
Investors lend money and receive periodic interest.
Less risky than equities but offer fixed returns.
Examples: Government bond markets, corporate bond markets.
4.3 Foreign Exchange Market (Forex)
Involves the trading of currencies.
Ensures liquidity for international trade and investment.
Influenced by macroeconomic factors like inflation, interest rates, and geopolitical events.
Participants: Central banks, commercial banks, multinational corporations, and retail traders.
4.4 Derivatives Market
Deals in contracts whose value is derived from underlying assets like stocks, bonds, currencies, or commodities.
Includes futures, options, swaps, and forwards.
Used for hedging risk and speculation.
Significance: Derivatives help investors manage financial risk efficiently.
4.5 Commodity Market
Trades raw materials like gold, silver, oil, and agricultural products.
Includes spot markets (immediate delivery) and futures markets (delivery at a future date).
Provides a platform for price discovery and risk management.
4.6 Cryptocurrency Market
Emerging digital asset market trading cryptocurrencies like Bitcoin, Ethereum, and stablecoins.
Operates 24/7 globally, often outside traditional financial systems.
High risk but offers significant opportunities for diversification and speculative trading.
5. Classification Based on Trading Mechanism
Financial markets can also be divided based on how trading occurs:
Organized/Exchange-Traded Markets: Regulated platforms with standardized contracts, like stock exchanges.
Over-the-Counter (OTC) Markets: Decentralized trading between two parties, e.g., Forex OTC markets.
Electronic/Online Markets: Internet-based platforms facilitating global trading with high efficiency and low costs.
6. Participants in Financial Markets
Financial markets include a wide range of participants who perform specific functions:
Investors: Individuals and institutions seeking returns.
Issuers: Companies and governments raising funds.
Intermediaries: Banks, brokers, and investment firms facilitating transactions.
Regulators: Authorities like SEBI, SEC, and RBI ensuring transparency and protecting investors.
Speculators: Traders aiming to profit from price fluctuations.
Hedgers: Participants managing risk using derivatives or other financial instruments.
7. Modern Trends in Financial Markets
Globalization: Markets are increasingly interconnected, enabling cross-border capital flows.
Technological Advancements: High-frequency trading, blockchain, and AI-driven analytics are transforming trading.
Sustainable Finance: ESG and green bonds are gaining importance.
Cryptocurrencies & Digital Assets: Digital currencies are expanding market opportunities.
Fintech Innovations: Mobile trading platforms and robo-advisors are democratizing access to markets.
8. Conclusion
Financial markets are the lifeblood of modern economies, facilitating the flow of capital, promoting investment, and enabling risk management. From money markets dealing with short-term debt instruments to capital markets providing long-term funding, each segment has a distinct role in economic development.
The evolution of financial markets—from traditional equity and debt instruments to sophisticated derivatives and digital assets—highlights their adaptability and centrality to global financial stability. Understanding these markets is essential for investors, policymakers, and businesses seeking to navigate the complex financial landscape efficiently.
XAUUSD Alert| Liquidity Grab or Trend Reversal?”XAUUSD Alert 🚨 | Liquidity Grab or Trend Reversal?”
Gold has recently pushed into the 3525 – 3550 rejection zone, a level that has historically acted as strong supply. After this extended bullish rally, price is now showing early signs of exhaustion. This could be a liquidity grab above resistance before the market corrects lower.
My expectation here is a short-term pullback. The first key area I’ll be watching is around 3450, which lines up with a smaller demand zone and could act as a temporary support. If buyers fail to defend that level, then I expect continuation toward the 3330 – 3320 zone, which is my final target and also a major higher-timeframe support point.
This level is very important because it was previously a strong base for accumulation, and if tested again, it could provide a potential long opportunity. However, if price breaks below 3320 decisively, it would open the door for a much deeper correction.
Overall, my short-term outlook is bearish retracement, but I’ll be closely watching how price reacts once we reach the deeper support levels.

Reliance, HDFC Bank, PSU Banks Special Focus📌 Why These Stocks Are in the Spotlight
The Indian stock market in 2025 has been witnessing a powerful bull run, and three segments are consistently making headlines:
Reliance Industries – Due to digital, energy, and demerger buzz
HDFC Bank – Despite recent underperformance, it's at a crucial turning point
PSU Banks – The comeback kings, leading the financial sector with strong balance sheets and credit growth
These aren't just stocks—they are pillars of the Indian economy and barometers for sentiment, both for domestic and foreign investors. Let’s dive into each of them in depth.
🛢️ 1. Reliance Industries – The Giant with Multiple Growth Engines
📈 Market Cap & Relevance
Reliance is India’s largest company by market cap. It’s not just a conglomerate—it’s a full-blown economic ecosystem spanning:
Oil & Petrochemicals
Telecom (Jio)
Retail
Digital services (Jio Platforms)
Green Energy
⚙️ Key Drivers in 2025:
🔹 1. Jio Financial Demerger (JFS)
Post-demerger, Reliance has unlocked significant shareholder value.
JFS is slowly becoming a digital finance powerhouse with lending, insurance, and asset management plans.
Investors see JFS as a potential fintech disruptor.
🔹 2. Green Energy & Hydrogen
Ambani’s ₹75,000 crore green push is gaining traction.
New announcements around solar panel manufacturing, battery storage, and hydrogen fuel cells are bullish triggers.
India’s energy transition policies support this narrative.
🔹 3. Retail & E-commerce Expansion
Reliance Retail is aggressively expanding into Tier 2/3 towns.
Synergies with WhatsApp and JioMart are boosting the omni-channel model.
IPO expectations for Retail arm in 2025–2026.
🔹 4. Petrochemicals Recovery
With global crude stabilizing and demand picking up, O2C margins are improving.
This helps Reliance's traditional cash cow business.
💡 Technical View:
Stock recently gave a breakout above ₹3,000.
Strong institutional buying seen.
Analysts setting targets between ₹3,200–3,500 in short-medium term.
🧠 Trader Takeaway:
Ideal for long-term portfolio and sector rotation strategy.
Short-term trades possible on earnings announcements, subsidiary IPO news, or divestments.
🏦 2. HDFC Bank – Sleeping Giant at Turning Point
📉 What Happened?
HDFC Bank, post-merger with HDFC Ltd, became India’s largest private bank by balance sheet size. But ironically, the stock underperformed for much of 2023–2024.
🧾 Reasons for Underperformance:
Confusion and uncertainty post-merger
Weak deposit growth vs. credit growth
Net Interest Margins (NIMs) under pressure
Weak earnings in multiple quarters
But 2025 tells a different story.
📈 Fresh Catalysts for Re-rating:
🔹 1. Integration Settling
The merger is now largely complete from an operational standpoint.
Synergies in housing finance and cross-sell are beginning to show.
🔹 2. Deposit Base Stabilizing
Aggressive branch expansion and new digital products have improved CASA ratio.
Focus is on rural/semi-urban penetration.
🔹 3. Tech & AI Focus
New investment in digital infrastructure, robo-advisory, and AI-based lending systems.
Competing directly with fintechs rather than fearing them.
🔹 4. Valuation Comfort
Price-to-book (P/B) of ~2.1x vs historic avg of 3.2x
Institutions are seeing value accumulation zone
💡 Technical View:
After bottoming around ₹1,350–1,400, strong bounce seen.
Next key resistances: ₹1,700 and ₹1,800.
Many traders are positioning for mean reversion plays.
🧠 Trader Takeaway:
Best suited for positional trades or long-term SIP-style entries
Watch for upcoming quarterly earnings as turning point confirmation
🏛️ 3. PSU Banks – From Forgotten to Frontline
🧭 What’s Driving the PSU Bank Rally?
After years of being ignored due to NPAs, corporate defaults, and government inefficiency stigma, PSU banks are now the stars of the financial sector.
Key reasons behind this dramatic shift:
🔹 1. Asset Quality Improvement
GNPA ratios have fallen to multi-year lows
Most PSU banks are now net NPA below 1%
🔹 2. Credit Growth Resurgence
Double-digit loan growth across retail, MSME, and infrastructure
Focus on digital banking and mobile-first services have helped increase customer base
🔹 3. Government Push
Massive infra push (railways, roads, housing) is fueling credit demand
Capex-linked lending growth is largely happening via PSU banks
🔹 4. Strong Financials
BoB, Canara Bank, Union Bank, and SBI have posted record profits
Net Interest Income (NII) and Operating Profit are at all-time highs
Dividend yields of 4–6% make them attractive to income investors
🔹 5. Re-Rating by FIIs and DIIs
PSU Banks were under-owned; that’s now reversing.
With global macro uncertain, foreign funds are betting on domestic demand-driven banks.
📈 Stocks in Focus:
State Bank of India (SBI): India’s largest lender, breaking out of long-term ranges
Bank of Baroda: Strongest PSU performer in 2024, tech-heavy
Canara Bank & Union Bank: Solid earnings, undervalued
💡 Technical View:
PSU Bank index hitting new all-time highs
BoB, Canara, Union, PNB giving weekly/monthly breakouts
🧠 Trader Takeaway:
Best for momentum trading, swing trades, and F&O strategies
Investors focusing on value + dividend + PSU story
🧠 Final Thoughts
In the 2025 trading and investment landscape, Reliance, HDFC Bank, and PSU Banks offer three distinct opportunities:
Reliance is a structural long-term compounder with growth in multiple verticals.
HDFC Bank is a value + recovery bet, especially appealing to contrarian investors.
PSU Banks are momentum machines backed by real earnings and strong policy tailwinds.
They are each being watched closely by FIIs, DIIs, retail traders, and even global strategists due to India’s growing weight in global indices like MSCI and FTSE.
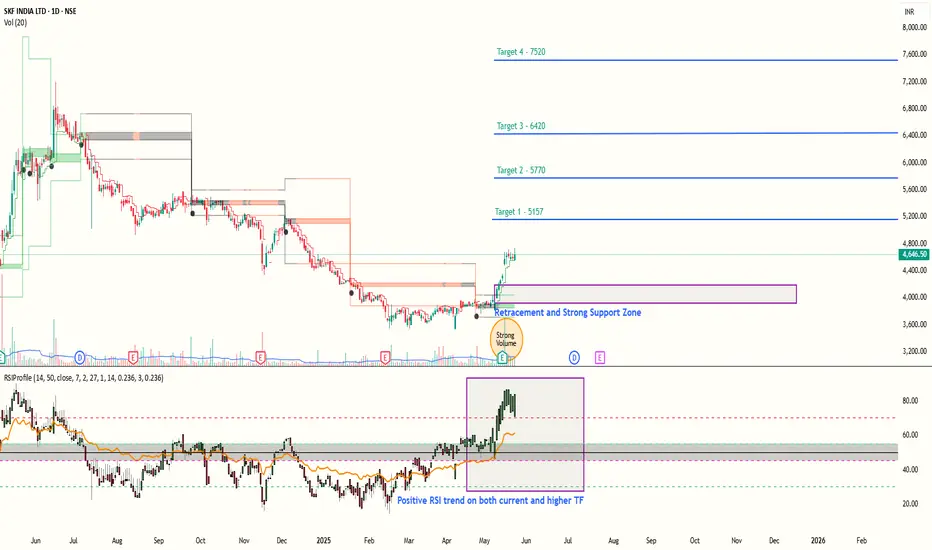
SKF Great Bullish PotentialSKF has been showing continous Bullish RSI trend in the daily chart. And fundamentals also exhibit strength, with the company being debt free, Good cashflow, Positive earnings and Rising EPS.
It has a very strong support zone in 3900-4200 price range, where big institutional and responsive buyers are present.
Big volume on chart indicate entry of initiative buyers after the price testes lows for some time and was effectively bought by responsive buyers.
RSI Profile shows - A Clear bullish trend.
We expect the price to continue rising in the coming weeks with the following targets
Targets :-
1) 5157
2) 5770
3) 6420
4)7520
Bank nifty Futures 24.04.25Expecting a flat to a gap up opening. More likely a neutral/ balanced day. Buyers are going to struggle but may defend. So, need to be careful and watch OF and MP. We may get movement on both sides.

Bitcoin Outlook: Bullish Momentum with the New YearWith Donald Trump now back as President in America, the success of initiatives like Trump Coin serves as an example of what’s possible. Similarly, Bitcoin appears poised to attempt a new high as we enter the new year.
However, before that, we’re seeing some bearish retests and market pullbacks. These corrections are part of the process before Bitcoin pushes toward a new high.
I’ve explained the analysis in detail on the chart for better understanding.
Don’t forget to like, comment, and follow for more updates!

BankNifty - Inventory Analysis with Market Profile - 16 Aug 2024Hi hope you all are doing good, and in today's video i want to share where the positions are being accumulated in BankNifty and why i am long biased.
Area where price stability is seen = 49969
Stops seen = 49817
Area where sellers are competing = 51000
Area where buying interest or supply will shut off = 47500
Disclaimer: Please always do your own analysis or consult with your financial advisor before taking any kind of trades.
Dear traders, do not forget to hit like and follow me, and please do share your thoughts in below comment box, as your response will help me strengthen my market understanding.
Thank you.

HDFCBank - Inventory Analysis using Market Profile - 14 Aug 2024Hope you all are well and HDFCBank is showing signs of inventory accumulated around 1600. In this video i am sharing my process, how i use TradingView's inbuild TPO - Market Profile and Volume Profile indicators to understand the inventory development and how smart money is accumulating their positions in this stock.
1600 is the line in sand and there are less transactions happening below 1600 - Question you should ask is why?
Price is nicely chopping in a 1 month range of 30 points
Below 1600 is where i am looking for responsive buying
Target 1 is 1650, followed by 1700 and the gap fill above 1700, and looking to acquire positions till 1500 in this stock.
This is a long term stock where Market Profile is helping me to understand how positions are being created based on the transactions that are happening.
Disclaimer : Please always do your own analysis or consult with your financial advisor before taking any kind of trades.
Dear traders, do not forget to hit like and follow me, and please do share your thoughts in below comment box, as your response will help me strengthen my market understanding.
Thank you.

ES - Inventory Analysis & Trade Plan - 13 August 2024Hello and i hope everyone is doing well. In today's video i want to cover how the inventory developed yesterday and what are the auction paths that i am watching to trade ES today.
Current levels to observe the reaction of price: 5356 & 5383
Current Inventory is developing above PDC and have an excess - so the inventory is long but developing in PDR, so looking for more chop
Rejection seen at 5367.25 and supply shutting off at that price point
The structure of ON auction is balanced profile and looking for more rotational development today
Break of PDH or PDC are important references and i will be observing for continuation, lack of continuation will lead to reversal towards the VPOC
Also from the volume footprint - seeing supply above 5400 and supply shutting off below 5367
Disclaimer:- Please always do your own analysis or consult with your financial advisor before taking any kind of trades.
Dear traders, do not forget to hit like and follow me, and please do share your thoughts in below comment box, as your response will help me strengthen my market understanding.
Thank you.

AMD stock to take long entryLong AMD stock above 78 after the BO of the resistance line. This stock is in the correction stage & starting to pull back in that direction. The stock is also taking the support of 50 EMA levels and RSI crossing the 60 level too. This is for your educational purpose only.

NIFTYImportant Levels for 16/08/2022.
Clearly the index where i will be placing my bets on the long side.
Once we break PDH @ 17753 and sustain above it for complete 5 mins, we can take longs with SL of 17730 for targets of 17795,17805 and 17830.
Shorting is out of question if we open flat or with a gap down.
If we see a big gap up (as can be seen now as per SGX), will wait for sustenance above 17830 and then take longs for targets of 17865.17900 and 17930.

BANK NIFTYImportant Levels for 16/08/2022.
The index is showing strength and we are seeing gaps being sustained and supports holding fort. But one thing against it no shift in Value Area despite the fact that the price has stayed well above the VA last session.
These two points being contrary to each other does create enough doubt regarding the movement of the index.
In my point of view i will be waiting for a retest of the VA before initiating any long trades.
With important reference on the upside being 39130-39210, any negativity seen with volumes, i will look to short with a 50-60 point SL for targets of 39000,38940 and 38830.
Longs i will be taking if the price finds support at VAH 39000, with SL of 38940 for targts of 39110,39200 and 39250.

NIFTYImportant Levels for 12/08/2022.
We witnessed great absorption at 17660-17680 zone and at 17718-17730 areas.
Once we clear these zones the targets to look on the downside is 17610 and 17580. SL can be placed around 17680.
And on the upside, we can look for targets of 17750,17805 and 17825. SL can be placed at 17710.

BANK NIFTYImportant Levels for 12/08/2022.
Clearly the stronger of the two indices.
We opened gap up and clearly sustained above it, although there was no follow through and a big move, we did not come close near DL.
38830 is the reference level to look for before initiating shorts. Once we trade and sustain below 38830, we can place shorts with SL at 38900 for targets of 38770,38700 and 38600.
If we trade above 38980, we can look for targets of 39160 and 39250, with SLs placed at 38900.

NIFTYImportant Levels for 11/08/2022.
A completely range bound day. 17465-17585 is the zones which need to be broken for some good moves.
Longs can be taken above 17585 for targets of 17620,17640 and 17660. SL has to be kept around 17550.
Shorts can be taken below 17520, with SL of 17550 for targets of 17470,17440 and 17380.
Today we witnessed good buying at 17470-17480 levels but it was buyers defending their positions rather than fresh and aggressive buying, Sellers can gain control if we slide and sustain below 17467 and eventually will can see 17316 reference levels.
Can be a volatile expiry tomorrow.

BANK NIFTYImportant Levels for 11/08/2022.
Much like Monday's closing, today's closing does not give any indication as to where the index is heading. On the upside 38420-38500 is a major resistance zone and on the downside 38150-38240 can act as a strong support. So unless we break out of these reference zones choppiness is expected.
For tomorrow, safe traders can wait for the mentioned zone to break and risky traders can look to short at the break of 38250 with SL of 38315, for targets of 38140, 38080 and 38000.
On the upside, if we sustain for the first 15 mins above 38450, we can go for longs for targets of 38560,38660 and 36800 with a 50-60 point SL.
The buyers are defending well but we are not seeing aggressive buying, that is making trading the index a bit tricky.

NIFTYImportant Levels for 08/08/2022.
We are expecting a flat o slightly negative open. The important reference zone is 17360-17390, once we break and sustain below it, we can short with SL of 17390 for targets of 17320,17280 and 17230.
For longs we need to sustain above 17500 for good trades.

BANK NIFTYImportant Levels for 08/08/2022.
We are expecting a flat to slightly negative opening today. The important reference zone for today lies at 37850-37936 levels, once we sustain below it we can short with SL placed at 37940 for targets of 37730,37660 and 37560.
Taking longs can be tricky unless we clear the big resistance area above 38150.

NIFTYImportant Levels for 05/08/2022.
If we open flat, any price rejection seen at the reference region of 17380-17425 can be used as an entry for shorts will SL of 25-30 points and we can look for targets of 17320,17280 and 17250.
If price sustains above 17325, we can take longs with SL of 17400 for targets of 17470 & 17500.
In case of a gap up, i shall wait for proper price action before initiating trades.
If we see a gap down, 17230-17250 can act as support and longs can be planned if we see good volume support for targets of 17310,17330 and 17380. SL can be of 20-25 points,
In case of a big gap down, will prefer to sit tight till the price is not above 17200 and then plan longs, shorts only below Day low.

BANK NIFTYImportant Levels for 05/08/2022
We witnessed a highly volatile expiry and a close below the previous support zone.
If we open flat and start moving up, 37800-37875 can act as a resistance zone and if we get good selling volumes, we can sell at this zone with a 50 point SL for targets of 37560,37500 and 37420.
But if we open flat and sustain above 37875, we can go for longs with SL of 37800 for targets of 38080,38200 and 38270.
If we open with a gap up, we wait for the price action at our mentioned references and then initiate trades. On the upper side the important reference point is 38400 once we trade above 38250. On the down side short trades if taken from 38080 levels can look for 38860 as potential final targets.
If we see a gap down, 37440-37500 can act as support and shorts to be initiated below 37450 for targets of 37300,37120 and 37000.
In my opinion, the presence of a buying tail indicates positivity.
