#XAGUSD⚡ Silver – What Happens Next? ⚡
🥈 Silver began a new impulsive cycle in April 2025, with its 1st wave in October. After a flat corrective 2nd wave (C failure), it surged into a powerful 3rd wave, peaking at $84 on 29 Dec 2025.
📈 The 4th wave followed as another flat correction with strong buying pressure, before Silver entered its largest 5th wave, hitting a record high of $121 on 29 Jan 2026.
🚨 But here’s the critical signal: the entire 5th wave was retraced in just one day. In Elliott Wave terms, this invalidates the continuation of the bull run.
📉 Conclusion:
• The $121 peak marks a long-term high.
• Silver is likely to revert to its true value below $60 by mid-March 2026.
Markets

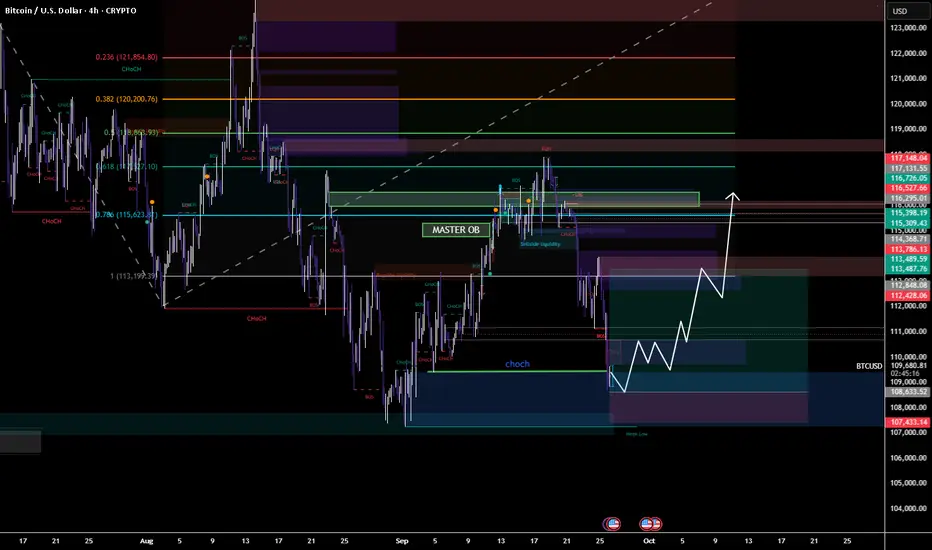
BTC Bulls Eyeing a Reversal From Liquidity SweepBTC Bulls Eyeing a Reversal from Liquidity Sweep”
📌 Description:
Bitcoin swept downside liquidity near 108k, tapping into a demand zone. If this level holds, expect a strong recovery toward the 113.5k–116.5k supply zones, with the Master OB acting as a key magnet for price.
📈 Trade Plan (4H BTCUSD)
🔹 Entry Zone (Long):
108.0k – 109.0k (liquidity sweep + demand zone).
🔹 Stop Loss (SL):
Below 107.0k (weak low / invalidation).
🔹 Take Profit (TP):
TP1: 112.4k (minor FVG close)
TP2: 113.8k – 114k (OB retest zone)
TP3: 115.5k – 116.2k (major supply / Master OB)
🎯 Risk-to-Reward (approx):
Entry: 108.5k
SL: 107k (≈ -1.5k / -1.3%)
TP1: 112.4k (≈ +3.9k / +3.6%) → RR ≈ 1:2.7
TP2: 114k (≈ +5.5k / +5%) → RR ≈ 1:3.8
TP3: 116.2k (≈ +7.7k / +7.1%) → RR ≈ 1:5.2
⚡ Clean long setup: liquidity sweep → bullish CHoCH → push into OB/supply above.
Tech’s Digital RevolutionIntroduction
The 21st century is witnessing a transformation unlike any in human history — the Digital Revolution. Driven by rapid advancements in technology, this revolution is altering how people live, work, interact, and even think. From smartphones to artificial intelligence, the world has moved beyond traditional analog systems to a deeply connected, digital-first environment.
While the Industrial Revolution mechanized human labor, the Digital Revolution is augmenting human intelligence and automating entire workflows. It is not merely a change in tools; it is a change in culture, economics, governance, and lifestyle.
1. What is the Digital Revolution?
The Digital Revolution refers to the sweeping changes brought about by digital computing and communication technologies. It began in the late 20th century and has accelerated exponentially in the 21st century.
Core Characteristics:
Replacement of analog systems with digital systems
Ubiquitous access to the internet and mobile networks
Automation and artificial intelligence
Cloud computing and data analytics
Real-time global communication
In essence, the Digital Revolution is the age where information is the most valuable asset, and data is the new oil.
2. A Brief History of the Digital Revolution
Phase 1: Birth of Computing (1940s–1960s)
Early computers like ENIAC and UNIVAC were massive and slow.
Technologies were primarily limited to governments and universities.
Phase 2: The PC Era (1970s–1980s)
Companies like Apple and IBM introduced personal computers.
Software, databases, and computer programming became accessible.
Phase 3: The Internet Age (1990s–2000s)
Introduction of the World Wide Web revolutionized communication.
Email, e-commerce, and digital media boomed.
Tech companies like Google, Amazon, and Microsoft reshaped the economy.
Phase 4: Mobile and Cloud Computing (2010s)
Smartphones and cloud services brought digital power into everyone's pocket.
Apps, GPS, mobile payments, and social media became everyday tools.
Phase 5: The AI and Automation Era (2020s–Today)
Artificial Intelligence, Machine Learning, Blockchain, and IoT are creating intelligent, interconnected ecosystems.
Robotics, automation, and virtual assistants are replacing human roles.
3. Key Technologies Driving the Revolution
a. Artificial Intelligence (AI) & Machine Learning
AI enables machines to learn, reason, and make decisions. It powers:
Chatbots like ChatGPT
Self-driving cars
Recommendation systems (e.g., Netflix, Amazon)
Predictive analytics in trading and healthcare
b. Cloud Computing
Cloud platforms like AWS, Azure, and Google Cloud allow data storage and computing power over the internet, reducing dependency on physical infrastructure.
c. Big Data Analytics
Data from social media, sensors, transactions, and IoT devices is analyzed in real time to derive insights and inform decision-making.
d. Blockchain Technology
A decentralized ledger system revolutionizing digital trust, finance, and data integrity — key to cryptocurrencies, NFTs, and smart contracts.
e. Internet of Things (IoT)
Devices connected via the internet collect and share data — from smart homes to industrial automation.
f. 5G and Connectivity
High-speed internet is enabling real-time, low-latency communication — vital for VR, telemedicine, remote work, and automated trading.
4. Societal Impact of the Digital Revolution
a. Communication and Connectivity
Social media platforms (Instagram, X, WhatsApp) allow instant global communication.
Remote work and virtual meetings (Zoom, Teams) are now mainstream.
Information spreads faster than ever, democratizing knowledge.
b. Education and Learning
Online learning platforms (Coursera, Udemy, Khan Academy) offer global access to education.
AI tutors, AR/VR classrooms, and gamified learning are reshaping how we learn.
c. Healthcare Innovation
Telemedicine, AI diagnosis tools, and health-tracking wearables (Fitbit, Apple Watch) personalize healthcare.
Drug discovery is accelerated by AI models.
d. Urban Life and Smart Cities
Smart traffic management, digital IDs, and surveillance systems are transforming city planning.
Public services are increasingly digital-first (e-governance, digital voting).
5. The Digital Revolution in Trading and Finance
a. Algorithmic & Quantitative Trading
Trading decisions are now driven by data models and algorithms.
AI scans charts, indicators, and news in milliseconds to execute trades.
b. High-Frequency Trading (HFT)
Specialized firms use ultra-low latency systems to execute thousands of trades in fractions of a second.
c. Mobile Trading Apps
Retail investors have access to platforms like Zerodha, Robinhood, and Groww, democratizing market access.
d. Cryptocurrency & Blockchain Finance
Bitcoin, Ethereum, and DeFi systems represent a new paradigm of decentralized finance (DeFi).
e. Robo-Advisors & AI Portfolios
AI-driven advisors like Wealthfront and Betterment customize investment portfolios based on risk appetite and goals.
f. Real-Time Analytics & Sentiment Tracking
Platforms analyze social sentiment (e.g., Reddit, Twitter) to gauge retail market moves (e.g., GameStop saga).
Traders track global events and volumes using data dashboards.
6. Digital Disruption Across Industries
a. Retail
E-commerce giants (Amazon, Flipkart) use AI to personalize shopping.
AR/VR is redefining the shopping experience.
b. Media & Entertainment
OTT platforms (Netflix, Prime, YouTube) personalize content delivery using AI.
Deepfakes, virtual influencers, and AI-generated content are becoming common.
c. Manufacturing & Logistics
Smart factories use sensors, robots, and AI for predictive maintenance.
Blockchain ensures transparency in supply chains.
d. Agriculture
Smart sensors, drones, and predictive analytics are optimizing crop yield, water use, and pest control.
e. Transportation
Autonomous vehicles, EVs, and ride-sharing apps (Uber, Ola) are digitizing mobility.
Conclusion
The Digital Revolution is more than a tech trend — it is a societal transformation reshaping every aspect of human life. From algorithmic trading and AI advisors in finance to smart cities and quantum computing, digital technologies are opening up vast new possibilities.
But with this power comes responsibility. Governments, corporations, and citizens must work together to ensure ethical innovation, inclusive access, and digital resilience. The future belongs not just to those who adopt technology — but to those who use it wisely, responsibly, and creatively.
Inflation Nightmare Introduction: What Is the Inflation Nightmare?
Inflation is often described as a slow-burning fire in the economy, but when it accelerates uncontrollably, it becomes a nightmare — distorting prices, eroding purchasing power, and triggering unpredictable market reactions. Traders, investors, and policymakers all dread this scenario, as inflation doesn't just change the numbers — it reshapes the economic landscape. From commodity spikes and interest rate hikes to sector rotations and recession fears, inflation is a force no one can ignore.
This article explores the anatomy of an inflation nightmare, its impact on various asset classes, central bank responses, and how traders can navigate this storm.
1. The Anatomy of Inflation
Inflation refers to the general rise in the price level of goods and services over time. While moderate inflation is considered normal in a growing economy, hyperinflation or sustained high inflation poses significant threats.
Types of Inflation:
Demand-pull inflation: Too much money chasing too few goods.
Cost-push inflation: Rising input costs (e.g., oil, labor) drive up prices.
Built-in inflation: Wage-price spiral — workers demand higher wages to keep up with inflation, causing costs to rise further.
Stagflation: A toxic mix of high inflation and stagnant growth (e.g., 1970s U.S. economy).
2. Causes of the Modern Inflation Nightmare
a. Supply Chain Disruptions
The COVID-19 pandemic and geopolitical conflicts (e.g., Russia-Ukraine war) created bottlenecks in supply chains, leading to shortages and surging prices for essential goods like semiconductors, food, and energy.
b. Monetary Policy & Stimulus
Central banks flooded economies with easy money and stimulus packages, particularly in 2020–2021. Low interest rates and quantitative easing increased liquidity — but once demand returned, supply couldn’t keep up.
c. Energy & Commodity Spikes
Natural gas, oil, wheat, and metals saw explosive price rallies due to global shortages, sanctions, and war-related disruptions, feeding directly into CPI inflation.
d. Wage Pressures & Labor Shortages
Post-pandemic labor shortages pushed wages higher in developed economies, particularly in service and logistics sectors, adding fuel to inflation.
3. How Inflation Distorts Financial Markets
a. Equity Markets: Sector Rotation & Volatility
Growth stocks (especially tech) suffer due to rising interest rates lowering the present value of future earnings.
Value stocks (e.g., banks, energy, industrials) gain favor as they often benefit from higher rates or pricing power.
Consumer discretionary gets hit hard; consumers cut spending on non-essentials as prices rise.
b. Fixed Income: Bond Yields Surge
Inflation erodes the real returns of fixed-income securities.
Investors demand higher yields → bond prices fall.
Central banks raise benchmark interest rates, making existing bonds less attractive.
c. Commodities: Inflation Hedges
Gold, silver, oil, wheat, and copper surge during inflationary periods.
Traders flock to commodities as real assets that hold value when fiat currencies weaken.
d. Currency Markets: Dollar Dominance or Decline
Inflation differentials between countries impact currency strength.
A hawkish U.S. Fed can cause dollar appreciation, pressuring emerging market currencies and debt.
4. Central Banks vs. Inflation: A Battle of Credibility
When inflation surges, central banks become market movers. Their policies have enormous implications for all asset classes.
Key Tools:
Interest rate hikes: Make borrowing costlier → reduce demand.
Quantitative tightening (QT): Reduces liquidity in the system.
Forward guidance: Sets expectations for future policy moves.
Inflation Targeting & Credibility
Central banks like the U.S. Federal Reserve, ECB, and RBI aim for 2% inflation targets. When inflation consistently overshoots, credibility is at risk, potentially unanchoring expectations and accelerating inflation further.
Soft Landing vs. Hard Landing
Soft landing: Cooling inflation without triggering a recession.
Hard landing: Aggressive tightening causes economic contraction, job losses, and market crashes.
5. Inflation's Psychological Impact on Trading
a. Uncertainty & Volatility
Unpredictable inflation leads to whipsaw price action. A single CPI or PPI print can send indices soaring or crashing.
b. Changing Correlations
Traditional correlations (e.g., stocks up when bonds up) break down.
Traders must adapt quickly to new inter-market relationships.
c. Fear vs. Greed
Inflation triggers fear-driven trading, especially in leveraged positions like options or futures. This fuels intraday volatility and wider bid-ask spreads.
6. How Traders Can Survive the Inflation Nightmare
a. Watch the Data Closely
Key indicators:
CPI & Core CPI
PPI (Producer Price Index)
Wage growth
Commodity indices
PMIs & Retail Sales
Economic calendars become vital. “Macro data trading” becomes the norm, with markets swinging based on even minor surprises.
b. Focus on Inflation-Resistant Assets
Commodities: Gold, oil, agricultural products
TIPS: Treasury Inflation-Protected Securities
Dividend stocks with pricing power
Real estate/REITs in inflation-tolerant regions
c. Sector Rotation Strategy
Shift from rate-sensitive growth stocks to:
Energy
Basic materials
Industrial goods
Financials
d. Use Derivatives Strategically
Options allow hedging against downside volatility.
Commodity and bond futures help in speculating or hedging inflation trends.
Volatility products (e.g., VIX futures) can offer short-term profits during CPI days.
e. Position Sizing & Risk Management
High volatility demands tight stops, smaller positions, and more disciplined exits.
Leverage must be managed conservatively — inflation-driven moves can be fast and brutal.
7. Real-World Examples: Historical Inflation Nightmares
a. The 1970s U.S. Stagflation
Oil embargo + policy missteps = soaring inflation and unemployment.
Fed eventually raised interest rates to 20% under Paul Volcker, causing a recession but taming inflation.
b. Zimbabwe (2000s)
Hyperinflation reached 79.6 billion percent per month.
Currency collapsed, barter and USD became alternatives.
c. Turkey & Argentina (2018–2024)
Currency depreciation and loose monetary policy led to double- and triple-digit inflation.
Savings wiped out; capital flight intensified.
8. Inflation & Geopolitics: A Dangerous Mix
Inflation can topple governments. Rising food and fuel prices have historically triggered protests and revolutions.
It increases global inequality, disproportionately hurting the poor.
Inflation linked to war and sanctions becomes even harder to control, as seen in energy and grain prices during the Ukraine conflict.
Conclusion: Turning Nightmare into Opportunity
Inflation may be a nightmare for governments and central banks, but for savvy traders and investors, it can also present unique opportunities. The key is to stay informed, flexible, and disciplined. Understanding macroeconomic indicators, adjusting asset allocation, rotating sectors, and using hedging instruments are critical.

Shukra Pharmaceuticals Ltd – Long Bias Trade SetupShukra Pharmaceuticals is currently showing signs of bullish intent after breaking out of a well-defined consolidation range. The stock formed a series of higher lows, indicating accumulating buying pressure, and recently broke above a key resistance level with strong momentum.
The breakout candle was large and decisive, closing near its high, which signals confidence among buyers. Following the breakout, price has started to establish a new base just above the previous resistance — now acting as support — a classic sign of strength and trend continuation.
Volume during the breakout session was notably higher than recent averages, reinforcing the conviction behind the move. Any shallow pullbacks toward the breakout zone or previous consolidation highs can provide low-risk buying opportunities.
If the current structure continues, the next leg higher may test prior supply zones or unfilled gaps visible on the left side of the chart.

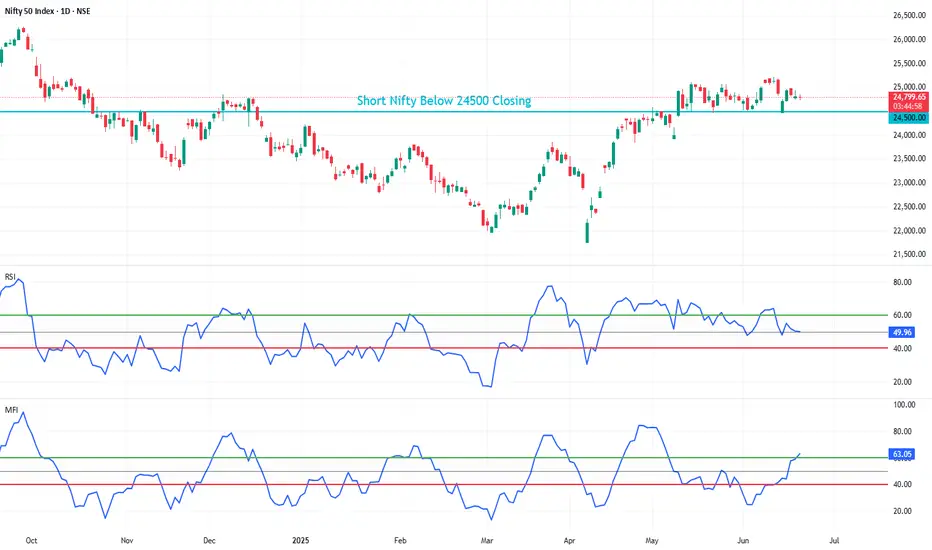
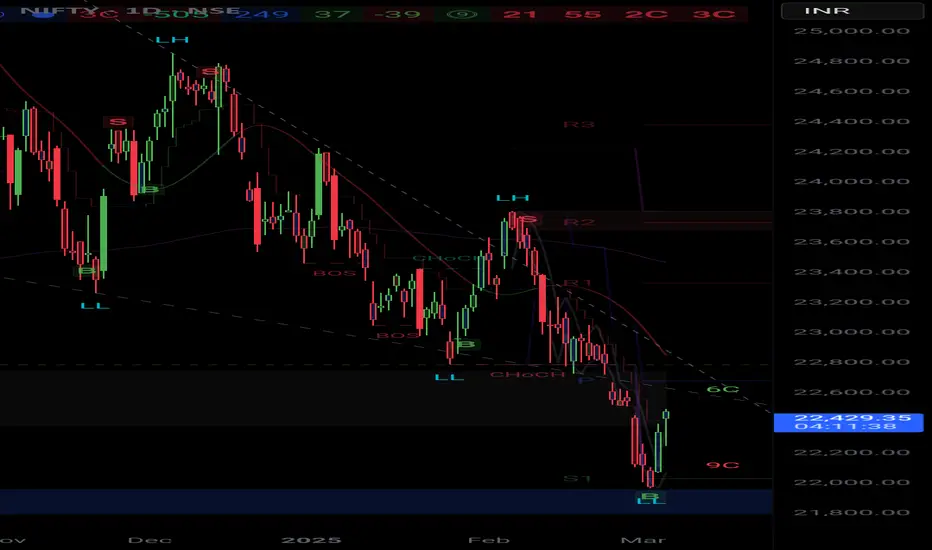
NIFTY (OVERALL MARKET) SETUP FOR SHORTING Please don't look for longs if nifty breaks below 24500, if it is above 24500 then you can see signs of recovery and re-asses your trades but untill then please wait for nifty to fall below 24500₹ levels to short
If nifty breaks then overall markets fall, for better optimization look for stocks now which you think are overvalued now
and then when nifty breaks 24500 then sell or buy PE (any ways you want to) that overvalued stock because that will usually have a larger fall if markets fall.
Please be prepared apart from your daily trading !!
May you all be happy, May you all be profitable :)
Nifty 50 Market Outlook: Key Levels, Trends, and Forecast.As of March 6, 2025, the Nifty 50 index is experiencing fluctuations influenced by various market factors. In recent sessions, the index has faced declines, primarily due to concerns over U.S. trade policies and their potential impact on global markets.
Current Market Trends:
Trade Policy Concerns: Persistent uncertainties surrounding U.S. trade policies have contributed to market volatility, affecting investor sentiment.
Sector Performance: Information technology stocks have shown resilience, with companies like Coforge and Infosys leading gains after securing significant deals and receiving positive forecasts.
Forecasted Levels:
PL Capital's Projection: In October 2024, PL Capital projected that the Nifty 50 could reach 27,867 within 12 months, driven by resilient sectors and cautious optimism amid geopolitical uncertainties.
Nomura's Range Estimate: As of February 2025, Nomura forecasts the Nifty 50 to fluctuate between 21,800 and 25,700 throughout the year, reflecting potential market volatility.
Jefferies' Growth Outlook: In December 2024, Jefferies anticipated a 10% increase in the Nifty 50 by December 2025, targeting a level of 26,000, supported by expectations of GDP growth and corporate earnings recovery.
Key Support and Resistance Levels:
Technical analysis indicates that the Nifty 50 has critical support in the 23,900–24,000 range. A sustained break below this level could lead to further downside toward 23,700. On the upside, resistance is identified between 24,500 and 24,800, which the index would need to surpass for a bullish trend.
Conclusion:
The Nifty 50's trajectory in 2025 is subject to various factors, including global trade policies, sector-specific performances, and domestic economic indicators. While forecasts suggest potential growth, investors should remain cautious of the prevailing uncertainties and monitor key support and resistance levels to make informed decisions.
Support and Resistance 'Support' and 'resistance' are terms for two respective levels on a price chart that appear to limit the market's range of movement. The support level is where the price regularly stops falling and bounces back up, while the resistance level is where the price normally stops rising and dips back down.
The basic strategy is to buy at the support level and sell at the resistance level, recognizing that these are zones of potential demand and supply changes. How does resistance work?

TradingTechnical analysis often considers the following to evaluate investment and trading decisions:
Historical stock market data.
Behavioral economics.
Market psychology.
Price and volume trends.
Inflation.
Trading trends.

"Tomorrow’s Nifty 50 Secret: Trade with 90% Accurate Breakout LeFor tomorrow's Nifty 50 trading based on the chart:
The orange levels on your chart (24,948.20 and 25,064.80) are key pivot levels where high-probability trades can be taken.
If the market opens below 24,948.20, this level acts as a resistance zone, signaling potential for a selling opportunity as the market may face downward pressure.
If the market opens above 25,064.80, it becomes a support zone, signaling a buying opportunity as the market might continue upward momentum.
Use the 5-minute timeframe to closely track the price movement.
Entry strategy:
Buy trade: If Nifty breaks above 25,064.80 and holds, enter a long position for a breakout. This becomes a strong support level if the market opens above it.
Sell trade: If Nifty breaks below 24,948.20 and sustains, enter a short position. This becomes a solid resistance level if the market opens below it.
These levels are 90% accurate, and the plan is to wait for a clear breakout beyond these orange lines before entering a position.
Key takeaway: The direction of the opening will decide whether these levels act as buying or selling zones, making them crucial for your trade setups.

AFFLE INDIA shows positive trendAFFEL INDIA has shown positive trend after break out from level.
Its has perfectly clear rounding bottom pattern break out and since last 4 week sustain above breakout level.
Expected this momentum continues and as per pattern it may hit 2100++ level. Which is around 35-40% upside.
I am not a registered advisor so please take advice with your registered financial advisor before making decision of any investment. All investment is subject to market risk.

Data Base Trading Part -2 #NSE #BSE #OptionchainTo study an option chain, focus on the current market price, displayed in the centre. Analyse the built-up data to understand market direction based on recent changes in open interest and price. ITM call options are typically highlighted in yellow, making it easier to distinguish them from other options.
Nifty option chain is considered to be the best advance warning system of sharp moves or break outs in the index.
So, if you see an aggressive increase in open interest in puts, it is most likely being led by the institutions who are selling puts and it hints at a support level below which the market is unlikely to fall. The reverse interpretation holds in case of call options OI movement. You can position your trades accordingly.

Bank Nifty on 09-04-2024Hello
I hope all of you are doing well!!
Bank Nifty analysis for educational and learning purposes.
Pl. share your point of view.
Keep Learning with NG.
Thank You
Nitin Grover

HDG bat an. HDG
Ha Do Charm 110tr/m2
1/500
Vanh dai 3, vanh dai 4
HN
Sudico...200tr/m2
HDG
Vdl: 3.000 ty.d
462, 24
486MW
MW 35 ty.d
17.000 ty.d ;)
DT 2.000 2.200 ty.d
LG 1.600 ty.d
Bds cho thue.
Ks
Vp
Dt 420 ty.d
LG 200 ty.d
Charm villa 3.000 ty.d
LG 1.500 ty.d
Green Lane q8
2.3ha
770c
4.000 ty.d
1/500
Wait: Gpxd
9.800m2
2 thap 45t
Dich Vong
Wait PL
1000m2 CC3 Dich Vong
Vp tm
Comming soon.
Trung Linh Q9
Ton kho 490 ty.d
2.7 ha
1.000 cc
100 lk
6.000 ty.d
Wait dc qh 1/500
70ha
Lao
Xong Ha tang
10tr/m2
Khanh Hoa.
Bao Dai
Ton kho 200 ty.d
Rumor:
125ha
Tay Ha Noi
Rumor:
450ha
Kcn
P.Bac
Dream. 2.3 years
Soon 🥰
Dt 3.000 ty.d
4.000 ty.d
(Nguon: dong nghiep. Tks!)

BLISSGVS AnalysisThis amazing Pharma Stock has the potential of touch 150 very soon.
Yes, you read that right. This stock with improving fundamental can reach the target of 155 from CMP of 135.95 in a matter of a few weeks.
Here are the details-
CMP- 135.95
Target- 149, 155
Stoploss- 122.70
Duration- 3-4 Weeks.
From the past couple of days Pharma Sector along with Cement and Chemical Sector have been outperforming the benchmark indices.
Let me know what you think.

COFORGE FAULTY Setup- Coforge is currently looking bullish
- Coforge can soon retrace back and take out some Buy side Liquidity
- From a swing perspective try avoiding it and wait for a retracement
- Do not enter longs here

Bank Nifty Analysis : 9th Jan 2024Sellers welcomed todays day with pressure closed at support looks tomorrow may be sideways day or profit booking can be seen.
Still sellers looks more active may break support after profit booking.
Bank Nifty closed at support 47400 to 47300 if break buyers may try to enter or trap
Resistance at 47600 to 47700


AVADH SUGAR ENERGY Technical AnalysisAVADH SUGAR ENERGY
Simply pointing some point to study the Avadh sugar chart.
1. Its forming higher high and higher low
2. Avadh sugar in uptrend
3. above 50 MA.
4. Risks & Rewards (2:1)
Conclusion:
My analysis shows potential strong bullish run.
I am not a sebi registered analyst. My studies are for education purposes only.

Nifty 50 for todayNifty 50 for today
Nifty 50 looking short down trend from at the level of 19700-750 . At this levels everyone looking for profit bookings until unless break up side 20,000. We have to wait for confirmation.
Today's outlook
If break 19700 then we can seen some downfall of 100-140+ points... Because 19600 after have GAP if market go on that zone then possible...

BOMBAY BURMAH Technical analysisBombay Burmah (BBTC)
Simply pointing some point to study the BBTC chart.
1. Its forming ascending bullish triangle.
2. BBTC in uptrend
3. above 50 MA.
4. Risks & Rewards (2:1)
Conclusion:
My analysis shows potential strong bullish run.
I am not a sebi registered analyst. My studies are for education purposes only.

Gold price recovery appears elusive below $1,975Gold price braces for the first weekly gain in three while defending the week-start rebound despite the previous day’s retreat from a convergence of the 100-SMA and a two-week-long falling resistance line, currently around $1,973-75 by the press time. It’s worth noting that a one-month-old horizontal area joins upbeat RSI (14) and bullish MACD signals to keep the XAUUSD buyers hopeful of crossing the aforementioned resistance confluence. Following that, the metal’s run-up to the $2,000 psychological magnet and then to the previous monthly high of around $2,010 will be imminent. However, the yearly high marked in May around $2,067 and the previous year’s peak of near $2,071 could challenge the bullion buyers afterward.
Meanwhile, a horizontal area comprising levels marked since early October joins the 200-SMA to highlight $1,931-30 as a short-term key challenge for the Gold sellers. In a case where the precious metal drops below $1,930, the 50% Fibonacci retracement of its October-November upside, close to $1,910, will precede the $1,900 round figure to act as the final defense of the buyers. It’s worth noting that 61.8% and 78.6% Fibonacci ratios, respectively near $1,885 and $1,850 could test the XAUUSD bears past $1,900 and before October’s bottom of $1,810.
Overall, the Gold price appears in recovery mode but the upside needs validation from $1,975 and the US data.

Analysis: Nasdaq 100 Bullish Flag Breakout TradeAnalysis: Nasdaq 100 Bullish Flag Breakout Trade
Based on the bullish flag pattern breakout in Nasdaq 100 and your expectation of more buyers entering the market, i have identified a trade opportunity. With a buy entry at 15129.7, a stop loss at 14626.0, and a take profit at 16694.7, i have defined your risk and reward targets. Here is a breakdown of the analysis for this trade setup:
Index: Nasdaq 100 (Ustec100)
Entry Price: 15129.7
Stop Loss (SL): 14626.0
Take Profit (TP): 16694.7
Bullish Flag Pattern Breakout:
i have observed a bullish flag pattern in the Nasdaq 100 index, which is a continuation pattern indicating a potential upward move following a brief consolidation phase. The breakout from the flag pattern suggests that the bullish momentum is likely to continue, attracting more buyers into the market.
Entry Point (15129.7):
My chosen entry point is at 15129.7. This entry point should be determined based on my analysis of key support and resistance levels, trend lines, or other technical indicators that confirm the breakout and indicate a favorable entry for the anticipated upward move.
Stop Loss (14626.0):
To manage risk, i have set a stop loss at 14626.0. This level is placed below a significant support level or a point that, if breached, would invalidate the bullish scenario. The stop loss acts as a safeguard, helping to limit potential losses in case the trade moves against your expectations.
Take Profit (16694.7):
My take profit level is set at 16694.7. This level represents my target for closing the trade and taking profits. It should be determined based on resistance levels, Fibonacci extensions, or other technical indicators that suggest potential areas where the price might encounter selling pressure or reach a significant target.
It's important to note that market conditions can change rapidly, and it's crucial to monitor price action and adjust your trade management accordingly. Additionally, consider fundamental factors, economic data, and news events that may impact the Nasdaq 100 index, as they can influence market sentiment and price movement.
Please conduct your own comprehensive analysis and use risk management strategies to protect your trading capital. Following a well-defined trading plan and staying disciplined are vital for successful trading in the financial markets.
