USDJPY Pullback Explained: Trend Support in Focus!For me, USDJPY is still behaving like a healthy uptrend, not a market that is rolling over. Price has been respecting a clear rising channel structure, with buyers consistently defending higher lows.
The recent move lower looks more like a pullback into major trend support rather than a sign of weakness. This is exactly how strong trends usually behave, they pause, retrace, and then decide the next leg based on support reaction.
From a broader perspective:
On the fundamental side, currencies are currently adjusting to shifting rate expectations and global risk sentiment. In such phases, trends rarely reverse immediately. Instead, price often retraces into key levels before continuing or changing structure.
What I’m watching now:
As long as the rising channel and demand zone hold, the overall structure remains intact. The next move will largely depend on how price reacts at this support, not on short-term volatility.
This is not a trade call, it’s an observation of market behavior and structure.
Disclaimer: This analysis is for educational purposes only and does not constitute financial advice. Trading involves risk.
Marketupdate

USDJPY – A Global Repricing Phase, Not a Random MoveWhen I look at USDJPY, this move doesn’t feel random to me. It looks like part of a broader global adjustment phase rather than something driven by this pair alone.
Price Context:
Price spent a long time reacting from a major supply zone before showing a clear structure shift. Since then, the market has been respecting an ascending channel, with higher highs and higher lows.
Why this move makes sense:
As global risk sentiment shifts and interest rate expectations change, currencies often move together. That’s why similar moves are visible across multiple FX pairs, this is a broad-based repricing, not a pair-specific reaction.
Current Structure:
The recent pullback into demand and trend support looks like a healthy retracement, not a breakdown. As long as this structure holds, the broader trend remains intact.
Disclaimer: This analysis is for educational purposes only and does not constitute financial advice. Trading involves risk.

Gold Hits Resistance Inside Rising Channel | Short-Term PullbackHello Everyone, i hope u all will be doing good in your life and your trading as well, let;s analyise Gold as it is trading inside a rising channel, but price is currently facing strong resistance near the channel top. The recent move shows signs of rejection, which opens the door for a short-term pullback, not a trend reversal.
This is a counter-trend short focused only on a corrective move. As long as price stays below the marked resistance zone, selling pressure can continue toward lower channel support. Buyers are still in control on higher timeframes, so shorts should remain quick and disciplined.
Key Levels
Short Zone: Near channel resistance
Pullback Targets: 4625 → 4610 → 4597
Invalidation: Above 4660
Disclaimer This analysis is for educational purposes only and should not be considered as financial advice. Trading involves risk. Please do your own research and use proper risk management before taking any trade.
Analysis By @TraderRahulPal | More analysis & educational content on my profile.
If this update helped, like and follow for regular updates.

XAUUSD (Gold) | BULL VS BEAR | Technical Level Gold (XAUUSD) | Strategy: Buy on Dip & Breakdown Trade | Timeframe: Intraday
Buy on Dip Strategy (Trend-Following)
* Trade Type: Buy Stop
* Entry: 4,603
* Target 1: 4,616
* Target 2: 4,632
* Stop Loss: 4,588
View:
* This setup aligns with the higher-timeframe bullish trend. Buying above 4,600 indicates continuation strength, targeting recent resistance zones. Ideal if price holds above the intraday pivot.
Breakdown Strategy (Risk-Off Move)
Trade Type: Sell Stop
* Entry: 4,586
* Target 1: 4,574
* Target 2: 4,566
* Stop Loss: 4,601
View:
This trade activates only if key support breaks, signaling short-term bearish momentum and profit booking. Suitable during USD strength or sudden risk-off sentiment.

XAUUSD (Gold) | Technical Outlook | 15th Jan'2026XAU/USD – Gold Technical Analysis
Price: 4,604 | Intraday: -0.47%
Gold is trading near 4,600 after a minor pullback. While short-term momentum shows selling pressure on lower timeframes, the overall trend remains strongly bullish on Daily, Weekly, and Monthly charts. Price continues to hold well above key moving averages (20, 50, 100, 200), keeping the broader uptrend intact.
Key Levels
Resistance: 4,616 → 4,632 → 4,648
Support: 4,598 → 4,586 → 4,551
Pivot: 4,599
Bullish Scenario
Above 4,600, buyers may push Gold toward 4,616–4,632. A strong breakout can extend gains toward 4,648.
Bearish Scenario
Below 4,586, selling pressure may increase, dragging price toward 4,566–4,551 (intraday correction).
Intraday Trading Strategy
Buy on dips: 4,590–4,600 | SL: below 4,566 | Targets: 4,616 / 4,632
Sell below: 4,586 (confirmation) | SL: 4,616 | Targets: 4,566 / 4,551
Bias: Bullish trend with short-term volatility.

XAUUSD (Gold) | Technical Outlook | 12th Jan'2026XAUUSD (Gold Spot) | Technical Outlook | 12th Jan'2026
Gold is trading near 4,593, gaining +1.83% intraday and holding close to record highs around 4,601. The overall trend remains strongly bullish across all timeframes, with price well above all major moving averages. Momentum indicators continue to support the upside, while short-term indicators show overbought conditions, hinting at possible intraday pullbacks or consolidation before the next move higher.
Key Decision Zone: 4,570 – 4,585
Above 4,585, bulls stay in control with upside targets at 4,600–4,605, followed by 4,620 and 4,650. Below 4,570, short-term profit booking may extend toward 4,550, 4,520, and 4,500. Shorts should be treated as intraday only, as the higher-timeframe trend remains bullish.
Above 4,585 → Bullish 🐂
Below 4,570 → Short-term Bearish 🐻
⚠️ Disclaimer:
This analysis is for educational purposes only. Not a buy/sell recommendation. Trade with proper risk management.

Bank Nifty spot 59251.55 by Daily Chart view - Weekly UpdateBank Nifty spot 59251.55 by Daily Chart view - Weekly Update
- Support Zone 58575 to 58900 for Bank Nifty
- Resistance Zone 59550 to 59850 for Bank Nifty
- Deep rooted Fear plus Geo-Political events dampening Domestic Markets

XAUUSD (Gold) | Technical Outlook | 7th Jan'2026Gold (XAU/USD) is trading near 4,465, witnessing a healthy pullback after testing the 4,500 resistance zone. Despite short-term consolidation, the overall trend remains strongly bullish across Daily, Weekly, and Monthly timeframes. Price continues to hold above key moving averages, indicating buyers are still in control.
Key Levels
Resistance: 4,500 – 4,525 – 4,550
Support: 4,450 – 4,415 – 4,380
Bullish Scenario:
Holding above 4,450 keeps the upside open toward 4,500+. A breakout above 4,505 may accelerate buying momentum.
Bearish Scenario:
A sustained break below 4,440 could trigger a corrective move toward 4,415–4,380, while the broader trend remains bullish above 4,360.
Intraday Strategy:
✔ Buy on dips near 4,450–4,435
✔ Buy breakout above 4,505
✔ Sell only below 4,440 (short-term)
Macro Triggers to Watch:
• US Dollar Index & Bond Yields
• Inflation data (CPI/PPI)
• Fed speeches & FOMC signals
• Geopolitical developments
⚠️ Disclaimer:
This analysis is for educational purposes only. Gold trading involves risk. Always use proper risk management and consult your financial advisor before taking trades.

BTC Market Update – FOMC Range ModeBitcoin is stuck in FOMC limbo — no clean pump, no dump, just tight consolidation as markets wait for Powell’s cue. Volatility is coiling, and a big move is loading.
Key Levels to Watch:
Support Zone: $92K–94K (must hold for bullish continuation)
Bullish Trigger: Break & hold above $94.6K
🎯 Next upside: $100K retest
Bearish Trigger: Break below $87.7K
🎯 Downside risk: Low $80Ks before a rebound attempt
Market View:
This is a classic decision range — expect sharp expansion once direction is chosen. Stay alert around FOMC headlines; volatility can spike fast.
Bias: ⚖️ Neutral → Breakout pending
Disclaimer:
For educational purposes only. This is not financial advice. Trading in Forex, Gold, Crypto, and markets involves high risk. Do your own research and trade at your own risk.

Gold Bulls Eye Major Resistance – Can They Break Through?Gold continues to trade in an upward trend, recovering strongly from recent lows. On the 4-hour chart, price is moving closer to a falling resistance trendline, which has acted as a major barrier in the past. This makes the upcoming resistance zone very important for short-term traders.
The next key resistance lies between $4250–$4265, where profit booking can be expected. This area has multiple technical confluences, and traders should monitor how price reacts here. A successful breakout and close above this zone could lead to an extended rally toward $4320–$4350.
However, if price faces rejection from this trendline, a short-term pullback toward the $4120–$4080 support zone would be normal and healthy for the trend. Despite the short-term caution, the overall market structure for Gold remains bullish as long as the price stays above support.
Disclaimer: This analysis is for educational purposes only and should not be taken as financial advice. Please do your own research or consult your financial advisor before investing.
Analysis By @TraderRahulPal | More analysis & educational content on my profile.
If you found this helpful, don’t forget to like and follow for regular updates.

ICICIPRULI - Buy - Trade setup#ICICI Prudential Life Insurance - Technical Analysis
| Price: 626.05 |
#Swing Trade Setup
Pattern: Price trading above EMA with EMA squeeze formation. RSI showing bullish momentum structure.
Technical Indicators:
1. Price trading above EMA - EMA Squeeze pattern forming
2. RSI consolidation - Moving above 50 level
3. RSI taking support on RSI MA line
4. Conservative entry - Buy above ₹635
Entry Strategy:
- Buy Above: 635.30
- Stop Loss (Swing): 608.93 (on candle close)
- Stop Loss (Investment): 532.40
Target Levels:
- Target 1: 662.40
- Target 2: 693.50
- Target 3: 727.30
- Grand Target 4: 789.50
Key Reference: Previous ATH Breakout zone around 727
#Technical Outlook
The stock is consolidating near the 626 level after a significant rally from 532. The EMA squeeze and RSI structure suggest potential for upside continuation. A breakout above 635 could trigger movement toward the 662 - 693 zone initially, with extended targets at 727 - 789.
Risk-Reward: Favorable setup with well-defined stop losses for both swing trading and long-term investment approaches.
⚠️ DISCLAIMER
This is NOT investment advice. This analysis is provided for educational and informational purposes only. Stock trading and investing involve substantial risk of loss. Technical patterns and indicators do not guarantee future price movements. Past performance is not indicative of future results.
Always conduct your own thorough research and consult with a SEBI-registered financial advisor or qualified professional before making any investment decisions. The author/analyst assumes no responsibility or liability for any financial losses or damages incurred from using this information.
**Trade at your own risk.**
#ICICIPrudential #StockMarket #NSE #TechnicalAnalysis #SwingTrading #IndianStockMarket #Trading #FinTwit #Insurance #StocksToWatch #TradingView #ChartAnalysis #MarketUpdate #InvestorEducation

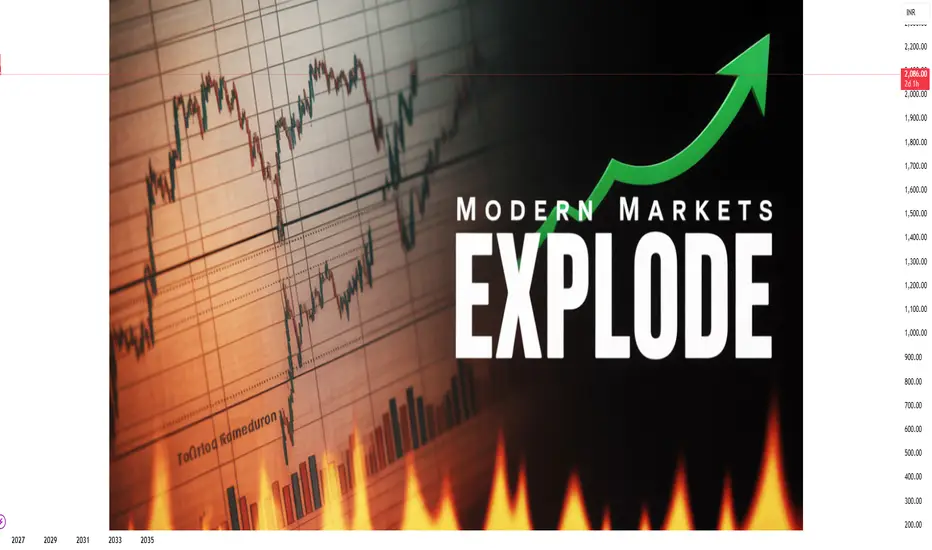
The Modern Market Explosion: Dynamics, Drivers, and Implications1. Technological Revolution as a Catalyst
At the heart of the modern market explosion lies the technological revolution. Advancements in computing power, cloud technologies, artificial intelligence (AI), blockchain, and high-frequency trading have reshaped how markets operate. Trading that once took hours or days can now occur in milliseconds, allowing for near-instantaneous execution of orders. Automated trading algorithms can respond to micro-movements in the market, amplifying both liquidity and volatility.
The rise of fintech platforms has democratized access to markets, allowing retail investors to participate in arenas that were once dominated by institutional players. Mobile trading apps, digital wallets, and online brokerage platforms have exponentially increased the volume of participants in stock, cryptocurrency, and derivatives markets. This surge in participation has not only inflated trading volumes but has also created price swings driven by social sentiment, speculation, and viral trends—phenomena particularly visible in meme stocks and digital asset markets.
2. Globalization and Interconnected Markets
Globalization has intensified market interdependence. Modern markets are no longer isolated; a major economic event in one country reverberates across the world in real-time. Supply chain disruptions in East Asia, geopolitical conflicts in Europe, or policy shifts in the United States can instantaneously affect stock indices, commodity prices, and currency valuations across multiple continents.
Emerging markets have become key drivers of this explosive growth. Economies in Asia, Africa, and Latin America, leveraging technology and international trade, are attracting massive foreign investments. Capital flows across borders are faster and larger than ever, contributing to dynamic asset reallocation and, occasionally, market bubbles. Globalization has also intensified competition, forcing companies to innovate rapidly and adopt digital solutions to remain relevant, further energizing sectors like technology, e-commerce, and renewable energy.
3. Investor Psychology and Behavioral Shifts
The modern market explosion is heavily influenced by investor psychology. Behavioral finance has highlighted that markets are not purely rational; human emotions, herd behavior, and cognitive biases play critical roles. Social media platforms, online forums, and news aggregators amplify information and, in some cases, misinformation. Platforms like Reddit, Twitter, and Telegram have empowered collective action among retail investors, creating sudden surges in trading activity and price volatility.
This phenomenon has been vividly observed in meme stocks, cryptocurrencies, and trending tech shares. Fear of missing out (FOMO), speculative mania, and rapid shifts in sentiment contribute to market explosions, often decoupling asset prices from traditional valuation metrics. The combination of retail-driven momentum and institutional responses forms a feedback loop that accelerates price movements, creating both opportunities and risks.
4. Monetary Policies and Liquidity Surges
Central banks worldwide have played a significant role in the explosive growth of modern markets. In response to financial crises, pandemics, and recessions, central banks have implemented unprecedented monetary interventions, including near-zero interest rates, quantitative easing, and direct market support. These policies have flooded global markets with liquidity, encouraging borrowing, investment, and risk-taking.
High liquidity environments often push investors toward higher-yielding assets such as equities, real estate, and alternative investments, inflating prices. This influx of capital has amplified market bubbles, accelerated technological sector valuations, and supported the rapid rise of digital assets. However, this liquidity-driven expansion is fragile, sensitive to interest rate adjustments, inflationary pressures, and geopolitical uncertainties, making modern markets highly reactive to policy signals.
5. Sectoral Shifts and Innovation Drivers
Certain sectors have emerged as key drivers of the modern market explosion. Technology, artificial intelligence, biotechnology, renewable energy, and electric vehicles are attracting enormous capital inflows due to their disruptive potential. Startups in these sectors are achieving valuations in record times, often reaching “unicorn” status within a few years of founding.
Digital transformation across traditional industries—finance, healthcare, logistics, and manufacturing—has also created new market opportunities. Cloud computing, data analytics, Internet of Things (IoT), and AI-driven automation have increased productivity and generated investor optimism. These sectors often experience rapid price appreciation as innovation expectations sometimes outpace earnings, further contributing to market acceleration and speculative excitement.
6. Cryptocurrency and Decentralized Finance (DeFi)
Cryptocurrencies and decentralized finance platforms have added a new dimension to the modern market explosion. Blockchain technology enables digital assets to exist outside traditional banking systems, creating entirely new marketplaces for investment and exchange. Bitcoin, Ethereum, and other cryptocurrencies have experienced explosive growth, driven by both institutional adoption and retail enthusiasm.
DeFi platforms allow peer-to-peer lending, borrowing, and trading without intermediaries, challenging traditional financial systems. These innovations have increased market accessibility, liquidity, and speculative potential, creating a high-risk, high-reward environment. Cryptocurrencies also respond to global macroeconomic trends, regulatory developments, and social media-driven hype, contributing to sudden market surges and declines.
7. Risks, Volatility, and Market Sustainability
While the modern market explosion presents enormous opportunities, it is accompanied by heightened risks. Volatility has intensified, with sudden price swings becoming commonplace. The interconnected nature of global markets means that crises can propagate rapidly, as seen during events like the 2008 financial crisis and the COVID-19 pandemic.
Overvaluation of certain sectors, speculative bubbles, geopolitical tensions, cyber threats, and policy missteps are persistent risks. Investors must balance the allure of rapid gains with disciplined risk management. Market regulation, transparency, and investor education remain critical to sustaining long-term growth while mitigating systemic risks.
8. Implications for Businesses, Investors, and Society
The explosion of modern markets has broad implications beyond finance. Businesses face pressure to innovate, scale quickly, and adopt digital solutions. Investors encounter both unprecedented opportunities and challenges in portfolio diversification, risk management, and information analysis. Society, in turn, experiences economic benefits through job creation, technological advancement, and increased access to capital, but also faces risks related to inequality, market speculation, and financial instability.
Financial literacy and technological understanding have become essential for navigating the modern market. Stakeholders who leverage data analytics, AI tools, and global market intelligence gain a strategic advantage, while those who fail to adapt risk being left behind.
9. Conclusion
The modern market explosion is a multifaceted phenomenon driven by technology, globalization, investor behavior, policy interventions, and sectoral innovation. It is characterized by rapid growth, high liquidity, speculative surges, and heightened volatility. While it offers remarkable opportunities for wealth creation, entrepreneurship, and global economic integration, it also demands sophisticated risk management, regulatory oversight, and informed participation.
Understanding the interplay between technology, capital flows, investor psychology, and policy dynamics is crucial for anyone seeking to navigate these markets successfully. The modern market is not merely expanding; it is accelerating, transforming, and redefining the global economic landscape at an unprecedented pace. Investors, businesses, and policymakers must embrace agility, knowledge, and strategic foresight to harness its potential while mitigating its inherent risks.
Bitcoin Monthly Support Test — Next Target $58,419 ?Key support sits at $81,933. A clean break and close below this zone could expose Bitcoin to a deeper retracement toward the next major support around $58,419.
However, $81,933 is also a strong monthly support level, so the market’s reaction here is critical.
Keep an eye on whether this level holds or fails — it will likely dictate the next major move.
Share your view in the comments: Do you think BTC will defend this monthly support, or are we heading lower?

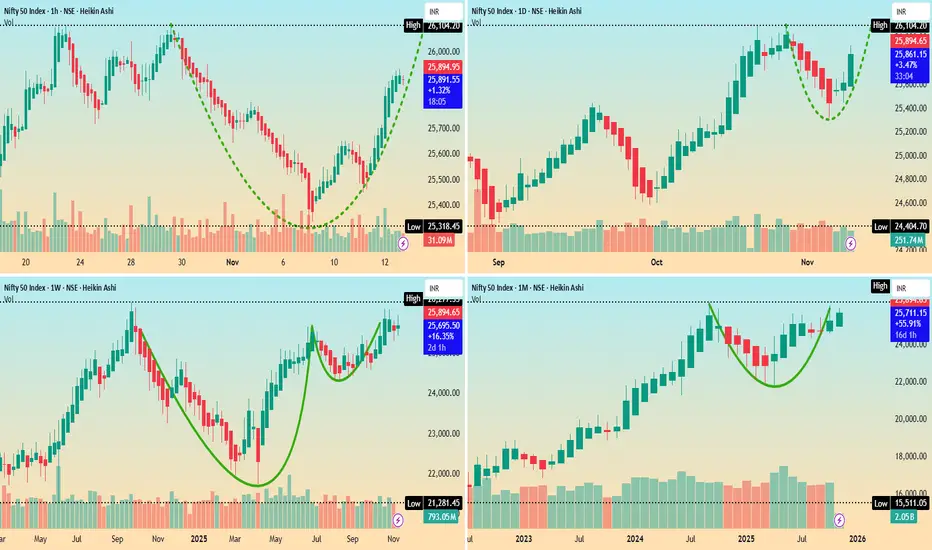
Nifty 50 Index spot 25890 Multi Timeframe viewsNifty 50 Index spot 25890 Multi Timeframe views
Major Timeframes showing Bullish Chart view by Hourly, Daily, Weekly and Monthly, so hope for the best to happen 🤞🏼😊
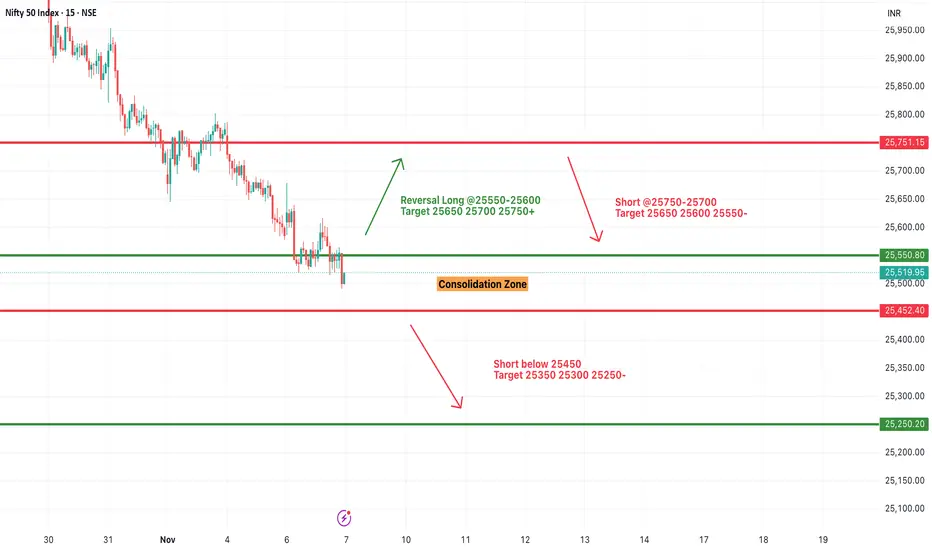
#NIFTY Intraday Support and Resistance Levels - 07/11/2025Nifty is likely to open with a gap down near the 25,450 zone, reflecting continued weakness and bearish sentiment in the market. The index remains under selling pressure, trading below key resistance levels, which suggests that bears are still in control in the short term.
If Nifty sustains below 25,450, it may extend the decline toward 25,350, 25,300, and 25,250, where a temporary pullback could occur. A breakdown below 25,250 will further intensify weakness, opening the way for deeper targets around 25,150–25,100.
On the upside, immediate resistance lies near 25,550–25,600. A sustained move above this level could trigger a short-covering rally toward 25,650 and 25,750, but the broader trend will remain bearish unless the index reclaims 25,750 decisively.
Overall, with a gap down opening near 25,450, the sentiment is expected to remain negative to range-bound. Traders should watch for a break below 25,450 for continuation trades on the downside and consider a reversal only if Nifty manages to hold above 25,550 with strong momentum. Maintaining strict stop losses is advised due to potential volatility in the early session.
Gold Declines as Sellers Dominate the MarketGold is undergoing a controlled correction phase after an extended period of sustained gains. Market behavior over recent sessions reflects a shift from expansion to contraction as liquidity flow decreases and momentum weakens across key time horizons.
The previous upward cycle attracted substantial speculative interest, but current market dynamics suggest profit-taking by institutional participants and reduced accumulation from large holders. The recent structural shift confirms that sentiment has turned defensive, aligning with global market caution amid evolving economic conditions.
Despite short-term consolidation, the broader setup indicates that gold remains sensitive to global financial stability concerns and policy signals. Market participants are now waiting for clarity on upcoming economic data and interest rate outlooks, which could determine whether the correction deepens or transitions into a new accumulation phase.
In the near term, volatility is expected to remain elevated as investors reassess exposure levels. The prevailing outlook maintains a cautious bias, with traders closely observing how price reacts to continued shifts in liquidity and macro sentiment. Sustained capital outflow from hedge assets could pressure gold further, while renewed demand for safety could limit downside potential in the medium term.

Bitcoin Market Preparing for Upside MoveBitcoin is currently stabilizing after a sharp corrective phase.The market is showing early signs of demand re-entry near the liquidity base,indicating potential exhaustion of selling pressure.Recent structural reactions hint that buyers are preparing to reclaim control,which could initiate a short-term recovery leg toward the mid-range inefficiency zone.If momentum sustains,Bitcoin may expand higher,confirming a potential buy phase aligned with institutional accumulation signals.Overall,the outlook remains cautiously bullish as long as the market holds above its newly formed demand area.

Solana Ready for Bullish ContinuationSolana demonstrates a constructive market posture with evidence of renewed accumulation following its recent corrective phase.Price activity indicates that buying momentum is gradually strengthening as liquidity continues to shift from weak hands into strategic positioning.The market structure shows improving stability,with compression patterns hinting at an impending expansion cycle.Sustained absorption near recent lows underscores growing institutional participation,reinforcing the probability of continued upward repricing.Trading volume remains consistent,reflecting controlled demand rather than speculative inflow.The overall market tone supports a constructive bias,with expectations aligning toward a progressive recovery phase and potential continuation of the broader bullish trajectory.

XAUUSD Builds Upward PressureGold continues to trade within a strong upward trajectory,showing consistent momentum and firm buyer engagement.The market structure indicates ongoing accumulation,with price maintaining stability after minor corrective movements.Buy-side activity remains dominant,reflecting confidence among institutional participants as the metal sustains its trend within an orderly channel.While short-term pullbacks may occur for liquidity rebalancing,the broader outlook remains decisively bullish as long as momentum persists and demand continues to support higher valuations.

XAUUSD | Gold Holds Firm as Buyers Dominate the MarketGold continues to demonstrate a strong and orderly bullish structure, with momentum sustained by a combination of market confidence and macroeconomic positioning. The metal’s consistent upward drive reflects ongoing demand for safety amid lingering inflationary concerns and uncertainty surrounding global economic recovery. Institutional accumulation remains visible, suggesting that investors are positioning ahead of potential policy adjustments and currency fluctuations.
The recent moderation phase appears to be a controlled pause rather than weakness, indicating that buyers are maintaining control while the market digests prior gains. Should current stability in yields persist and geopolitical tensions remain elevated, gold could extend its advance in the medium term, reaffirming its role as a key hedge within diversified portfolios.

Solana Price Forecast | SOLUSDT Market OutlookSOLUSDT has completed a strong upward cycle and is now unwinding through a structured retracement. This phase is not showing disorderly selling but rather a controlled reset, where liquidity is being cleared to prepare for the next expansion.
The chart reflects a market that is cycling through accumulation, breakout, and pullback phases with consistency. Current downside movement is shaping a foundation zone that could serve as the springboard for renewed upward momentum.
Overall, the asset is displaying a constructive trajectory: corrections are functioning as fuel rather than weakness, pointing toward continuation of its broader growth path once this reset stabilizes.

Gold holds firm at 3,63x | Caution for Friday session🟡 XAU/USD – 19/09 | Captain Vincent ⚓
🔎 Captain’s Log – Market Context
FED : Probability of a 25bps cut in October is 91.9%, while holding rates is only 8.9% → almost certain FED will continue easing.
US News : No major data today, market remains quiet.
Gold : Sharp moves in Asia session, but support 3,632 – 3,630 held strong.
Yesterday’s Buy at 3,62x delivered 200 pips , confirming this zone as a “fortress” support.
Note : Today is Friday – end of the week session, unexpected volatility may occur before the weekly close → strict risk management required.
⏩ Captain’s Summary : Gold remains bullish, but caution is needed with end-of-week swings. Golden Harbor around 3,63x continues to be a solid anchor.
📈 Captain’s Chart – Technical Analysis
Storm Breaker (Resistance / Sell Zone)
3,661 – 3,663 (intraday resistance)
3,683 – 3,685 (strong OB, likely profit-taking zone)
Golden Harbor (Support / Buy Zone)
3,602 – 3,605 (FVG zone – deeper support if 3,63x breaks, waiting for strong demand)
Market Structure
After rebounding from 3,62x, Gold consolidated around 3,65x – 3,66x.
Main trend stays bullish, but needs support retest to confirm buyers’ strength.
3,66x is the pivot barrier:
• Breakout → targets 3,68x
• Rejection → retest 3,64x – 3,62x
🎯 Captain’s Map – Trade Plan
✅ Buy (priority)
Entry: 3,602 – 3,605
SL: 3,588
TP: 3,629 – 3,661 – 3,683
⚡ Sell (short scalp)
Entry: 3,683 – 3,685
SL: 3,695
TP: 3,665 – 3,645
⚓ Captain’s Note
“The 3,63x fortress continues to hold, keeping the Golden ship safe on its northward journey. Golden Harbor 🏝️ (3,602 – 3,605) remains the main dock for sailors to gather strength. Storm Breaker 🌊 (3,683 – 3,685) may raise waves, suitable for short Quick Boarding 🚤 . Today is Friday – the sea can shift unexpectedly, so keep the sails full but hands steady on the helm.”

FED slows down: Cuts 25bps, gold stays flat🟡 XAU/USD – 18/09 | Captain Vincent ⚓
🔎 Captain’s Log – News Context
FED : Cut rates by 25bps as expected, hinted at 2 more cuts this year → initially supported Gold to rebound around 3,65x.
Powell turned hawkish :
• “No need to move quickly on rate cuts.”
• “Today’s cut is mainly risk-management.”
This message signaled that the FED is not fully opening the easing door → Gold fluctuated and stalled its upside momentum.
Tonight: Awaiting Jobless Claims & Philly Fed for more clarity on the FED’s path.
⏩ Captain’s Summary
Gold is supported by the rate cut, but Powell’s “braking” caused volatility.
Zone 3,663 – 3,665 has become the pivot support to determine the next move.
📈 Captain’s Chart – Technical Analysis
Storm Breaker (Resistance / Sell Zone)
3,684 – 3,686 (strong OB)
3,717 – 3,719 (ATH Zone – very strong, likely heavy selling)
Golden Harbor (Support / Buy Zone)
Pivot Dock: 3,663 – 3,665 (new pivot support)
Main Harbor: 3,629 – 3,630 (BoS confluence & old sideway)
Market Structure
After breakout and profit-taking, Gold returned to test support.
3,663 – 3,665 : pivot support.
• If it holds → rebound to 3,684 – 3,717.
• If it breaks → deeper correction to 3,629.
🎯 Captain’s Map – Trade Plan
✅ Buy (priority)
Buy Zone 1
Entry: 3,663 – 3,666
SL: 3,655
TP: 3,684 – 3,717
Buy Zone 2
Entry: 3,629 – 3,630
SL: 3,618
TP: 3,663 – 3,684 – 3,717
⚡ Sell (only at resistance)
Sell Zone OB
Entry: 3,684 – 3,686
SL: 3,695
TP: 3,665 – 3,645
Sell Zone ATH NEW
Entry: 3,717 – 3,719
SL: 3,727
TP: 3,706 – 3,690 – 3,675
⚓ Captain’s Note
“The Golden sails caught wind as the FED cut rates, but Powell’s headwind slowed the advance. Golden Harbor 🏝️ (3,663 – 3,629) is the pivot dock to decide the next course. If it holds, the ship may rebound to test Storm Breaker 🌊 (3,684 – 3,719) . If it breaks, the ship will retreat deeper to gather strength. For now, Quick Boarding 🚤 should only be done at strong resistance, while the larger voyage still leans northward.”
