Why Maruti Share is FallingThe reason is Simple because Hournable Prime Minister of India Cut the Import Duty on BMW and Mercerdes for the benefit of #Poor People of India, hence Maruti Sales are Hevely impacted After all this reason Maruti Share is Fall.
MARUTI

MARUTI - Supply Zone Rejection💹 Maruti Suzuki India Ltd (NSE: MARUTI)
View: Supply Zone Rejection | Chart: Intraday
Market Context: Sellers in Control Near Overhead Zones
📊 Price Action
Maruti has seen a sharp sell-off from higher levels, followed by weak consolidation near the lows. Every recovery attempt is facing pressure, clearly indicating that supply is dominating the upside. The structure remains corrective, not impulsive.
🔍 Technical Analysis (Chart Readings)
Strong bearish candles from the top confirm institutional supply activation
Pullbacks are shallow and overlapping, showing lack of strong demand
Price is trading below major supply zones, keeping the trend capped
🎯 Key Levels (Chart Readings)
Immediate Resistances:
16664
16827
16951
Supports to Watch:
16377
16254
16090
🟥 Demand & Supply Zones (Chart Readings)
Supply Zone: 17155 – 17174
This zone marks the origin of the breakdown. Heavy selling emerged from this area, making it a high-probability rejection zone on any future retest.
Strong Supply Zone: 17016 – 17027
A structurally important zone where price failed multiple times. As long as the stock remains below this band, upside is likely to remain restricted.
🧠 STWP Trade Analysis
From an STWP lens, this is a classic supply-driven structure. Until price shows strength above the marked supply zones with volume expansion, rallies should be treated as pullbacks, not reversals. Smart money behaviour suggests distribution, not accumulation.
🔮 Final Outlook
Trend: Weak to Bearish
Momentum: Fading on pullbacks
Risk Zone: Near supply areas
Bias: Sell-side pressure dominates below supply
📌 Markets respect zones, not opinions. When price enters supply, probability shifts.
⚠️ Disclosure & Disclaimer
This post is for educational and informational purposes only. It is not investment advice. Markets involve risk. Always manage position size and consult a SEBI-registered advisor if needed.
🚀 Stay Calm. Stay Clean. Trade With Patience. Trade Smart | Learn Zones | Be Self-Reliant

Maruti - Compression Setup Near Resistance💹 Maruti Suzuki India Ltd (NSE: MARUTI)
Sector: Automobiles | CMP: 16187 | View: Compression Setup Near Resistance
STWP Support & Resistance – MARUTI
Resistances: 16264 | 16311 | 16426
Supports: 16102 | 16017 | 15940
While the above levels highlight the nearest technical markers, the chart shows that the broader resistance band between 16264–16426 is relatively weak, marked by shallow rejection wicks and limited seller follow-through, suggesting only mild supply overhead. On the downside, the support pockets around 16102–16017 and the deeper zone near 15940 appear structurally stronger, backed by prior accumulation and repeated stabilization attempts that show institutional interest absorbing dips. This configuration reflects a market in compression near resistance, where buyers are defending declines but have yet to demonstrate strong breakout conviction; sustained movement above 16264 may improve momentum, while failure to hold 16017 could shift short-term control back to sellers.
STWP Volume & Technical Setup – MARUTI
MARUTI continues to display a tightly coiled structure, reflecting clear price compression and controlled volatility as the stock trades within a contracting range after a series of higher-lows and overlapping candles. The volume profile remains within normal distribution, with no abnormal spikes, signalling that institutional participation has been steady but not aggressive. Momentum indicators show a mixed landscape — RSI stabilizing in the mid-zones, MACD maintaining a neutral-to-slightly positive crossover profile, and CCI oscillating around its mean — collectively suggesting that the stock is preparing for a decisive move rather than trending with strength. Compression metrics, such as narrow-body candles and tightening ranges, indicate that liquidity is positioning but not yet committed, while the BB bands remain moderately tightened, hinting at a potential volatility expansion trigger. Despite this consolidation, the broader structural undertone leans mildly bullish, supported by the trend strength seen in prior legs and the stock’s ability to hold above key support pockets even after intraday profit-booking phases. Overall, MARUTI’s setup resembles a pre-breakout equilibrium phase where buyers and sellers are evenly matched, and a clean breakout or breakdown candle will determine the next directional impulse.
STWP Summary View
Final Outlook: Momentum: Developing|Trend: Mildly Bullish|Risk: Moderate|Volume: Normal
The overall MARUTI derivatives landscape reflects a broadly bearish environment observed across intraday, short-term swing, volatility, buildup, ATM structure, strategy alignment, smart-money behaviour and straddle characteristics, where the prevailing trend remains down and sentiment stays negative, with an STWP Edge Score of 6.4/10 indicating a moderate yet structured setup that requires disciplined sizing rather than aggressive positioning. The frequently referenced strike throughout the analysis is the 16200 level, where the PUT (delta -0.46) recorded an LTP of 229.15 after a 19.63% gain, supported by volume expansion of 15.5% to 6363 contracts and a mild IV rise to 16.2%, while open interest dropped sharply by 26.5% (-24,450 contracts), creating a short-covering signature that often reflects trapped participants exiting positions as prices shift. These dynamics form part of a broader mixed-to-moderate structural zone where the option behaves closer to futures because of its delta profile, giving smoother directional sensitivity with controlled convexity. The intraday and swing illustrations revolve around defined levels such as the entry around 229.15, a protective threshold at 194.78 and reference targets near 280.71 and 297.89, used purely to demonstrate risk structuring and reward modelling practices in an academic context. Volatility sits in a balanced band, with average IV near 15.65%, a high of 18.69% at the 15000 PUT and a low of 13.97% at the 16000 CALL, creating an environment where different option structures behave differently depending on how implied volatility evolves. The buildup distribution further reinforces the bearish tilt seen in derivatives behaviour: the CALL side held moderate short build-up and long unwinding, whereas the PUT side displayed strong short-covering activity supported by minor long additions, highlighting pressure points and exhaustion pockets in the flow. The ATM strike at 16200 acts as the central sensitivity zone with the CE at 253.75 (delta 0.55, IV 14.31%) and the PE at 229.15 (delta -0.46, IV 16.22%), helping market participants understand how gamma, delta shifts and volatility behaviour influence intraday reactions. Broader strategy illustration shows how trend strength, call-side dominance in flows, a mid-range IV environment and a PCR of 0.66 combine to form a generalized bearish framework, while the Smart Money Heat assessment indicates about 36% bearish momentum derived from long build-up, short build-up, short-covering and unwinding activity across liquid strikes; liquidity metrics such as a median OI of 88750 and a median volume of 3380 provide context for depth and participation. The straddle analysis at the 16200 strike shows a combined premium of 2.98% against an expected move of 3.83%, an average IV band of 15.27%, a near-flat net delta of 0.09, a symbol-level PCR of 0.78 and a max pain level anchored at 16200, illustrating how volatility expectations, premium richness, delta neutrality and positioning pressures interact. Collectively, these elements present a comprehensive educational study of how trend, volatility, open interest behaviour, buildup distribution, gamma-zone dynamics, straddle structure and flow-based sentiment can be read together as part of an institutional-style analytical exercise, without forming any investment advice or trade recommendation of any kind.
⚠️ STWP Legal Disclaimer
This document is strictly for educational and informational purposes. All examples, charts, levels, and option structures discussed are illustrative and are not intended as buy, sell, or hold recommendations. STWP does not provide investment advice, trading tips, signals, or personalized financial guidance of any kind, nor is it a SEBI-registered intermediary or research analyst. The analyses, illustrations, and risk–reward structures included here are generic in nature and based on publicly available data and observed market behaviour, which may change without notice. Financial markets involve significant risk; derivatives in particular carry the potential for substantial losses. Option premiums, implied volatility, open interest, delta, and other market variables can fluctuate rapidly and unpredictably.
Readers are solely responsible for their trading decisions, capital management, and risk assessment. Before making any investment or trading decision, please consult a SEBI-registered investment advisor. STWP, its representatives, and affiliates shall not be liable for any direct or indirect loss arising from the use of this material. Historical patterns or past market behaviour do not guarantee future outcomes, nor should any part of this document be interpreted as a promise of performance, accuracy, or returns.
Position Status: No active position in this instrument at the time of analysis.
Data Source: TradingView & NSE India.
💬 Found this useful?
🔼 Boost this post to support structured learning
✍️ Share your thoughts or questions in the comments
🔁 Forward this to traders who value clean technical studies
👉 Follow for disciplined, structured, STWP-style analysis
🚀 Stay Calm. Stay Clean. Trade With Patience.
Trade Smart | Learn Zones | Be Self-Reliant 📊

Maruti SuzukiMaruti might touch around 16,250 tomorrow but beyond that a breakout is not expected much, as there has been a drop in the volume.

Maruti Hits the Brakes ?🚗 Maruti Hits the Brakes: Bearish Engulfing Signals a Possible Correction Ahead!
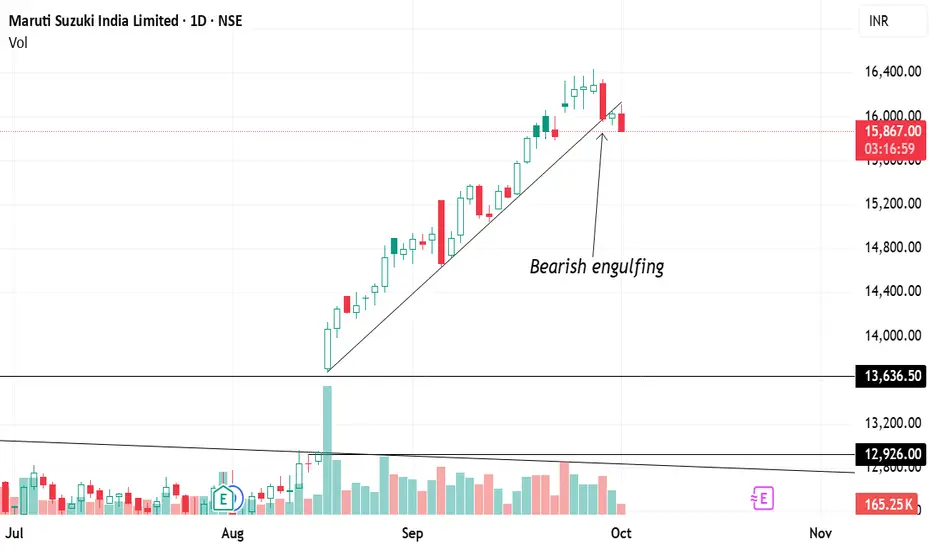
Maruti Suzuki has been one of the strongest performers in the market since August 2025, rallying nearly 35% in just two months 📈. The uptrend was further boosted after the GST cut reform, which led to a huge gap-up opening. From there, the stock followed a clear trendline support, steadily moving higher week after week.
But now, the charts are flashing caution signals ⚠️:
✨ 1. Daily Chart View
On 29th September 2025, Maruti formed a bearish engulfing candle.
This isn’t just an ordinary candle — it engulfed the previous four trading sessions’ candles, showing strong selling pressure.
Such a large engulfing candle often signals a trend reversal, especially after a sharp rally.
📅 2. Weekly Chart View (Bigger Picture)
For the past 8 straight weeks, Maruti delivered green candles — a remarkable bullish run.
This week, the weekly chart is also showing the formation of a bearish engulfing pattern (although two days remain for confirmation).
If this pattern holds at the close, it would indicate that momentum has shifted from buyers to sellers.
📌 3. Trendline Break
The uptrend since August was guided by a well-respected trendline.
This trendline now appears to be broken, which adds further confirmation that the bullish momentum has weakened.
⚖️ 4. What This Means
🔻 Bearish Signal: A strong bearish engulfing candle after a steep rally is a textbook sign of a potential correction.
⛔ Trendline Broken: Losing the trendline suggests the uptrend structure is failing.
📉 Correction Likely: After a 35% run-up, profit booking and a healthy pullback seem due.
👉 Summary
Maruti’s spectacular run since August may have finally hit a wall. With a daily bearish engulfing candle, a trendline breakdown, and the weekly bearish engulfing pattern forming, the probability of a correction is high.
Disclaimer:- I have a short position on the Stock.
#Nifty #StockMarket #stockmarketsindia #SachinCharts #stockmarketcrash #Epic202426 #SachinStockChart #Maruti #Auto #SachinStockAnalysis
Bearish Engulfing in Maruti: Bounce or Selloff Ahead ?What happened today
The daily candle is a strong bearish engulfing—today’s real body fully engulfed yesterday’s real body. That shows aggressive supply stepping in and a potential short-term reversal after the prior advance.
Today’s high ₹15,250 is your invalidation: as long as the price stays below this, the bearish setup remains active.
What confirms the signal tomorrow
A follow-through (confirmation) candle that closes below today’s low and ideally on above-average volume.
Bonus confirmation if intraday retests of the engulfing body’s mid-point get sold into (upper wicks, weak closes).
Downside roadmap if confirmed
A confirmed breakdown increases odds of a slide toward ₹13,600 (prior demand/congestion) and then ₹13,000 (major psychological level / deeper demand).
Momentum often accelerates after an engulfing + follow-through combo; expect lower highs, weak bounces, and moving-average rollovers on shorter timeframes.
Risk management / trade plan (discipline first)
Trigger: Consider shorts only after confirmation—i.e., sustained trade below today’s low; avoid pre-empting if price gaps up and holds.
Stop: Above ₹15,250 (setup invalidation) or above the confirmation candle’s high if that’s tighter and still logical.
Targets: T1 ₹13,600, T2 ₹13,000; trail stops on lower highs to lock gains.
Avoid traps: A close back inside/above half of today’s body without follow-through weakens the signal; a decisive close above ₹15,250 invalidates the view.
Bottom line
Bearish engulfing sets the stage; a confirmation candle tomorrow is key. If it comes, ₹13,600 → ₹13,000 opens up. If not—and especially if ₹15,250 is reclaimed—the bearish thesis is off.

Maruti’s Bearish Engulfing – Will We Get Confirmation?Maruti has formed a bearish engulfing candle on the daily chart today, which is a strong reversal signal when it appears after a rally. This pattern suggests that sellers have overpowered buyers.
⚖️ Importance of Confirmation
A bearish engulfing pattern requires a confirmation candle (a red follow-through candle on the next day) to validate the setup.
We’ve seen this before: on 4th September, Maruti also formed a bearish engulfing, but on 5th September, the follow-up candle was missing, which invalidated the bearish setup at that time.
Hence, waiting for tomorrow’s confirmation is crucial to avoid a false signal.
✅ Key Levels & Targets
If we get the confirmation candle tomorrow, then downside levels of ₹14,600 → ₹13,600 → ₹12,900 could unfold in the short to medium term.
On the flip side, if no confirmation comes, the pattern may fail just like in early September, and the stock could remain range-bound or resume upward momentum.

Options Watchlist — An Educational View of OI & Price Action________________________________________
📊 Options OI Trade Outlook — Bullish Setups Only
“This analysis is shared purely for educational purposes and market awareness — not a trading recommendation.”
(Educational Purpose | Not Financial Advice | SEBI Compliant)
Hello Traders 👋,
Here are 5 Bullish option setups based on today’s OI + Price Action + IV + Greeks study.
This is strictly for learning and educational purposes.
________________________________________
🟢 1. MARUTI 14800 CALL
LTP: 383.95
Sentiment: Bullish | Trend: Up | Strength: 5/5 (Strong)
IV: 20.5 | Delta: 0.53 | Theta: -8.64 | Vega: 17.6
Buildup: Long Build-up
Why?
This strike shows a Long Build-up with price rising 10.1% and OI up 38.2%, a textbook bullish confirmation.
Though volume dipped (-25.7%), IV rose 8.4% supporting premium expansion. Delta 0.53 signals strong ITM probability.
________________________________________
🟢 2. MARUTI 14700 CALL
LTP: 436.15
Sentiment: Bullish | Trend: Up | Strength: 5/5 (Strong)
IV: 20.5 | Delta: 0.56 | Theta: -8.66 | Vega: 17.4
Buildup: Long Build-up
Why?
14700 CE shows a Long Build-up with price up 9.8% and OI up 15.7%, confirming bullish sentiment.
Volume is lower (-33.5%), but IV rising 9.2% supports premiums. Delta 0.56 shows strong ITM odds.
________________________________________
🟢 3. ADANIENT 2300 CALL
LTP: 70.15
Sentiment: Bullish | Trend: Up | Strength: 5/5 (Strong)
IV: 27.6 | Delta: 0.52 | Theta: -2.35 | Vega: 2.7
Buildup: Long Build-up
Why?
2300 CE has a Long Build-up with price up 4.4% and OI soaring 81%, backed by a 219% volume surge.
IV rising 5.5% confirms premium expansion. Strong participation makes this a convincing bullish setup.
________________________________________
🟢 4. TITAN 3650 CALL
LTP: 77.4
Sentiment: Bullish | Trend: Up | Strength: 5/5 (Strong)
IV: 16.6 | Delta: 0.53 | Theta: -2.13 | Vega: 4.3
Buildup: Long Build-up
Why?
3650 CE shows a Long Build-up, with price rising 22.2% and OI up 46.2%, supported by strong volume (+89%).
IV is moderate at 16.6, and Delta at 0.53 signals strong ITM chances.
________________________________________
🟢 5. POLYCAB 7200 CALL
LTP: 184
Sentiment: Bullish | Trend: Up | Strength: 5/5 (Strong)
IV: 24.3 | Delta: 0.51 | Theta: -6.32 | Vega: 8.5
Buildup: Long Build-up
Why?
7200 CE has a powerful Long Build-up, with price up 5.8% and OI surging 364%, supported by a massive 1552% volume jump.
IV at 24.3 is stable but rising, confirming strength.
________________________________________
⚠️ Disclaimer – Please Read Carefully
The information shared here is meant purely for learning and awareness.
It is not a buy or sell recommendation and should not be taken as investment advice.
📌 I am not a SEBI-registered investment advisor.
📌 All views expressed are based on personal study, chart patterns, and publicly available data.
📌 Trading — whether in stocks or options — carries risk. Markets can move unexpectedly, and losses can exceed capital.
📌 Past setups do not guarantee future outcomes.
👉 Beginners: use this to learn market behavior, practice with paper trades before risking money.
👉 Experienced traders: apply your own risk management, sizing, and strategy filters.
👉 Always consult a SEBI-registered financial advisor before real trades.
By engaging with this content, you acknowledge full responsibility for your own trading and investments.
________________________________________
💬 Found this useful?
🔼 Boost this post to help more traders learn.
✍️ Share your thoughts/setups in comments — let’s grow together.
🔁 Share with fellow traders & learners.
👉 “Follow for more clean, structured breakdowns with discipline at the core.”
🚀 Stay Calm. Stay Clean. Trade With Patience.
Trade Smart | Learn Zones | Be Self-Reliant 📊
________________________________________
MARUTI OPTIONS TRADE SETUP📊 MARUTI OPTIONS TRADE SETUP – 12 Aug 2025
MARUTI is currently trading near ₹12,840, and the overall market mood looks bullish. We are seeing strong buying interest in call options from the 12,800 strike all the way up to 13,500, which means traders are expecting higher prices ahead. On the other hand, put option writers are active between 12,500 and 12,900, which suggests that they believe MARUTI will not fall below these levels anytime soon. The recent short covering at 12,700 CE (call option) along with fresh long positions above the spot price is adding fuel to the upside momentum. Volatility is in a low to moderate range (IV 13–17%), making it a good environment for debit strategies where you pay a premium for a defined-risk trade. For this setup, a combination of bullish directional positions (for momentum) and limited-risk spreads (to control risk) can work well, especially for traders who want to capture upside without taking unlimited exposure.
Bullish Directional Trade –13,000 CE
This trade idea is based on a clear sign of bullish momentum in the market. The 13,000 Call Option has shown a strong long build-up, with open interest (OI) increasing by 39% – meaning more traders are taking fresh long positions, expecting prices to move higher. We also see active call buying not just at 13,000 but also at the 12,900 and 13,200 strike prices, which suggests strong optimism in this price zone. The Delta value of 0.44 means the option moves moderately with the underlying index – giving good upside potential without taking extreme risk. Plus, with Implied Volatility (IV) at just 14.18%, the option is relatively cheap considering the strong upward momentum. In simple terms – the data supports a bullish view, the cost is reasonable, and the trade offers a balanced mix of profit potential and risk control.
Bullish Spread Trade
This Bull Call Spread is a smart bullish strategy that helps you participate in an upward move while keeping your cost and risk under control. In this trade, we buy the 13,000 CE at ₹98.50 and sell the 13,200 CE at ₹50.95. By selling the higher strike call, we reduce our upfront cost, bringing the net investment (net debit) down to just ₹47.55 per share, or ₹2,377.50 total for 50 lots. The maximum profit is capped at ₹7,122.50, which happens if the market closes at or above ₹13,200 on expiry. The maximum loss is limited to ₹2,377.50 — the amount we paid for the spread — making it much safer than buying a naked call. Our break-even level is ₹13,047.55, meaning we start making profits if the price goes above this level. The reason for choosing this structure is that the 13,200 CE also shows strong buying interest (long build-up), which increases the probability of the stock moving into our profitable zone. In short, it’s a low-cost, limited-risk, and favorable risk-reward setup for traders expecting a steady move upwards, without taking the full risk of outright call buying.
Aggressive Bullish Momentum
This trade is designed for situations where we expect strong upward momentum in MARUTI. We are using a Bull Call Spread, which means we buy a lower strike call option (₹12,900 CE @ ₹137) and simultaneously sell a higher strike call option (₹13,300 CE @ ₹37.60). This combination reduces the overall cost compared to buying a call outright, making the trade more affordable while still giving us good profit potential. Here, the total cost (net debit) comes to ₹99.40 per share, or ₹4,970 for 50 shares. If MARUTI moves up strongly toward the ₹13,300 level, our spread reaches its maximum profit potential of ₹15,030. The maximum we can lose is the initial ₹4,970 we invested, which is our fixed risk. The beauty of this setup is that we have a risk-to-reward ratio of about 1:3, meaning we’re risking ₹1 to potentially make ₹3. This is a strategic way to benefit from a strong bullish view while keeping risk capped — perfect for traders who want to balance aggressiveness with controlled exposure.
💡 Open Interest Insights:
From the current data, we can see that almost every At-The-Money (ATM) and Out-of-The-Money (OTM) Call Option up to the 13,500 strike is showing a Long Build-Up. This means traders are actively buying calls, which generally signals that they expect the market to move higher. At the 12,700 CE, we notice Short Covering — here, traders who had earlier sold calls are now buying them back, which usually happens when they believe the level will hold and the market may move up from there. This suggests that 12,700, which may have been a resistance earlier, could now act as a strong support. On the Put Option side, strikes between 12,500 and 12,900 are showing Short Build-Up, meaning traders are selling puts — a sign they expect these levels to hold and the market not to fall below them. Additionally, the fact that Implied Volatility (IV) is low while we are seeing a Long Build-Up means the market is showing steady bullish confidence without panic buying, which can support a sustained upward trend.
⚠️ Disclaimer – Please Read Carefully
The information shared here is meant purely for learning and awareness. It is not a buy or sell recommendation and should not be taken as investment advice. I am not a SEBI-registered investment advisor, and all views expressed are based on personal study, chart patterns, and publicly available market data.
Trading — whether in stocks or options — carries risk. Markets can move unexpectedly, and losses can sometimes be larger than the money you have invested. Past performance or past setups do not guarantee future results.
If you are a beginner, treat this as a guide to understand how the market works — practice on paper trades before risking real money. If you are an experienced trader, remember to assess your own risk, position sizing, and strategy suitability before entering any trade.
Data, prices, and analysis are based on information available as of 12 August 2025, and market conditions can change at any time. Always verify with reliable sources and consult a SEBI-registered financial advisor before making any real trading decision.
By reading, watching, or engaging with this content, you acknowledge that you take full responsibility for your own trades and investments.
💬 Found this useful?
Drop your thoughts, questions, or setups in the comments — let’s grow together!
🔁 Share this post with fellow traders and beginners to spread clean, structure-based learning.
✅ Follow simpletradewithpatience for beginner-friendly setups, price action insights, and disciplined trading content.
🚀 Stay Calm. Stay Clean. Trade With Patience.
Trade Smart | Learn Zones | Be Self-Reliant 📊

Maruti - Strong Option Chain Signals for Potential Trade Setups________________________________________________________________________________
MARUTI
Bias: Bullish Bias
Strong Long Build-Up across Call strikes (12700–13500)
Simultaneous Short Build-Up on Puts — classic bullish confirmation
________________________________________________________________________________
Best CE:
Strike: 12800
LTP: ₹138.3
OI: 5,14,100 (+78,350 | +17.98%)
Volume: 17,570
Build-Up: Long Build-Up
Interpretation: High OI addition + price rise = active bullish bets at 12800
________________________________________________________________________________
Best PE:
Strike: 12600
LTP: ₹159
OI: 1,05,700 (+76,600 | +263.23%)
Volume: 10,114
Build-Up: Short Build-Up
Interpretation: Strong put writing at 12600 suggests immediate support here
________________________________________________________________________________
Best Strategy:
Bull Call Spread or Naked Call Buy
(Buy 12800 CE, Sell 13200 or 13500 CE for risk-defined play)
- Directional bullish play
- Room to run till 13200–13500 zone based on fresh CE buildup
- Ideal if Spot sustains above 12600
________________________________________________________________________________
Why:
- Long Build-Up seen from 12700 CE to 13500 CE
- Spot = ₹12650, and 12600 PE has heavy Put writing → firm base
- Call Short Covering seen at 12500, 12600 → unwinding resistance
- IVs are rising on PEs, falling on CEs → supports bullish sentiment
- 12800 CE has highest Long Build-Up + Volume → key upside breakout strike
- Above 12800, next resistance zones visible around 13200–13500 based on CE action
________________________________________________________________________________
⚠️ Disclaimer (Please Read):
• This chart is shared for educational purposes only and is not investment advice.
• I am not a SEBI-registered advisor.
• The information provided here is based on personal market observation.
• No buy/sell recommendations are being made.
• Please do your own research or consult a registered financial advisor before making any trading decisions.
• Trading involves risk. Always use proper risk management.
________________________________________________________________________________
💬 Found this helpful?
Drop your thoughts or questions in the comments below ⬇️
🔁 Share this post with your trading community.
✅ Follow simpletradewithpatience for price-action backed technical setups.
🚀 Let’s trade with patience, logic, and clarity!
Be Self-Reliant | Trade with Patience | Learn with Logic
MARUTI – Strong Call Long Build-Up Dominance________________________________________
📈 MARUTI – Strong Call Long Build-Up Dominance | OI + Price Action Analysis
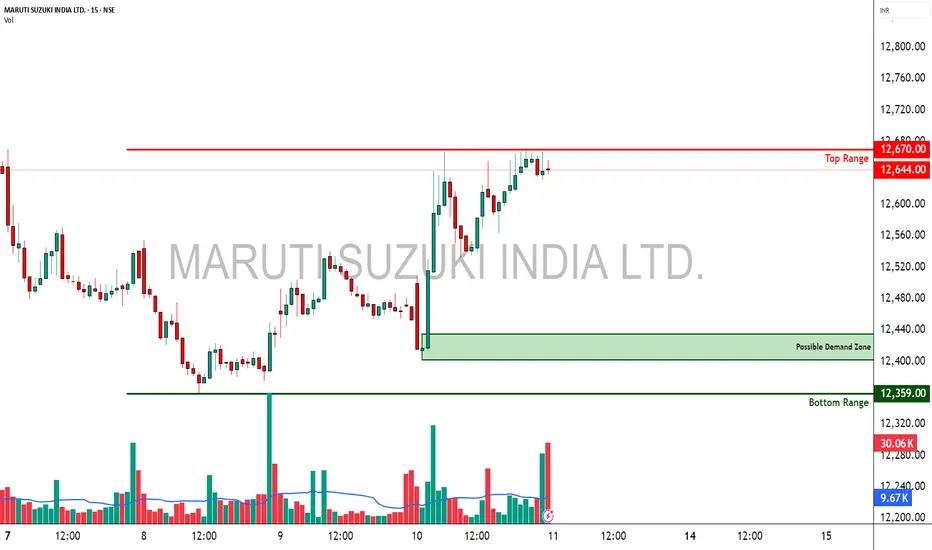
🕒 Chart Type: 15-Minute
📆 Date: July 3, 2025
________________________________________
🔍 What’s Catching Our Eye:
MARUTI closed around ₹12,752, and the entire Call side up to 13,500 is showing strong Long Build-Up, indicating aggressive bullish sentiment from option buyers. Meanwhile, the Put side is displaying Short Build-Up, further confirming bullish undertones. The price is steadily climbing, supported by strong institutional participation.
________________________________________
📌 What We’re Watching For:
If MARUTI sustains above ₹12,800, bullish continuation looks likely. Watch for follow-through toward ₹13,000 and 13,200+ if momentum persists. However, a drop below ₹12,500 could temporarily halt this upward bias.
________________________________________
📊 Volume Footprint:
Options activity is backed by strong volume — over 17k+ contracts at ₹13,000 CE and 15k+ at ₹12,800 CE — showing traders are betting big on further upside.
________________________________________
📈 Option Chain Highlights:
The OI data is highly supportive of the bulls:
• Calls (Long Build-Up):
o ₹13,000 CE: +104,450 OI | Price ↑ 8.6%
o ₹12,800 CE: +101,800 OI | Price ↑ 12.04%
o ₹12,900 CE: +95,650 OI | Price ↑ 10.07%
o Even OTM CE like ₹13,500 is active → trend belief is strong
• Puts:
o ₹12,800 PE & ₹12,700 PE both showing Short Build-Up, i.e., buyers believe downside is limited
Inference: Bulls are clearly in control, with both Call buyers active and Put sellers stepping in. This aligns with the broader bullish trend seen in the stock.
________________________________________
🔁 Trend Bias:
🟢 Bullish – Confirmed via price action and derivative sentiment
________________________________________
🧠 Trade Logic / Reasoning:
Strong accumulation is seen at every major Call level, from ATM to slightly OTM strikes. Short covering at ₹12,500 CE and long build-up in higher CE strikes confirms that the bulls are expecting a continuation rally. PE writers are unwinding or adding shorts – classic sign of strength.
________________________________________
📍 Important Levels to Mark:
🔺 Top Range (Resistance): ₹13,200 – ₹13,500
🔻 Bottom Range (Support): ₹12,500
________________________________________
🎯 Trade Plan (Educational Purpose Only):
✅ Best Buy (Equity): Above ₹12,800 with strong bullish candle
✅ Best Sell (Equity): Avoid unless ₹12,500 is broken
✅ Best CE to Long: ₹13,000 CE – Strongest long build-up with momentum
✅ Best PE to Long: Avoid PE long – sentiment doesn’t support bearish bets
🟢 Demand Zone: NA
🔴 Supply Zone: NA
⚠️ Invalidation Below:
Bullish bias is invalidated below ₹12,500 with high volume selling
________________________________________
⚠️ Disclaimer:
This analysis is for educational purposes only.
STWP is not a SEBI-registered advisor.
No buy/sell recommendations are made.
Please consult your financial advisor before trading.
STWP is not responsible for trading decisions based on this post.
________________________________________
💬 Did this help you spot the momentum early?
Drop your views in the comments ⬇️
🔁 Share this with traders watching MARUTI
✅ Follow STWP for clean price + option chain trades
🚀 Let’s educate more traders with patience and clarity!
________________________________________
MARUTI SUZUKI INDIA LTD. – INTRADAY ZONE ANALYSIS________________________________________________________________________________📈 MARUTI SUZUKI INDIA LTD. – INTRADAY ZONE ANALYSIS
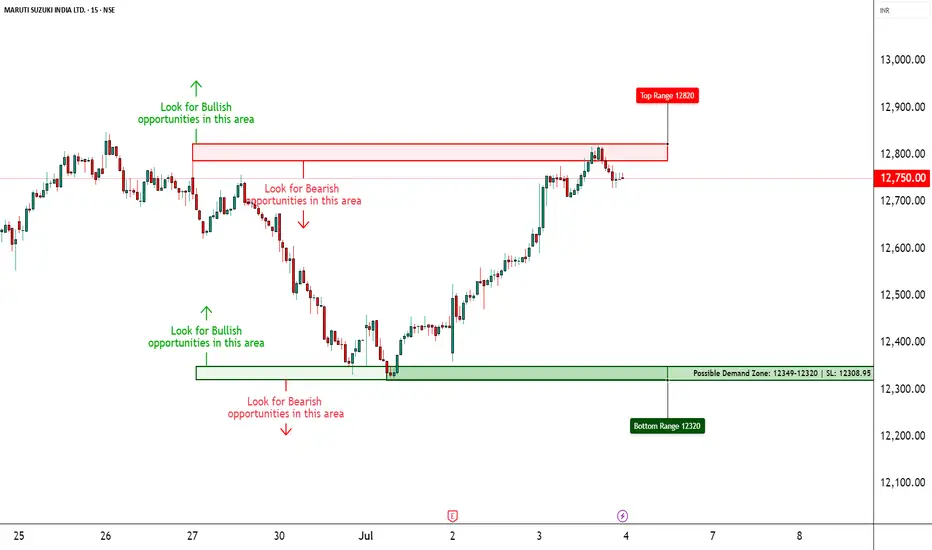
📆 Date: June 29, 2025 | ⏱ Timeframe: 15-Minute Chart
🔍 Educational Analysis for Learning Purposes Only
________________________________________________________________________________
📊 Zone Breakdown:
• 🔴 Top Range Resistance – 12,848
Marked in Red: This area has previously acted as a supply zone, where prices were rejected sharply. It is a potential region to watch for bearish reversal patterns, especially if price rises into this zone on weak volume or shows rejection candles like shooting star or bearish engulfing.
• 🟠 Neutral Zone (No Trade Zone) – Between ~12,720 to ~12,680
Marked in Orange: This is an indecision zone, where price has shown choppiness in the past. It is advisable to stay cautious and avoid trades here, as clear momentum is often missing in this range.
• 🟢 Support Zone – 12,617
Marked in Green: This is the demand zone, where price previously reversed on higher volume. It is a good region to observe for bullish candlestick confirmation patterns (e.g., hammer, bullish engulfing, morning star) on intraday timeframes.
________________________________________________________________________________
🔍 Candlestick Pattern Observation:
At the support zone (12,617), the most recent candle (the last one) shows a long lower wick with a bullish body, forming a bullish hammer-like structure.
• 🧠 Interpretation: This suggests possible buying interest at lower levels, especially since it coincides with volume spike, indicating potential reversal.
• 📌 However, confirmation from the next candle (closing above 12,670 with decent volume) would be required before validating it as a bullish reversal.
________________________________________________________________________________
⚙️ Educational Trade Idea (For Study Purpose Only):
▶️ Potential Long Trade Setup (Bullish Bias)
• Entry (Low-Risk Learner Zone): Around 12,670–12,675, only if next candle shows bullish strength
• Stop Loss: Below 12,617 (zone low) → e.g., 12,600
🧠 Reasoning:
• Price is reacting from a well-identified demand zone
• Volume spike confirms possible accumulation
• Candle with rejection wick hints at reversal interest
• Risk-reward approx. 1:2 or better depending on exit point
________________________________________________________________________________
⚠️ Disclaimer (SEBI-Compliant):
This analysis is shared strictly for educational and informational purposes. It does not constitute investment advice or a recommendation to trade. Viewers are encouraged to use this for learning technical chart reading and should consult a registered advisor before making any financial decisions.
STWP | Learn. Trade. Grow.
________________________________________________________________________________
What do you think about this setup?
Did you spot any other patterns or zones?
👇 Drop your comments below — let’s grow together!
________________________________________________________________________________

Maruti: Bullish triangle breakoutA clean triangle breakout for MARUTI. The upside target is 13620, and the stop is below the upper triangle line.
The entry validates once it gives a breakout and tests the upper line in the lower timeframe, not less than 4 hours.
RSI also has space for this price to meet the projected level.

LONG Maruti Suzuki India Ltd PositionalThis is only for educational purposes Please don't Try Intraday Or Margin Trading. If You want to try Only Trade in Delivery (CNC) Keep Some Patience, Wait for the target. Thank You.
#1. Target 8334
#2. Target 9921

MARUTI UPTREND MOVEMENT upto 13280SYMBOL MARUTI
TIMEFRAMe 15 min
ANALYSIS Uptrend MOVEMENT
There is upside breakout from the symmetrical triangle pattern and we can expect a target upto 13280.
DISCLAIMER: We are not SEBI registered. All the Ideas posted in this channel are solely for educational purposes." Risk taken is not more than 2% of the total capital

Maruti | Trendline Bull Breakout ⭕️ Swing Trading opportunity: Price Action Analysis Alert !!!⭕️
💡✍️Technical Reasons to trade or Strategy applied :-
✅Inverted Head & Shoulder Chart Pattern Bull Breakout
✅Breakout confirmed
✅Rise in Volume
✅Good 3 touches Trendline Breakout with volume
✅Clear uptrend with HH & HLs sequence
✅ Order block as potential Supports
✅Check out my TradingView profile to see how we analyze charts and execute trades.
🙋♀️🙋♂️If you have any questions about this stock, feel free to reach out to me.
📍📌Thank you for exploring our idea! We hope you found it valuable.
🙏FLLOW for more !
👍LIKE if useful !
✍️COMMENT Below your view !

MARUTI Trading Within Fresh Weekly Demand ZoneMARUTI is currently trading at ₹10861.45, positioned within its demand zone between ₹10973.5 and ₹10458, identified on 16th February 2024. This fresh zone remains untested, suggesting potential buying interest at these levels. Investors may watch for support within this range, which could signal a possible rebound opportunity.
Disclaimer: This analysis is for informational purposes only and should not be considered as financial advice. Please conduct your own research or consult a financial advisor before making any investment or trading decisions

Maruti Set for a LaunchHead and shoulder pattern spanning multiple years. Stock could double if breakout with a strong volume. Probably.

Maruti Waiting for BOMaruti largest car manufacturer in India. Festive and Marriage season is coming.
Technically formed Inverted HnS with neckline at almost 10000 and the tgt of 15500. Current mrket price is 12600. On daily chart showing good accumulation and BO and on weekly chart it will show BO if passes abv 13000.
Nifty AUTO is also showing BO after some consolidation. Maruti can be added for 15500 once crosses abv 13000. Please do your own study before investment.

Maruti - Range BreakoutCMP 12620 o 20.09.24
The stock has been traveling in a rising wedge pattern since March. In the last few days, it has been consolidating within a particular range. Today showing a breakout of that range.
If momentum continues may go to 13050/13300/13700.
As far as it seems above 12570. Setup remains active. One should wisely choose the position size and exit levels while considering risk-management.
This illustration is only own view for learning and sharing purposes, it is not a trading advice in any form.
All the best.

MARUTI 30 Min levels (S/R)we mark Support and Resistance on the charts so you can check..
According to Investtech, Maruti Suzuki India's (MARUTI) support and resistance levels are:
Support: 10,800 rupees
Resistance: 13,000 rupees
According to TradingView, Maruti Suzuki India's key resistance levels are: 13,170 rupees and 13,551 rupees.
According to Equitypandit, Maruti Suzuki India's support levels are: 12,344 rupees, 12,260 rupees, and 12,169 rupees.
According to Equitypandit, Maruti Suzuki India's resistance levels are: 12,518 rupees, 12,609 rupees, and 12,693 rupees.
Support and resistance levels are key points where a concentration of buyers or sellers meet a price trend. Investors and traders use these levels to identify potential entry and exit points.

BULLISH ON MARUTI Maruti has given breakdown from its trendline along with potential support.
In addition, after breakdown it has not fall an inch and thus inviting sellers. I am bullish on this trap.
We can see a big candle soon hunting SL of sellers.
Just an idea of upcoming trend. RR is favorable along with high probability setup.

Maruti ready to bounce offering great Risk to RewardMaruti is ready to again bounce after a decent consolidation as is very evident from the Weekly chart. A good Risk Reward Trade. SL can be 12000 on a weekly basis but positional target can be 13000. Also hovering at 20WEMA and 100 DEMA which offers a little more comfort
