Maruti - Compression Setup Near Resistance💹 Maruti Suzuki India Ltd (NSE: MARUTI)
Sector: Automobiles | CMP: 16187 | View: Compression Setup Near Resistance
STWP Support & Resistance – MARUTI
Resistances: 16264 | 16311 | 16426
Supports: 16102 | 16017 | 15940
While the above levels highlight the nearest technical markers, the chart shows that the broader resistance band between 16264–16426 is relatively weak, marked by shallow rejection wicks and limited seller follow-through, suggesting only mild supply overhead. On the downside, the support pockets around 16102–16017 and the deeper zone near 15940 appear structurally stronger, backed by prior accumulation and repeated stabilization attempts that show institutional interest absorbing dips. This configuration reflects a market in compression near resistance, where buyers are defending declines but have yet to demonstrate strong breakout conviction; sustained movement above 16264 may improve momentum, while failure to hold 16017 could shift short-term control back to sellers.
STWP Volume & Technical Setup – MARUTI
MARUTI continues to display a tightly coiled structure, reflecting clear price compression and controlled volatility as the stock trades within a contracting range after a series of higher-lows and overlapping candles. The volume profile remains within normal distribution, with no abnormal spikes, signalling that institutional participation has been steady but not aggressive. Momentum indicators show a mixed landscape — RSI stabilizing in the mid-zones, MACD maintaining a neutral-to-slightly positive crossover profile, and CCI oscillating around its mean — collectively suggesting that the stock is preparing for a decisive move rather than trending with strength. Compression metrics, such as narrow-body candles and tightening ranges, indicate that liquidity is positioning but not yet committed, while the BB bands remain moderately tightened, hinting at a potential volatility expansion trigger. Despite this consolidation, the broader structural undertone leans mildly bullish, supported by the trend strength seen in prior legs and the stock’s ability to hold above key support pockets even after intraday profit-booking phases. Overall, MARUTI’s setup resembles a pre-breakout equilibrium phase where buyers and sellers are evenly matched, and a clean breakout or breakdown candle will determine the next directional impulse.
STWP Summary View
Final Outlook: Momentum: Developing|Trend: Mildly Bullish|Risk: Moderate|Volume: Normal
The overall MARUTI derivatives landscape reflects a broadly bearish environment observed across intraday, short-term swing, volatility, buildup, ATM structure, strategy alignment, smart-money behaviour and straddle characteristics, where the prevailing trend remains down and sentiment stays negative, with an STWP Edge Score of 6.4/10 indicating a moderate yet structured setup that requires disciplined sizing rather than aggressive positioning. The frequently referenced strike throughout the analysis is the 16200 level, where the PUT (delta -0.46) recorded an LTP of 229.15 after a 19.63% gain, supported by volume expansion of 15.5% to 6363 contracts and a mild IV rise to 16.2%, while open interest dropped sharply by 26.5% (-24,450 contracts), creating a short-covering signature that often reflects trapped participants exiting positions as prices shift. These dynamics form part of a broader mixed-to-moderate structural zone where the option behaves closer to futures because of its delta profile, giving smoother directional sensitivity with controlled convexity. The intraday and swing illustrations revolve around defined levels such as the entry around 229.15, a protective threshold at 194.78 and reference targets near 280.71 and 297.89, used purely to demonstrate risk structuring and reward modelling practices in an academic context. Volatility sits in a balanced band, with average IV near 15.65%, a high of 18.69% at the 15000 PUT and a low of 13.97% at the 16000 CALL, creating an environment where different option structures behave differently depending on how implied volatility evolves. The buildup distribution further reinforces the bearish tilt seen in derivatives behaviour: the CALL side held moderate short build-up and long unwinding, whereas the PUT side displayed strong short-covering activity supported by minor long additions, highlighting pressure points and exhaustion pockets in the flow. The ATM strike at 16200 acts as the central sensitivity zone with the CE at 253.75 (delta 0.55, IV 14.31%) and the PE at 229.15 (delta -0.46, IV 16.22%), helping market participants understand how gamma, delta shifts and volatility behaviour influence intraday reactions. Broader strategy illustration shows how trend strength, call-side dominance in flows, a mid-range IV environment and a PCR of 0.66 combine to form a generalized bearish framework, while the Smart Money Heat assessment indicates about 36% bearish momentum derived from long build-up, short build-up, short-covering and unwinding activity across liquid strikes; liquidity metrics such as a median OI of 88750 and a median volume of 3380 provide context for depth and participation. The straddle analysis at the 16200 strike shows a combined premium of 2.98% against an expected move of 3.83%, an average IV band of 15.27%, a near-flat net delta of 0.09, a symbol-level PCR of 0.78 and a max pain level anchored at 16200, illustrating how volatility expectations, premium richness, delta neutrality and positioning pressures interact. Collectively, these elements present a comprehensive educational study of how trend, volatility, open interest behaviour, buildup distribution, gamma-zone dynamics, straddle structure and flow-based sentiment can be read together as part of an institutional-style analytical exercise, without forming any investment advice or trade recommendation of any kind.
⚠️ STWP Legal Disclaimer
This document is strictly for educational and informational purposes. All examples, charts, levels, and option structures discussed are illustrative and are not intended as buy, sell, or hold recommendations. STWP does not provide investment advice, trading tips, signals, or personalized financial guidance of any kind, nor is it a SEBI-registered intermediary or research analyst. The analyses, illustrations, and risk–reward structures included here are generic in nature and based on publicly available data and observed market behaviour, which may change without notice. Financial markets involve significant risk; derivatives in particular carry the potential for substantial losses. Option premiums, implied volatility, open interest, delta, and other market variables can fluctuate rapidly and unpredictably.
Readers are solely responsible for their trading decisions, capital management, and risk assessment. Before making any investment or trading decision, please consult a SEBI-registered investment advisor. STWP, its representatives, and affiliates shall not be liable for any direct or indirect loss arising from the use of this material. Historical patterns or past market behaviour do not guarantee future outcomes, nor should any part of this document be interpreted as a promise of performance, accuracy, or returns.
Position Status: No active position in this instrument at the time of analysis.
Data Source: TradingView & NSE India.
💬 Found this useful?
🔼 Boost this post to support structured learning
✍️ Share your thoughts or questions in the comments
🔁 Forward this to traders who value clean technical studies
👉 Follow for disciplined, structured, STWP-style analysis
🚀 Stay Calm. Stay Clean. Trade With Patience.
Trade Smart | Learn Zones | Be Self-Reliant 📊
Marutianalysis

MARUTI OPTIONS TRADE SETUP📊 MARUTI OPTIONS TRADE SETUP – 12 Aug 2025
MARUTI is currently trading near ₹12,840, and the overall market mood looks bullish. We are seeing strong buying interest in call options from the 12,800 strike all the way up to 13,500, which means traders are expecting higher prices ahead. On the other hand, put option writers are active between 12,500 and 12,900, which suggests that they believe MARUTI will not fall below these levels anytime soon. The recent short covering at 12,700 CE (call option) along with fresh long positions above the spot price is adding fuel to the upside momentum. Volatility is in a low to moderate range (IV 13–17%), making it a good environment for debit strategies where you pay a premium for a defined-risk trade. For this setup, a combination of bullish directional positions (for momentum) and limited-risk spreads (to control risk) can work well, especially for traders who want to capture upside without taking unlimited exposure.
Bullish Directional Trade –13,000 CE
This trade idea is based on a clear sign of bullish momentum in the market. The 13,000 Call Option has shown a strong long build-up, with open interest (OI) increasing by 39% – meaning more traders are taking fresh long positions, expecting prices to move higher. We also see active call buying not just at 13,000 but also at the 12,900 and 13,200 strike prices, which suggests strong optimism in this price zone. The Delta value of 0.44 means the option moves moderately with the underlying index – giving good upside potential without taking extreme risk. Plus, with Implied Volatility (IV) at just 14.18%, the option is relatively cheap considering the strong upward momentum. In simple terms – the data supports a bullish view, the cost is reasonable, and the trade offers a balanced mix of profit potential and risk control.
Bullish Spread Trade
This Bull Call Spread is a smart bullish strategy that helps you participate in an upward move while keeping your cost and risk under control. In this trade, we buy the 13,000 CE at ₹98.50 and sell the 13,200 CE at ₹50.95. By selling the higher strike call, we reduce our upfront cost, bringing the net investment (net debit) down to just ₹47.55 per share, or ₹2,377.50 total for 50 lots. The maximum profit is capped at ₹7,122.50, which happens if the market closes at or above ₹13,200 on expiry. The maximum loss is limited to ₹2,377.50 — the amount we paid for the spread — making it much safer than buying a naked call. Our break-even level is ₹13,047.55, meaning we start making profits if the price goes above this level. The reason for choosing this structure is that the 13,200 CE also shows strong buying interest (long build-up), which increases the probability of the stock moving into our profitable zone. In short, it’s a low-cost, limited-risk, and favorable risk-reward setup for traders expecting a steady move upwards, without taking the full risk of outright call buying.
Aggressive Bullish Momentum
This trade is designed for situations where we expect strong upward momentum in MARUTI. We are using a Bull Call Spread, which means we buy a lower strike call option (₹12,900 CE @ ₹137) and simultaneously sell a higher strike call option (₹13,300 CE @ ₹37.60). This combination reduces the overall cost compared to buying a call outright, making the trade more affordable while still giving us good profit potential. Here, the total cost (net debit) comes to ₹99.40 per share, or ₹4,970 for 50 shares. If MARUTI moves up strongly toward the ₹13,300 level, our spread reaches its maximum profit potential of ₹15,030. The maximum we can lose is the initial ₹4,970 we invested, which is our fixed risk. The beauty of this setup is that we have a risk-to-reward ratio of about 1:3, meaning we’re risking ₹1 to potentially make ₹3. This is a strategic way to benefit from a strong bullish view while keeping risk capped — perfect for traders who want to balance aggressiveness with controlled exposure.
💡 Open Interest Insights:
From the current data, we can see that almost every At-The-Money (ATM) and Out-of-The-Money (OTM) Call Option up to the 13,500 strike is showing a Long Build-Up. This means traders are actively buying calls, which generally signals that they expect the market to move higher. At the 12,700 CE, we notice Short Covering — here, traders who had earlier sold calls are now buying them back, which usually happens when they believe the level will hold and the market may move up from there. This suggests that 12,700, which may have been a resistance earlier, could now act as a strong support. On the Put Option side, strikes between 12,500 and 12,900 are showing Short Build-Up, meaning traders are selling puts — a sign they expect these levels to hold and the market not to fall below them. Additionally, the fact that Implied Volatility (IV) is low while we are seeing a Long Build-Up means the market is showing steady bullish confidence without panic buying, which can support a sustained upward trend.
⚠️ Disclaimer – Please Read Carefully
The information shared here is meant purely for learning and awareness. It is not a buy or sell recommendation and should not be taken as investment advice. I am not a SEBI-registered investment advisor, and all views expressed are based on personal study, chart patterns, and publicly available market data.
Trading — whether in stocks or options — carries risk. Markets can move unexpectedly, and losses can sometimes be larger than the money you have invested. Past performance or past setups do not guarantee future results.
If you are a beginner, treat this as a guide to understand how the market works — practice on paper trades before risking real money. If you are an experienced trader, remember to assess your own risk, position sizing, and strategy suitability before entering any trade.
Data, prices, and analysis are based on information available as of 12 August 2025, and market conditions can change at any time. Always verify with reliable sources and consult a SEBI-registered financial advisor before making any real trading decision.
By reading, watching, or engaging with this content, you acknowledge that you take full responsibility for your own trades and investments.
💬 Found this useful?
Drop your thoughts, questions, or setups in the comments — let’s grow together!
🔁 Share this post with fellow traders and beginners to spread clean, structure-based learning.
✅ Follow simpletradewithpatience for beginner-friendly setups, price action insights, and disciplined trading content.
🚀 Stay Calm. Stay Clean. Trade With Patience.
Trade Smart | Learn Zones | Be Self-Reliant 📊

MARUTI – Strong Call Long Build-Up Dominance________________________________________
📈 MARUTI – Strong Call Long Build-Up Dominance | OI + Price Action Analysis
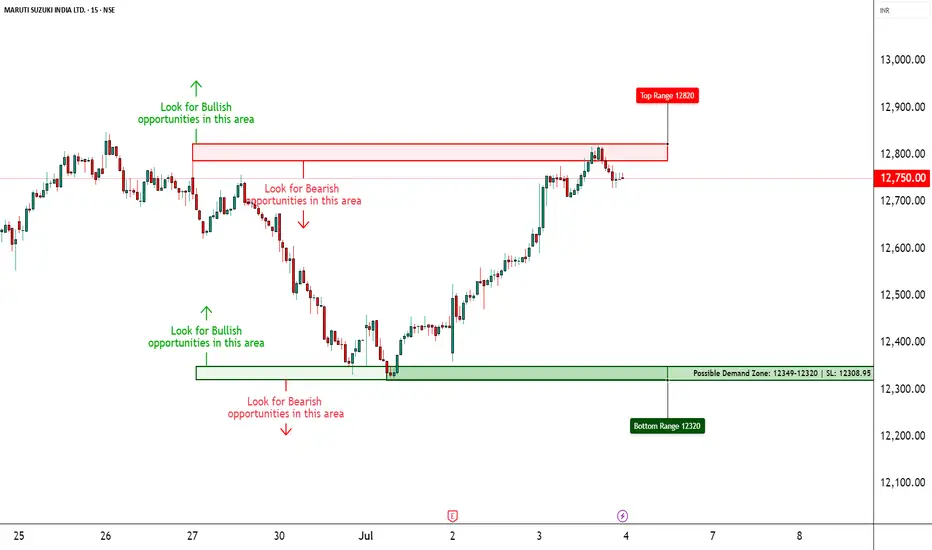
🕒 Chart Type: 15-Minute
📆 Date: July 3, 2025
________________________________________
🔍 What’s Catching Our Eye:
MARUTI closed around ₹12,752, and the entire Call side up to 13,500 is showing strong Long Build-Up, indicating aggressive bullish sentiment from option buyers. Meanwhile, the Put side is displaying Short Build-Up, further confirming bullish undertones. The price is steadily climbing, supported by strong institutional participation.
________________________________________
📌 What We’re Watching For:
If MARUTI sustains above ₹12,800, bullish continuation looks likely. Watch for follow-through toward ₹13,000 and 13,200+ if momentum persists. However, a drop below ₹12,500 could temporarily halt this upward bias.
________________________________________
📊 Volume Footprint:
Options activity is backed by strong volume — over 17k+ contracts at ₹13,000 CE and 15k+ at ₹12,800 CE — showing traders are betting big on further upside.
________________________________________
📈 Option Chain Highlights:
The OI data is highly supportive of the bulls:
• Calls (Long Build-Up):
o ₹13,000 CE: +104,450 OI | Price ↑ 8.6%
o ₹12,800 CE: +101,800 OI | Price ↑ 12.04%
o ₹12,900 CE: +95,650 OI | Price ↑ 10.07%
o Even OTM CE like ₹13,500 is active → trend belief is strong
• Puts:
o ₹12,800 PE & ₹12,700 PE both showing Short Build-Up, i.e., buyers believe downside is limited
Inference: Bulls are clearly in control, with both Call buyers active and Put sellers stepping in. This aligns with the broader bullish trend seen in the stock.
________________________________________
🔁 Trend Bias:
🟢 Bullish – Confirmed via price action and derivative sentiment
________________________________________
🧠 Trade Logic / Reasoning:
Strong accumulation is seen at every major Call level, from ATM to slightly OTM strikes. Short covering at ₹12,500 CE and long build-up in higher CE strikes confirms that the bulls are expecting a continuation rally. PE writers are unwinding or adding shorts – classic sign of strength.
________________________________________
📍 Important Levels to Mark:
🔺 Top Range (Resistance): ₹13,200 – ₹13,500
🔻 Bottom Range (Support): ₹12,500
________________________________________
🎯 Trade Plan (Educational Purpose Only):
✅ Best Buy (Equity): Above ₹12,800 with strong bullish candle
✅ Best Sell (Equity): Avoid unless ₹12,500 is broken
✅ Best CE to Long: ₹13,000 CE – Strongest long build-up with momentum
✅ Best PE to Long: Avoid PE long – sentiment doesn’t support bearish bets
🟢 Demand Zone: NA
🔴 Supply Zone: NA
⚠️ Invalidation Below:
Bullish bias is invalidated below ₹12,500 with high volume selling
________________________________________
⚠️ Disclaimer:
This analysis is for educational purposes only.
STWP is not a SEBI-registered advisor.
No buy/sell recommendations are made.
Please consult your financial advisor before trading.
STWP is not responsible for trading decisions based on this post.
________________________________________
💬 Did this help you spot the momentum early?
Drop your views in the comments ⬇️
🔁 Share this with traders watching MARUTI
✅ Follow STWP for clean price + option chain trades
🚀 Let’s educate more traders with patience and clarity!
________________________________________
MARUTI is ready for a trendline breakout, signaling Bearish ViewAfter an uptrend, it transitions from higher highs to lower highs. Drawing a trendline indicates it's ready for a breakout. Keep the stock on the watchlist and wait for the breakout. Ensure that when it breaks the trendline and undergoes a retest, that's the time to enter
"Note: I will maintain charts in a simple way. Only those with basic knowledge of technical analysis will be able to understand what I am posting."

MARUTI Selling Point of View on 29th Feb 2024It is forming lower lows and lower highs, and is currently at a support level. When it breaks the support level, we can enter..

Maruti Chart Analysis for Swing Trading 31.01.2024At present Maruti is trading at 9951.
Maruti Can be sold below 9950 for the targets of 9809, 9410 and 8966.
If anyone wants to buy options, you can buy PE of 10000 Maruti.
Follow me. Comment and Boost.

Maruti Bearish Bat PatternBearish Bat In Maruti
Sell PRZ - 9575 - 9600
SL - 9800 ( Day Closing Basis )
Target - 9000/8800

MARUTI, what next?NSE:MARUTI looking bearish on weekly timeframe. For the last 4 weeks lower lows are made. If this continues then 8000-8100 levels can be seen easily. It has broken it's 50 EMA support on bigger timeframe.

Maruti Ready For Right Shoulder Rise + Tweezer Bottom Found Maruti Big Buy
Closing Price - 6703.05
SL - 6269
Target - 8300/8600

maruti shorting targets NSE:MARUTI showing signs for a nice fall with respect to daily trendline break down and retest logic.

Maruti Multiple BreakoutInverted Head & Shoulder Breakout
Buy Maruti Only If Price Come To 7350-7400
SL - 7099 (DCB)
Or If Give Day Close Above 7700
SL - 7430 (DCB)
Target - 8400

Maruti Suzuki India Ltd - 25.02.2022Maruti Suzuki India Ltd - 25.02.2022
The stock is trading @ 8356 levels
There is a SPINNING TOP in Weekly Charts
RSI is above 60 in Weekly Charts
The prices are below EMA
Let the prices go above 8484
Watch out for the price actions

MARUTI BIG TIME BREAKOUT + RETESTMaruti has given a long awaited breakout after 6 months and with a strong bullish candle failing which have been a possible double top formation.
9 ema is acting as current support
Successful retest done
RSI in bullish zone
MACD above signal line.
BUY ABOVE - 8600
Targets mentioned in the chart above
Please LIKE, COMMENT and SHARE to motivate and support me. I'll keep on posting new ideas on Indices & Stocks. Be sure to follow so that you don't miss any good trades that might have been rewarding.
Any comments and critiques will be appreciated even if it's of opposite view as a trader can also be right so many times.

Head & Shoulder Pattern Formation in MarutiMaruti has been in a Complex Head and Shoulder pattern formation since September 2018. Looks like the stock is coming out of this pattern as it moves above 8500 with high volumes.
The stock had reported its Quarterly Earnings on 25th Jan and the stock has moved +4.2% since then.
If the stock stays above 8500, it can move towards its all-time high of 10K

Simple Trade Setup | MARUTI | 13-12-2021 [ INTRADAY ]NSE:MARUTI
Observations:
1) On 1day time frame,it has bounce from 200DMA and now trading below 50DMA.
50DMA is immediate resistance.
50DMA is placed at 7493.41. We can say that range of 7490-7500 will be immediate resistance zone.
Please refer below chart : 1day Time Frame.
2) Also on 1day time frame, it has made double bottom pattern.
Major breakout is still above 7500 level and safe breakout is above 7530 level.
Please refer below chart : 1day Time Frame.
-------------------------------------
Trade Setup for Date: 13-12-2021
1) Don't Jump in to trade at the beginning of the market. Let it get settle for 15-20min first and judge the price action.
2) Everything is mentioned on the chart. I hope it is easy to understand.
3) All the levels will work as support, resistance, entry and exit w.r.t price action near that level.
4) Avoid gap up or gap down chase. Wait and trade between levels.
Please refer below chart for levels.
Hope I made it easy to understand it.
Do comment your doubt or suggestion.
Note: Trade with Strict SL. It may or may not hit all the levels. So one can book profit / loss at respective level considering how price action works near that level.

Maruti Suzuki - Ready to move upNSE:MARUTI Maruti has formed triangle pattern and it has broken out upwards. Looking good for a swing trade. I have mentioned the entry, SL and targets in the chart. Trade according to your own setup and risk. Comment your views and doubts. Thank you... Happy trading...

LONG ON MARUTIDuring Diwali season we can expect auto stocks to pick momentum and safer than tata motors will be Maruti!
follow the 40-30-30 principle while accumulating it, as it's an expensive stock and we don't want to get trapped if the price goes against our view!

MARUTI -Bottom CreatedAfter the issue of semiconductor issue in auto sector , auto stocks have given a good correction. But chart indicates that the stocks are bottoming out. As always technical comes first then the news.
MARUTI
Buy-Above 6950(Add Till 6740)
Sl-6590
T-7335 7655 8000+

MARUTI - WHAT TO DO ? Now ??as all auto sectors are running but maruti showing a range moment till now,
if it breaked the upper yellow area then a huge rally will be made what if it breaked the flag trend then a short term downtrend will be there
full analysed chart is on my free VIP group message me to get in, i will freely guide you
.
.
.
happy trading
god bless you all

Edge of breakout !! Price trying to break the previous days high with strong bullish candle. If closes above the resistance line marked in Red then one can go long.
