Maruti (D): Cautiously Bullish - Low-Volume BreakoutTimeframe: Daily | Scale: Linear
The stock has confirmed a technical breakout from a 3-month rectangular consolidation. While the price action is positive, the low volume suggests a lack of aggressive institutional buying yet. The move is likely driven by year-end seasonality rather than raw momentum.
📈 1. The Chart Structure (Box Breakout)
> The "Box": Rectangle Pattern (or Box Consolidation).
> Resistance (Ceiling): 16,375 . This level capped upside in Oct and early Dec.
> Support (Floor): 15,249.
> The Breakout: Today's close above 16,375 is technically a breakout. It signals that buyers have finally absorbed the supply at this level.
> The ATH Hurdle: It is important to note that the All-Time High (ATH) of 16,600 is just ~1.4% away. A true "Blue Sky" run only starts above 16,600.
⚠️ 2. The Volume Warning (The Risk)
> The Divergence: "volume has been drying up," and today's volume ( 257K ) is relatively minor for a breakout candle.
- Rule of Thumb: A genuine breakout usually requires volume to be 1.5x to 2x the average.
- Risk: Low-volume breakouts often retrace (pull back) to test the breakout level. Do not be surprised if it dips back to 16,375 tomorrow.
🚀 3. The Fundamental Catalyst (The "Why")
The price is likely drifting up due to Seasonality :
> January Price Hikes: Automakers, including Maruti, typically announce price hikes in late December (effective Jan 1st). The market often "front-runs" this news.
> Year-End Discounts: Aggressive Dec sales pushes often boost Q3 numbers, keeping sentiment positive despite low holiday volume.
📊 4. Technical Indicators
> RSI: Rising in all timeframes confirms the trend is healthy.
> EMA: The Positive Crossover on EMAs aligns with the breakout, validating the trend direction even if volume is lagging.
🎯 5. Future Scenarios & Key Levels
The low volume dictates a "buy on confirmation" strategy.
> 🐂 Bullish Target:
- Confirmation Trigger: A daily close above 16,600 (ATH) would confirm volume is returning.
- Target: 17,505 .
> 🛡️ Support (The "Must Hold"):
- Immediate Support: 16,375 . The breakout level must hold on a closing basis.
- Stop Loss: A close below 16,193 (recent consolidation high) would confirm a "fakeout" and likely send the stock back to 15,250.
Conclusion
Technically, the box breakout is valid , but the volume is weak . The safest play is to wait for a close above 16,600 to confirm strength.
Marutisuzuki

Maruti - Compression Setup Near Resistance💹 Maruti Suzuki India Ltd (NSE: MARUTI)
Sector: Automobiles | CMP: 16187 | View: Compression Setup Near Resistance
STWP Support & Resistance – MARUTI
Resistances: 16264 | 16311 | 16426
Supports: 16102 | 16017 | 15940
While the above levels highlight the nearest technical markers, the chart shows that the broader resistance band between 16264–16426 is relatively weak, marked by shallow rejection wicks and limited seller follow-through, suggesting only mild supply overhead. On the downside, the support pockets around 16102–16017 and the deeper zone near 15940 appear structurally stronger, backed by prior accumulation and repeated stabilization attempts that show institutional interest absorbing dips. This configuration reflects a market in compression near resistance, where buyers are defending declines but have yet to demonstrate strong breakout conviction; sustained movement above 16264 may improve momentum, while failure to hold 16017 could shift short-term control back to sellers.
STWP Volume & Technical Setup – MARUTI
MARUTI continues to display a tightly coiled structure, reflecting clear price compression and controlled volatility as the stock trades within a contracting range after a series of higher-lows and overlapping candles. The volume profile remains within normal distribution, with no abnormal spikes, signalling that institutional participation has been steady but not aggressive. Momentum indicators show a mixed landscape — RSI stabilizing in the mid-zones, MACD maintaining a neutral-to-slightly positive crossover profile, and CCI oscillating around its mean — collectively suggesting that the stock is preparing for a decisive move rather than trending with strength. Compression metrics, such as narrow-body candles and tightening ranges, indicate that liquidity is positioning but not yet committed, while the BB bands remain moderately tightened, hinting at a potential volatility expansion trigger. Despite this consolidation, the broader structural undertone leans mildly bullish, supported by the trend strength seen in prior legs and the stock’s ability to hold above key support pockets even after intraday profit-booking phases. Overall, MARUTI’s setup resembles a pre-breakout equilibrium phase where buyers and sellers are evenly matched, and a clean breakout or breakdown candle will determine the next directional impulse.
STWP Summary View
Final Outlook: Momentum: Developing|Trend: Mildly Bullish|Risk: Moderate|Volume: Normal
The overall MARUTI derivatives landscape reflects a broadly bearish environment observed across intraday, short-term swing, volatility, buildup, ATM structure, strategy alignment, smart-money behaviour and straddle characteristics, where the prevailing trend remains down and sentiment stays negative, with an STWP Edge Score of 6.4/10 indicating a moderate yet structured setup that requires disciplined sizing rather than aggressive positioning. The frequently referenced strike throughout the analysis is the 16200 level, where the PUT (delta -0.46) recorded an LTP of 229.15 after a 19.63% gain, supported by volume expansion of 15.5% to 6363 contracts and a mild IV rise to 16.2%, while open interest dropped sharply by 26.5% (-24,450 contracts), creating a short-covering signature that often reflects trapped participants exiting positions as prices shift. These dynamics form part of a broader mixed-to-moderate structural zone where the option behaves closer to futures because of its delta profile, giving smoother directional sensitivity with controlled convexity. The intraday and swing illustrations revolve around defined levels such as the entry around 229.15, a protective threshold at 194.78 and reference targets near 280.71 and 297.89, used purely to demonstrate risk structuring and reward modelling practices in an academic context. Volatility sits in a balanced band, with average IV near 15.65%, a high of 18.69% at the 15000 PUT and a low of 13.97% at the 16000 CALL, creating an environment where different option structures behave differently depending on how implied volatility evolves. The buildup distribution further reinforces the bearish tilt seen in derivatives behaviour: the CALL side held moderate short build-up and long unwinding, whereas the PUT side displayed strong short-covering activity supported by minor long additions, highlighting pressure points and exhaustion pockets in the flow. The ATM strike at 16200 acts as the central sensitivity zone with the CE at 253.75 (delta 0.55, IV 14.31%) and the PE at 229.15 (delta -0.46, IV 16.22%), helping market participants understand how gamma, delta shifts and volatility behaviour influence intraday reactions. Broader strategy illustration shows how trend strength, call-side dominance in flows, a mid-range IV environment and a PCR of 0.66 combine to form a generalized bearish framework, while the Smart Money Heat assessment indicates about 36% bearish momentum derived from long build-up, short build-up, short-covering and unwinding activity across liquid strikes; liquidity metrics such as a median OI of 88750 and a median volume of 3380 provide context for depth and participation. The straddle analysis at the 16200 strike shows a combined premium of 2.98% against an expected move of 3.83%, an average IV band of 15.27%, a near-flat net delta of 0.09, a symbol-level PCR of 0.78 and a max pain level anchored at 16200, illustrating how volatility expectations, premium richness, delta neutrality and positioning pressures interact. Collectively, these elements present a comprehensive educational study of how trend, volatility, open interest behaviour, buildup distribution, gamma-zone dynamics, straddle structure and flow-based sentiment can be read together as part of an institutional-style analytical exercise, without forming any investment advice or trade recommendation of any kind.
⚠️ STWP Legal Disclaimer
This document is strictly for educational and informational purposes. All examples, charts, levels, and option structures discussed are illustrative and are not intended as buy, sell, or hold recommendations. STWP does not provide investment advice, trading tips, signals, or personalized financial guidance of any kind, nor is it a SEBI-registered intermediary or research analyst. The analyses, illustrations, and risk–reward structures included here are generic in nature and based on publicly available data and observed market behaviour, which may change without notice. Financial markets involve significant risk; derivatives in particular carry the potential for substantial losses. Option premiums, implied volatility, open interest, delta, and other market variables can fluctuate rapidly and unpredictably.
Readers are solely responsible for their trading decisions, capital management, and risk assessment. Before making any investment or trading decision, please consult a SEBI-registered investment advisor. STWP, its representatives, and affiliates shall not be liable for any direct or indirect loss arising from the use of this material. Historical patterns or past market behaviour do not guarantee future outcomes, nor should any part of this document be interpreted as a promise of performance, accuracy, or returns.
Position Status: No active position in this instrument at the time of analysis.
Data Source: TradingView & NSE India.
💬 Found this useful?
🔼 Boost this post to support structured learning
✍️ Share your thoughts or questions in the comments
🔁 Forward this to traders who value clean technical studies
👉 Follow for disciplined, structured, STWP-style analysis
🚀 Stay Calm. Stay Clean. Trade With Patience.
Trade Smart | Learn Zones | Be Self-Reliant 📊

MARUTI SUZUKI AT THE TOP - LOOKING WEAK NOW! - DEC2025 FUTURESMARUTI SUZUKI which is holding the top spot and on a the highest point has started to look weak now as it has broken the support and standing a supply zone resistance as of now.
Maruti stock futures of Dec2025 can be sold at the price of 16500 with a stop loss of 16800.
TARGETS ARE GIVEN IN THE CHART ATTACHED. FINAL TARGET OF 13000 IS EXPECTED BY DEC END.
IMPORTANT DATES OF DEC2025 ARE 02-DEC-2025 AND 29-DEC-2025.
📉 THIS CHANNEL IS ONLY FOR EDUCATIONAL PURPOSES.
Disclaimer: I am Not a SEBI registered analyst. I just share my positions to do paper trading and no where its a recommendation! Please do your own analysis before taking any trade.

Maruti SuzukiMaruti might touch around 16,250 tomorrow but beyond that a breakout is not expected much, as there has been a drop in the volume.

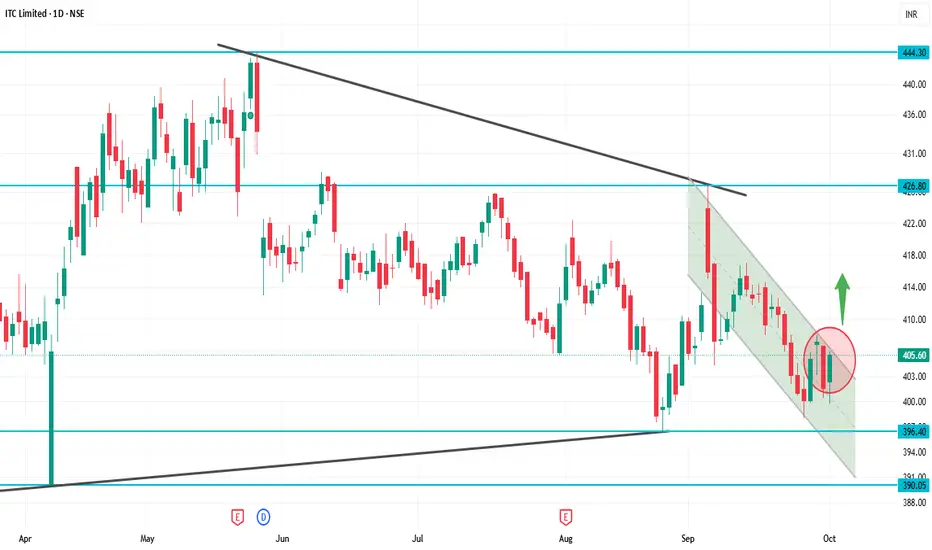
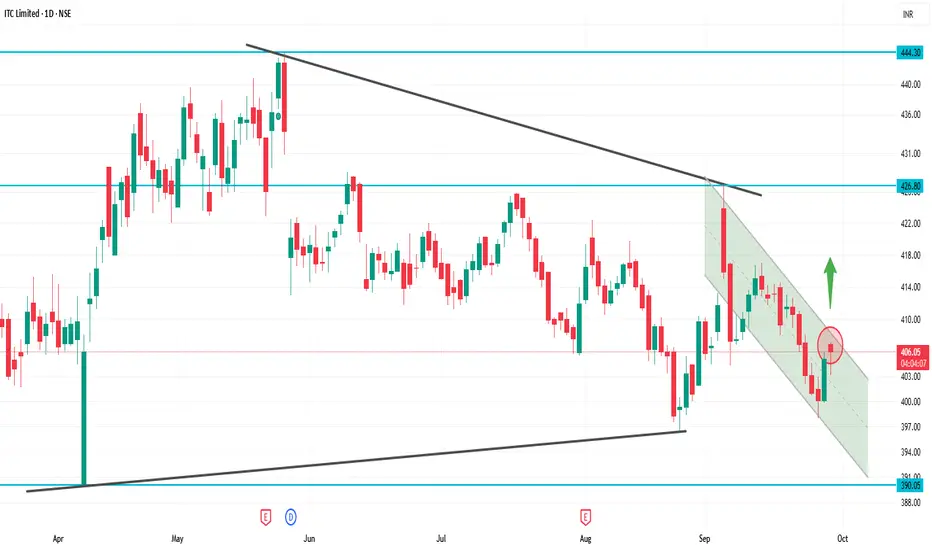
ITC 1D Time frameCurrent Price: ₹405.60
52-Week High: ₹524.35
52-Week Low: ₹390.15
Trend: Downward — trading below 5, 20, 50, 100, 200-day moving averages
Daily Chart Insights
Price below moving averages → bearish trend.
RSI & MACD → weak momentum, signaling short-term selling pressure.
Support zone at ₹390–₹400 → critical; a break below can push price down to ₹370–₹380.
Resistance at ₹420–₹430 → a strong close above may signal trend reversal.
Strategy / Outlook
Bearish Bias: Short-term trend is downward.
Buying Opportunity: Near support zones (₹390–₹400) if it holds.
Bullish Trigger: Close above ₹430 with strong volume indicates potential reversal.
Risk Management: Use stop-loss below critical support zones.
SBIN 1D Time frameCurrent Price (approx): ₹864
52-Week Low: ₹680
52-Week High: ₹880.50
Daily Chart Explanation
On the 1-day timeframe, SBIN is moving near its upper range, close to the recent high. This means the stock is strong but also facing heavy resistance.
Trend: Uptrend overall (higher highs and higher lows).
Momentum: Price is consolidating near resistance, showing hesitation.
Candles: Recent candles show wicks near the top, which means sellers are active near ₹880.

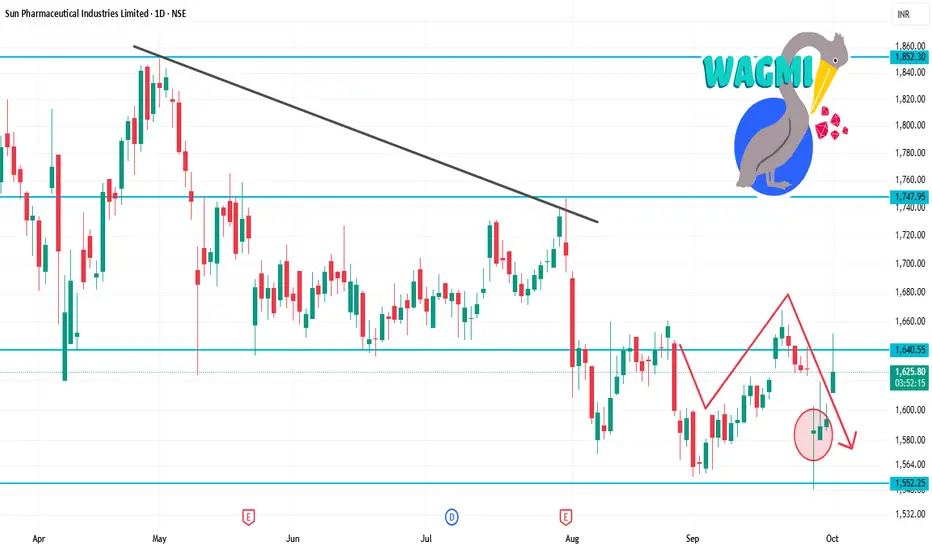
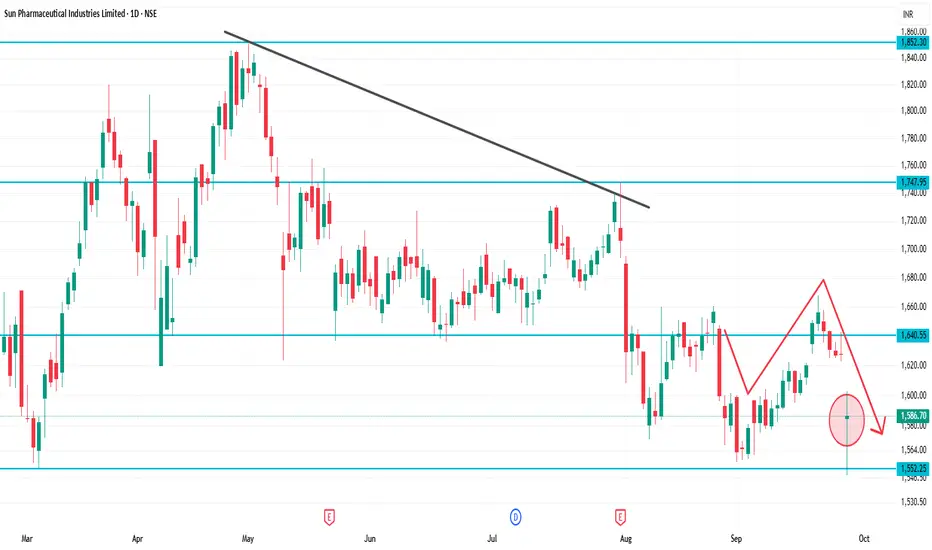
SUNPHARMA 1D Time frameOpening Price: ₹1,611.90
Closing Price: ₹1,628.20
Day Range: ₹1,611.90 – ₹1,651.50
Previous Close: ₹1,594.30
📉 Trend Analysis
Short-Term Trend: Bearish — The stock is trading below key moving averages, confirming the bearish trend.
Medium-Term Trend: Neutral — The stock is in a consolidation phase, characterized by lower highs and lower lows.
Long-Term Trend: Neutral — No significant trend identified; the stock is trading within a range.
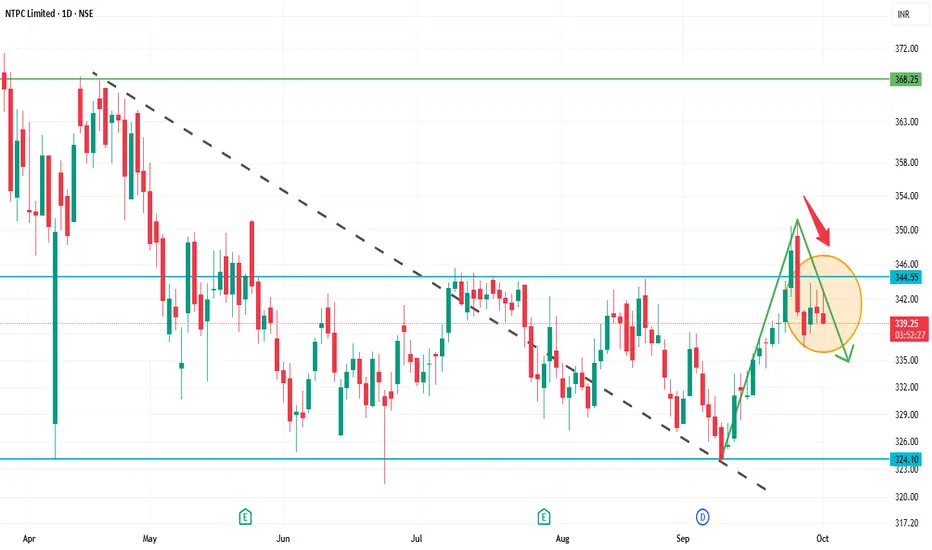
NTPC 1D Time frameOpening Price: ₹340.30
Closing Price: ₹340.25
Day Range: ₹339.45 – ₹343.05
📉 Trend Analysis
Short-Term Trend: Bearish — The stock is trading below key moving averages, confirming the bearish trend.
Medium-Term Trend: Neutral — The stock is in a consolidation phase, characterized by lower highs and lower lows.
Long-Term Trend: Neutral — No significant trend identified; the stock is trading within a range.
🔮 Conclusion
NTPC Ltd. is in a bearish trend with weak momentum.
Break below ₹335.00 could lead to further decline toward ₹330.00.
Break above ₹347.00 would indicate a potential trend reversal.
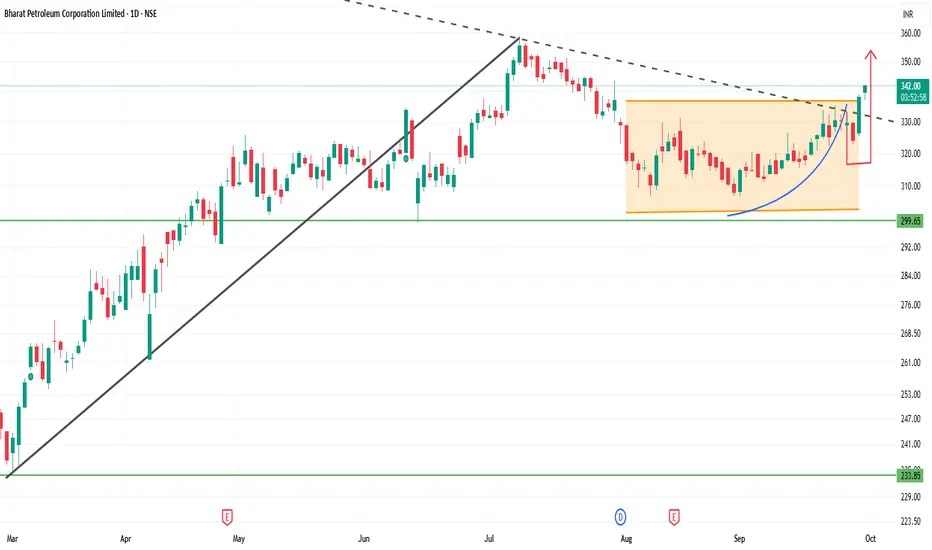
BPCL 1D Time frameCurrent Price Snapshot
Last Traded Price: ₹340.20
Day’s Range: ₹337.15 – ₹340.85
52-Week Range: ₹234.01 – ₹373.35
Technical Indicators
RSI (14-day): 53.27 — indicates a neutral momentum.
MACD: 2.49 — suggests a bullish trend.
Moving Averages:
5-day: ₹327.97 — indicates a Sell signal.
50-day: ₹322.14 — indicates a Buy signal.
200-day: ₹296.14 — indicates a Buy signal.
Pivot Points:
Support: ₹327.13
Resistance: ₹337.93
Summary
Above ₹340.85: Potential rise toward ₹345 – ₹350.
Below ₹337.15: Potential fall toward ₹330 – ₹325.
Between ₹330 – ₹340: Likely range-bound movement.
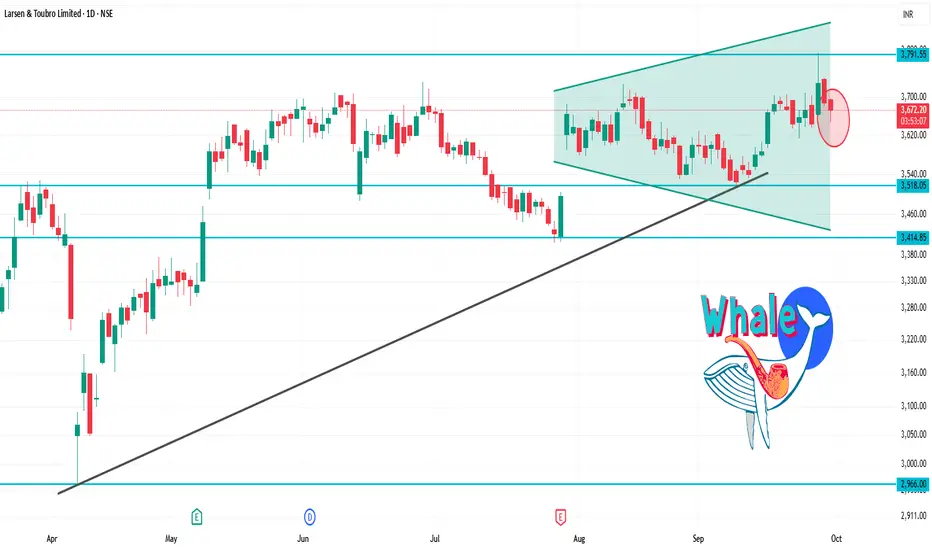
LT 1D Time frameCurrent Price: ₹3,655.30
Day’s Range: ₹3,648.00 – ₹3,696.60
52-Week Range: ₹2,965.30 – ₹3,963.50
Technical Indicators
RSI (14-day): 41.19 — indicates a neutral to slightly bearish momentum.
MACD: -1.47 — suggests bearish momentum.
Moving Averages: Mixed signals — short-term averages are bearish, while long-term averages are bullish.
Technical Summary: Predominantly Sell signals across various indicators.
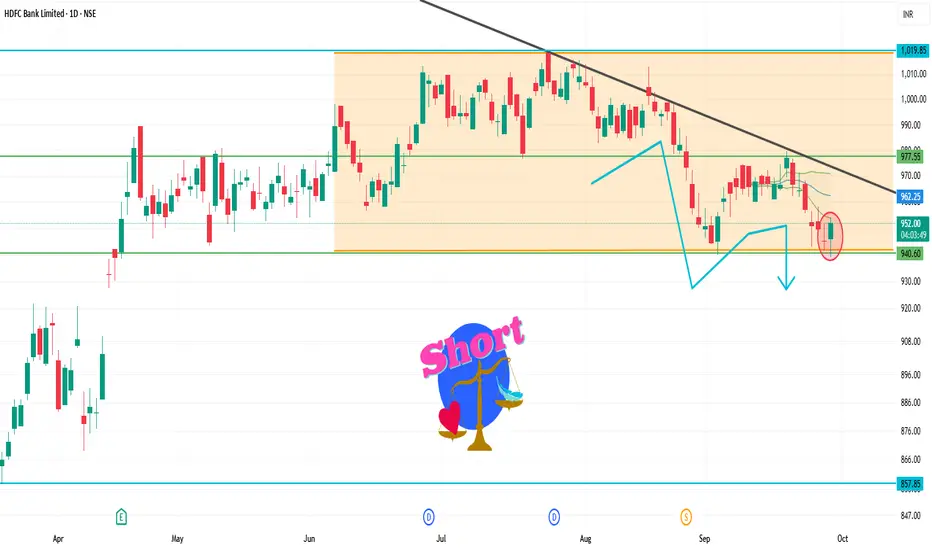
HDFCBANK 1D Time frameCurrent Market Snapshot
Current Price: ₹954.05
Opening Price: ₹945.10
Day's Range: ₹939.10 – ₹953.00
Previous Close: ₹945.05
🔑 Technical Indicators
Relative Strength Index (RSI): 35.08 – indicating a neutral to bearish condition.
Moving Average Convergence Divergence (MACD): -6.02 – suggesting bearish momentum.
Moving Averages: Trading below the 50-day and 200-day moving averages, indicating a bearish trend.
📈 Key Support & Resistance Levels
Immediate Support: ₹939
Immediate Resistance: ₹953
Pivot Point: ₹946
📉 Market Sentiment
Trend: The stock is trading below its 50-day and 200-day moving averages, indicating a bearish trend.
Volume: Trading volume is higher than average, suggesting increased investor activity.
📈 Strategy (1D Timeframe)
1. Bullish Scenario
Entry: Above ₹953
Stop-Loss: ₹939
Target: ₹960 → ₹965
2. Bearish Scenario
Entry: Below ₹939
Stop-Loss: ₹953
Target: ₹930 → ₹925
⚠️ Risk Management
Limit risk to 1% of capital per trade.
Always use stop-loss to protect against unexpected market movements.
Monitor broader market trends and sector-specific news that may impact stock performance.
ITCITC Daily Snapshot
Current Price: ~₹405
Day’s Range: ~₹401 – ₹406
🔍 Key Levels
Support: Around ₹399 – ₹401 (near-term buying zone)
Resistance: Around ₹409 – ₹412 (supply zone)
📈 Technical Picture
Trend: Slightly bearish to sideways, but stabilizing above ₹405 gives some strength
RSI (Daily): Neutral zone, neither overbought nor oversold
Moving Averages: Price is close to short-term averages, so a decisive breakout above ₹409 is needed for bullish confirmation
VWAP: Trading near VWAP, showing balance between buyers and sellers
✅ Summary
At ₹405, ITC is near the middle of its range.
If it holds above ₹405 and breaks ₹409–₹412, bullish momentum can pick up.
If it falls below ₹401, it may retest support near ₹398.
SUNPHARMA 1D Time frameCurrent Price: ~₹1,586
Day Range: ~₹1,582 – ₹1,600
52-Week High: ~₹1,960
52-Week Low: ~₹1,553
📈 Technical Outlook
Immediate Support: ₹1,580 (very close to current price)
Strong Support: ₹1,553 – ₹1,560 (52-week low zone)
Immediate Resistance: ₹1,600 – ₹1,620
Major Resistance: ₹1,650 – ₹1,670
Trend Bias:
Stock is weak, testing lower supports.
If it breaks below ₹1,580, then ₹1,553 may be tested.
A bounce is only possible if it sustains above ₹1,600.
📌 Step-by-Step Market View
Above 1,600: Chance for small recovery toward ₹1,620 – ₹1,650.
Stays between 1,580 – 1,600: Consolidation zone.
Breaks below 1,580: Weakness may extend to ₹1,553.
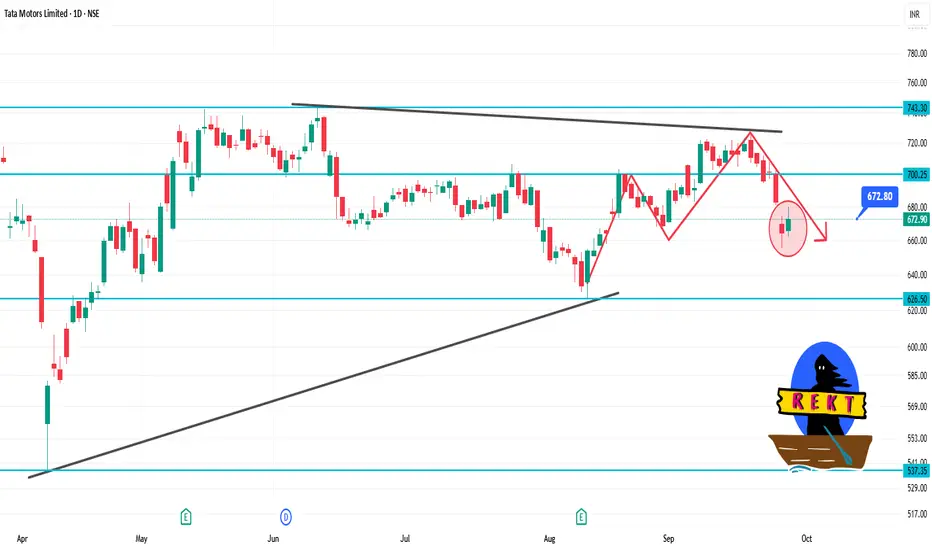
TATAMOTORS 1D Time frameCurrent Price: ₹673.00
Day's Range: ₹662.35 – ₹680.35
Previous Close: ₹664.30
Volume: 15,780,434 shares traded
Market Cap: ₹247,780 crore
52-Week High: ₹1,000.40
52-Week Low: ₹535.75
Face Value: ₹2.00
Beta: 1.30
🧾 Financial Highlights
P/E Ratio (TTM): 11.69
P/B Ratio: 0.00
EPS (TTM): ₹57.54
Dividend Yield: 0.89%
ROE: 28.1%
Book Value: ₹315
📈 Technical Insights
Trend: The stock has shown resilience with strong long-term performance over three years, despite recent challenges compared to the Sensex.
Support Levels: ₹662.35, ₹650.00
Resistance Levels: ₹680.35, ₹700.00
📌 Key Takeaways
Recent Performance: Tata Motors' shares rose over 2% today, snapping a two-day decline, following the announcement that Jaguar Land Rover (JLR) had commenced a phased restart of its operations after a cyberattack.
Analyst Sentiment: Despite recent volatility, Tata Motors remains a top pick among analysts for long-term investment.
INFY 1D Time frame📊 Daily Snapshot
Closing Price: ₹1,484.65
Day’s Range: ₹1,476.50 – ₹1,502.70
Previous Close: ₹1,494.60
Change: Down –0.64%
52-Week Range: ₹1,307.00 – ₹2,006.45
Market Cap: ₹6.17 lakh crore
P/E Ratio (TTM): 22.62
Dividend Yield: 2.90%
EPS (TTM): ₹65.63
Beta: 1.09 (indicating moderate volatility)
🔑 Key Technical Levels
Support Zone: ₹1,469 – ₹1,473
Resistance Zone: ₹1,485 – ₹1,490
Pivot Point: ₹1,480.97 (Fibonacci)
All-Time High: ₹2,006.45
📈 Technical Indicators
RSI (14-day): 44.45 – approaching oversold territory, suggesting potential for a rebound.
MACD: Negative at –6.34, indicating bearish momentum.
Moving Averages: Trading below the 50-day (₹1,511.06) and 200-day (₹1,495.15) moving averages, indicating a bearish trend.
Stochastic RSI: Between 45 and 55, indicating a neutral condition.
CCI (20): Between –50 and 50, implying a neutral condition.
📉 Market Sentiment
Recent Performance: Infosys experienced a decline of 0.64% on September 25, 2025, underperforming the broader market.
Volume: Trading volume was significantly higher than its 20-day average, indicating increased investor activity.
📈 Strategy (1D Timeframe)
1. Bullish Scenario
Entry: Above ₹1,485
Stop-Loss: ₹1,469
Target: ₹1,490 → ₹1,500
2. Bearish Scenario
Entry: Below ₹1,469
Stop-Loss: ₹1,485
Target: ₹1,460 → ₹1,450
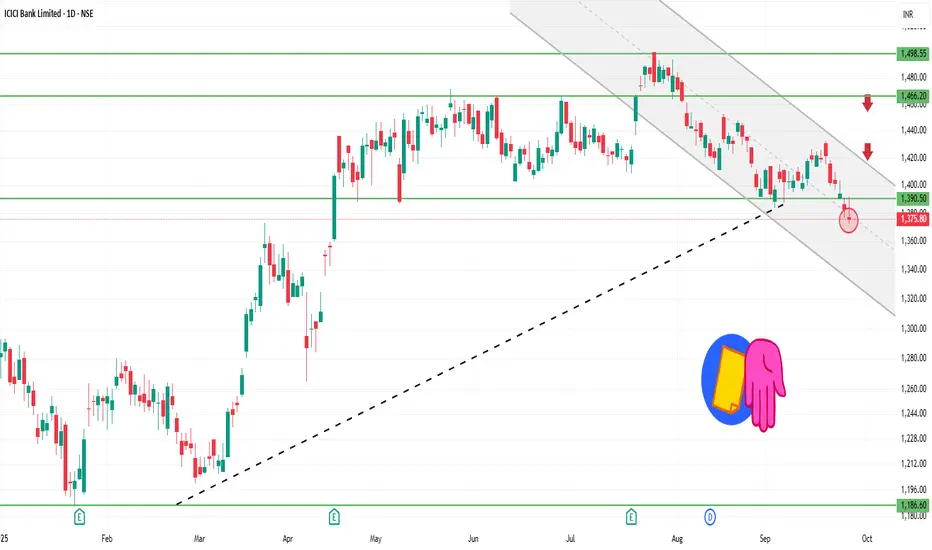
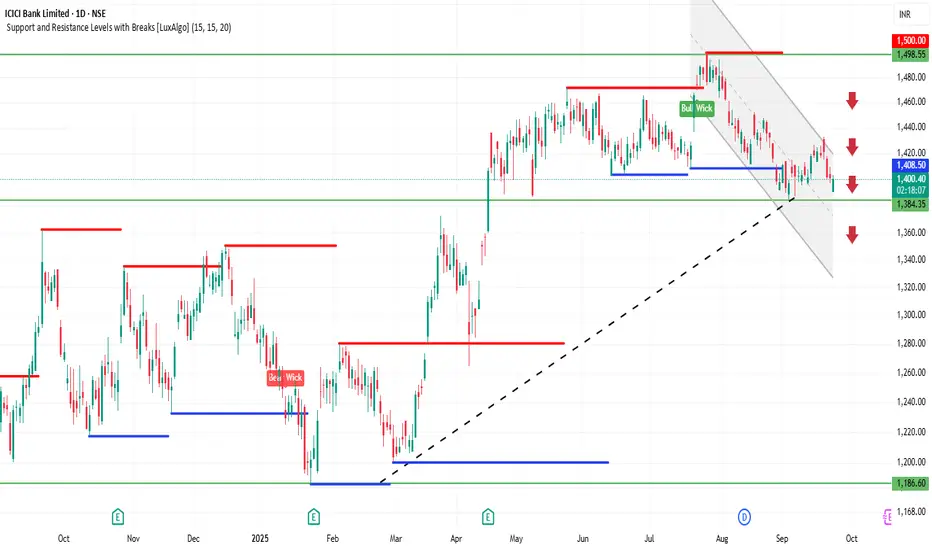
ICICIBANK 1D Time frame📊 Daily Snapshot
Closing Price: ₹1,375.50
Day’s Range: ₹1,371.80 – ₹1,391.50
Previous Close: ₹1,382.70
Change: Down –0.52%
52-Week Range: ₹1,018.85 – ₹1,494.10
Market Cap: ₹9.7 lakh crore
P/E Ratio: 20.5
Dividend Yield: 1.2%
EPS (TTM): ₹67.00
Beta: 1.05 (moderate volatility)
🔑 Key Technical Levels
Support Zone: ₹1,370 – ₹1,375
Resistance Zone: ₹1,390 – ₹1,400
All-Time High: ₹1,494.10
📈 Technical Indicators
RSI (14-day): 34.1 – approaching oversold territory, suggesting potential for a rebound.
MACD: Negative, indicating bearish momentum.
Moving Averages: Trading below the 150-day moving average, indicating a bearish trend.
Candlestick Patterns: Recent formation of a Bearish Engulfing pattern, suggesting potential for further downside.
📉 Market Sentiment
Recent Performance: ICICI Bank has experienced a decline for the fifth consecutive session, underperforming the broader market.
Sector Performance: The NIFTY BANK index also closed lower, reflecting sector-wide weakness.
📈 Strategy (1D Timeframe)
1. Bullish Scenario
Entry: Above ₹1,390
Stop-Loss: ₹1,370
Target: ₹1,405 → ₹1,420
2. Bearish Scenario
Entry: Below ₹1,370
Stop-Loss: ₹1,390
Target: ₹1,355 → ₹1,340
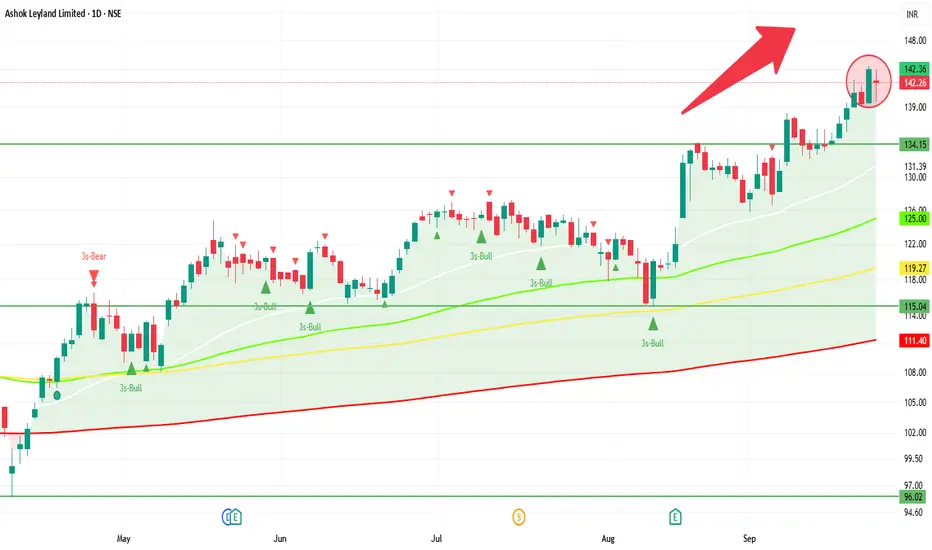
ASHOKLEY 1D Time frame📊 Today's Performance
Closing Price: ₹142.26
Day’s Range: ₹139.60 – ₹143.99
Previous Close: ₹144.04
Change: Down ~ –1.24%
52-Week Range: ₹95.93 – ₹144.50
Volume: ~36.96 million shares
Market Cap: ₹83,556 crore
P/E Ratio: 26.05
Dividend Yield: 4.39%
EPS (TTM): ₹5.46
🔍 Key Technical Levels
Support Zone: ₹139.60 – ₹140.00
Resistance Zone: ₹143.50 – ₹144.50
All-Time High: ₹144.50
📈 Strategy (1D Timeframe)
1. Bullish Scenario
Entry: Above ₹143.50
Stop-Loss: ₹141.50
Target: ₹146.00 – ₹148.00
2. Bearish Scenario
Entry: Below ₹139.60
Stop-Loss: ₹141.50
Target: ₹136.00 – ₹134.00
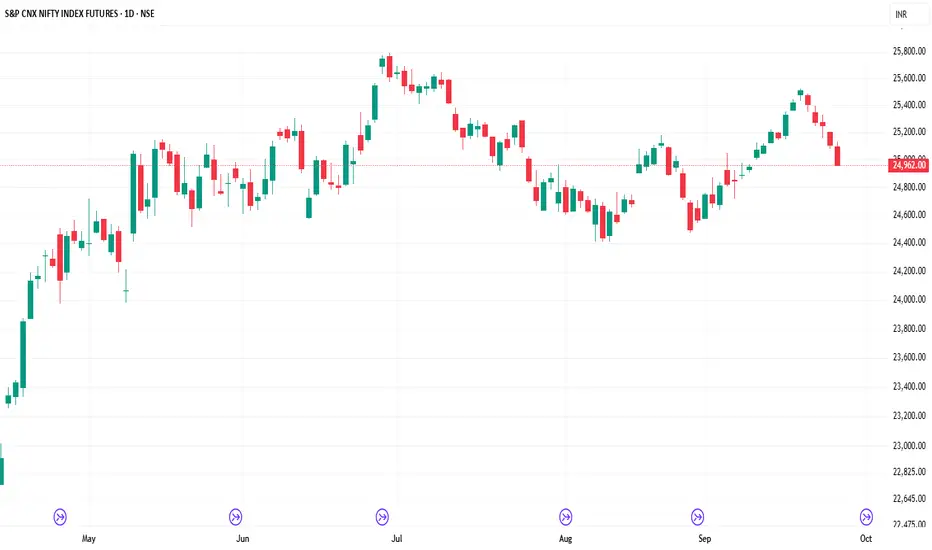
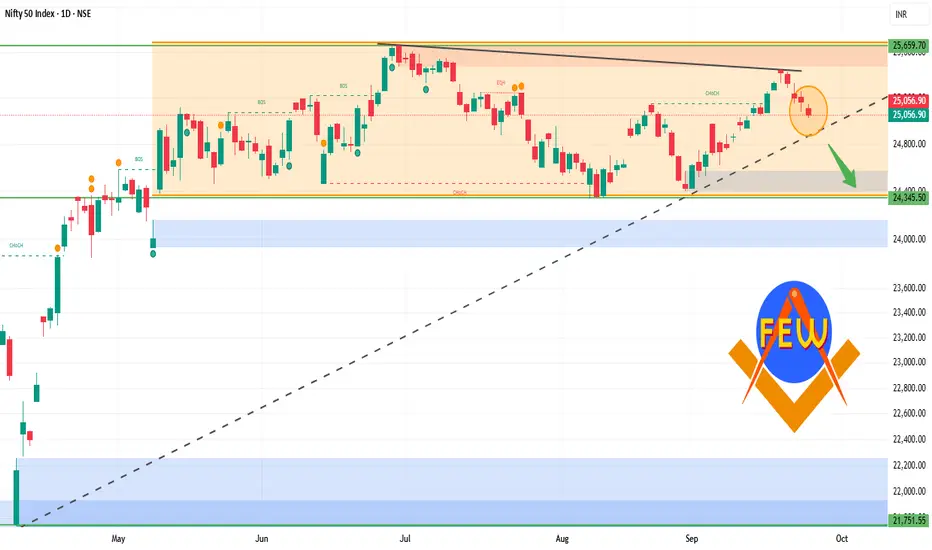
NIFTY 1D Time frame📊 Today’s Nifty Performance
Opening: Around 25,109
Closing: Around 25,057
Result: Market slipped about –52 points (–0.45%)
Range: High near 25,150, Low near 25,027
👉 If you were long (buy side) from the open and held till close → small loss (~52 points).
👉 If you were short (sell side) from the open and held till close → small profit (~52 points).
🎯 Key Levels
Support Zone: 25,000 – 25,020
Resistance Zone: 25,130 – 25,150
📝 Strategy
For Intraday Traders
Sell near resistance (25,130–25,150) with stop-loss just above 25,160.
Buy near support (25,000–25,020) with stop-loss just below 24,980.
For Swing Traders (2–3 days)
If Nifty sustains above 25,150, expect bounce toward 25,250+.
If Nifty breaks below 25,000, expect fall toward 24,900.
Risk Management
Use stop-loss always.
Don’t risk more than 1% of your capital on one trade.
Trail stop-loss if trade goes in your favor.
ICICIBANK 1D Time frame📍 Today’s Expected Range (Intraday Approximation)
Expected High: ₹1,403–₹1,410
Expected Low: ₹1,391–₹1,385
These are approximate intraday levels. Actual prices may fluctuate slightly due to market volatility.
🔍 Key Points
Current price: ₹1,400–₹1,401, close to resistance.
If price breaks above ₹1,410 with strong volume → bullish momentum likely.
If price drops below ₹1,385 → short-term correction or pullback possible.
📊 Suggested Trading Strategy
Bullish Scenario
If ICICI Bank breaks ₹1,403–₹1,410, you can buy, targeting ₹1,420–₹1,430.
Stop-loss: ₹1,395
Bearish Scenario
If ICICI Bank drops below ₹1,385, you can sell/short, targeting ₹1,375–₹1,370.
Stop-loss: ₹1,390
Range-Bound / Sideways
If price trades between ₹1,385–₹1,403, it’s better to wait and avoid trading until a clear breakout occurs.
💡 Summary
Resistance Zone: ₹1,403–₹1,410
Support Zone: ₹1,385–₹1,391
Strategy: Trade in the direction of the breakout, and always use stop-loss to manage risk.
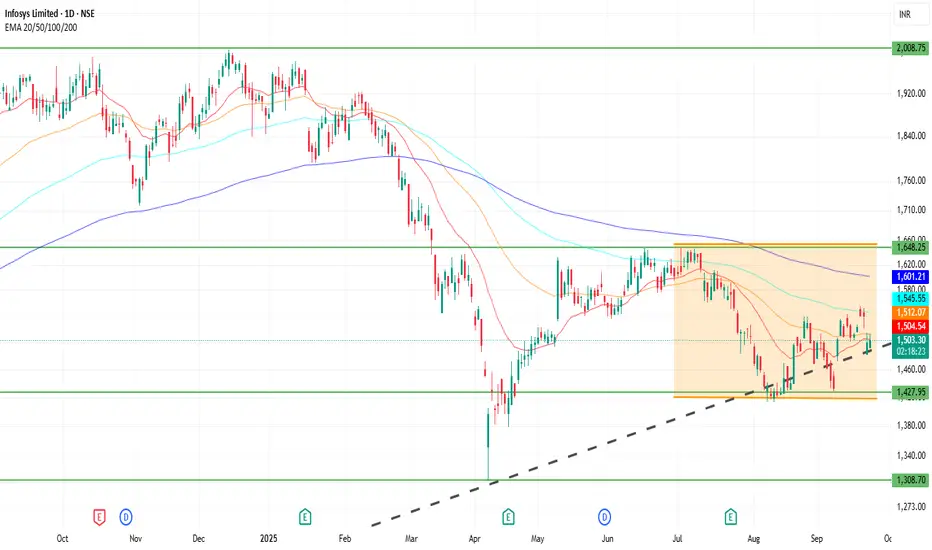
INFY 1D Time frame📍 Current Price & Range
Current Price: ₹1,503.00
Day’s High / Low: ₹1,540.20 / ₹1,499.50
52-week High / Low: ₹2,006.45 / ₹1,307.00
🔍 Key Levels
Immediate Resistance: ₹1,540–₹1,550
Next Resistance: ₹1,600
Immediate Support: ₹1,450–₹1,460
Strong Support: ₹1,400
📊 Indicators & Momentum
Short-term Trend: Neutral to slightly bearish; recent price action shows hesitation near resistance levels.
Volume: Higher-than-average trading volume observed, indicating increased investor interest.
Relative Strength Index (RSI): Approaching overbought territory; caution advised for potential pullbacks.
Moving Averages: Price trading below key moving averages; may act as resistance if price approaches them.
🔮 Possible Scenarios
Bullish Breakout: If INFY sustains above ₹1,550 with strong volume, it could target ₹1,600 and higher levels.
Sideways Consolidation: Price may trade between ₹1,450 and ₹1,550, awaiting a catalyst for direction.
Bearish Reversal: A drop below ₹1,450 could lead to a retest of the 52-week low around ₹1,307.
⚠️ Outlook
At the current level of ₹1,503.00, Infosys is at a critical juncture. A decisive move above ₹1,550 could open up upside potential, while a failure to hold above ₹1,450 may lead to further downside. Monitoring volume and RSI for confirmation is recommended.
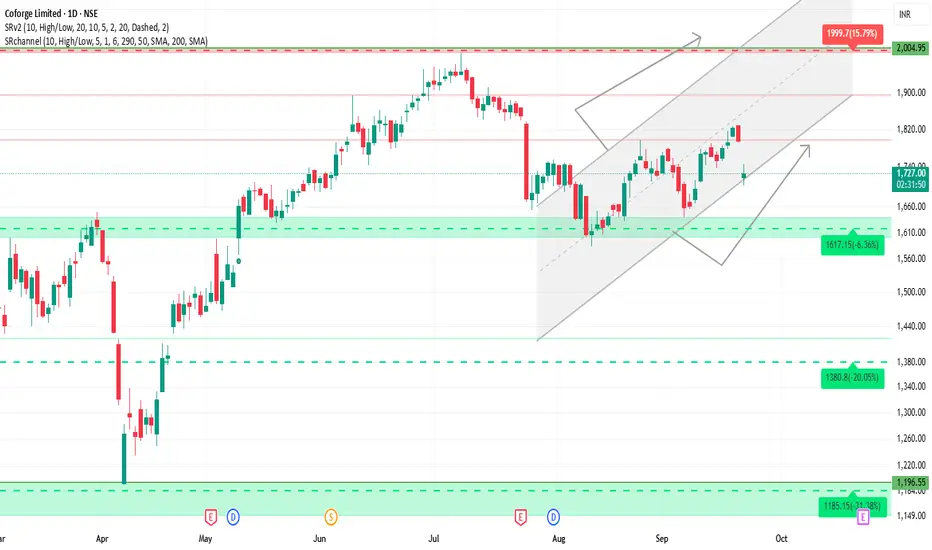
COFORGE 1D Time frame🔍 Current Price
Trading around ₹1,720 – ₹1,740
📊 Technical Indicators
Trend: Bearish — price trading below short and medium-term moving averages.
RSI (14): Around 26–27, showing oversold zone.
MACD: Negative, indicating bearish momentum.
ADX: Strong, meaning the downtrend has solid strength.
⚙️ Key Levels
Immediate Resistance 1: ₹1,780
Resistance 2: ₹1,820 – ₹1,840
Immediate Support 1: ₹1,700
Support 2: ₹1,650
Deeper Support: ₹1,620
🧮 Base Strategy
Long Setup:
Entry: Near ₹1,700 if reversal signals appear
Stop Loss: Below ₹1,650
Targets: ₹1,780 first, then ₹1,820+
Short Setup (Reversal):
If price fails near ₹1,780 zone
Targets: ₹1,700, then ₹1,650
Breakout Setup:
If price sustains above ₹1,820 – ₹1,840 with volume
Upside can extend toward higher levels
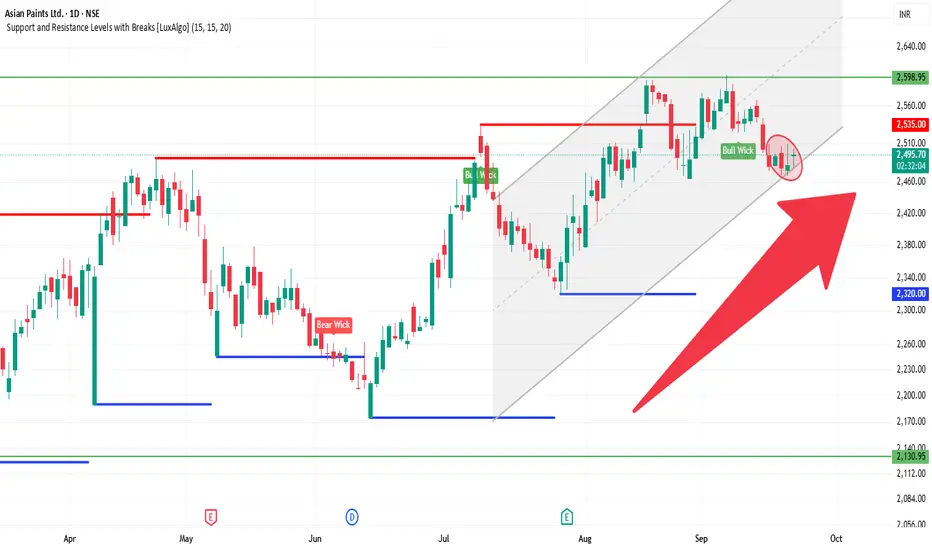
ASIANPAINT 1D Time frame🔍 Current Status
The stock is trading around ₹2,490 – ₹2,500
Recent price action has been somewhat mixed — not a strong trend, some resistance in higher zones.
🧮 Trade Strategy Ideas
Long Setup:
If price holds above ~₹2,460 and shows reversal candlestick or volume strength.
Target resistance around ₹2,505-₹2,528.
Stop-loss could be placed just below ₹2,440 or so (to protect against breakdowns).
Short / Pullback Setup:
If price gets rejected near resistance around ₹2,505-₹2,528 and bearish candlestick forms.
Potential downside toward ~₹2,460 first, then further to ~₹2,420.
Breakout Setup:
If price breaks above ~₹2,528 with good volume, could aim for ~₹2,546 or higher.
Must confirm with strength / follow-through.
✅ Summary: Asian Paints is in a consolidation / neutral phase. Key to watch is how it reacts around the resistance zone ~₹2,505-₹2,528. Holding above support ~₹2,460 is important. A clear breakout gives upside, else downside risk remains.
SENSEX 1D Time frame🔍 Current Market Snapshot
Current Level: 82,439.48
Day’s Range: 82,151.07 – 82,583.16
Previous Close: 82,626.23
Market Sentiment: Neutral to mildly bearish
📊 Technical Indicators
Moving Averages: The Sensex is trading slightly below its short-term moving averages, indicating potential resistance.
RSI (14): Approximately 50, suggesting a neutral stance with no clear overbought or oversold conditions.
MACD: Neutral, with the MACD line and signal line close together, indicating indecision in market momentum.
🧮 Strategy / Trade Ideas
Long Setup:
Entry: Consider entering near support levels (~82,200) if bullish reversal signals appear.
Stop Loss: Place below 82,000 to manage risk.
Target: First resistance around 82,600, then 82,900.
Short Setup:
Entry: If price fails to break above resistance (~82,600) and shows signs of reversal.
Stop Loss: Above 82,900.
Target: Downside toward 82,200, then 81,800
