Nifty Healthcare: Pressure Building for a Big MoveNSE:NIFTY_HEALTHCARE
Nifty Healthcare – Breakout Watch Near Multi-Year Resistance
Technical Setup
Index retesting the 14,800–15,000 resistance that has capped prices since 2024.
Tight weekly candles show supply absorption.
Higher lows indicate steady accumulation.
A weekly close above 15,000 can open a move toward 15,800–16,200.
Fundamental View
Defensive sector gaining interest in a volatile macro phase.
Earnings improving with better margins and stable domestic demand.
Pharma exports recovering; US generics cycle turning positive.
Sector valuations still reasonable after a long consolidation.
Idea
Bullish above: 15,000 (weekly close).
Targets: 15,800 / 16,200.
Invalidation: Below 14,300.
⚠️ Disclaimer:
This analysis is for educational and informational purposes only.
We are not SEBI-registered analysts or advisors.
This is our personal view based on available data and market trends.
Please consult your SEBI-registered investment advisor before making any investment or trading decisions.
You are solely responsible for any financial decisions you make based on this content.
========================
Trade Secrets By Pratik
========================
MAXHEALTH

MAXHEALTH – Symmetrical Triangle Breakout________________________________________________________________________________
🧠 MAXHEALTH – Symmetrical Triangle Breakout
📌 Chart Overview
Symbol: `MAXHEALTH` (NSE)
Timeframe: 1D (Daily)
Pattern Identified: 🔺 Symmetrical Triangle
Breakout Confirmation: ✅ Bullish Engulfing
Volume on Breakout: 1.61M (above average)
________________________________________________________________________________
📊 Technical Breakdown (For Educational Use Only)
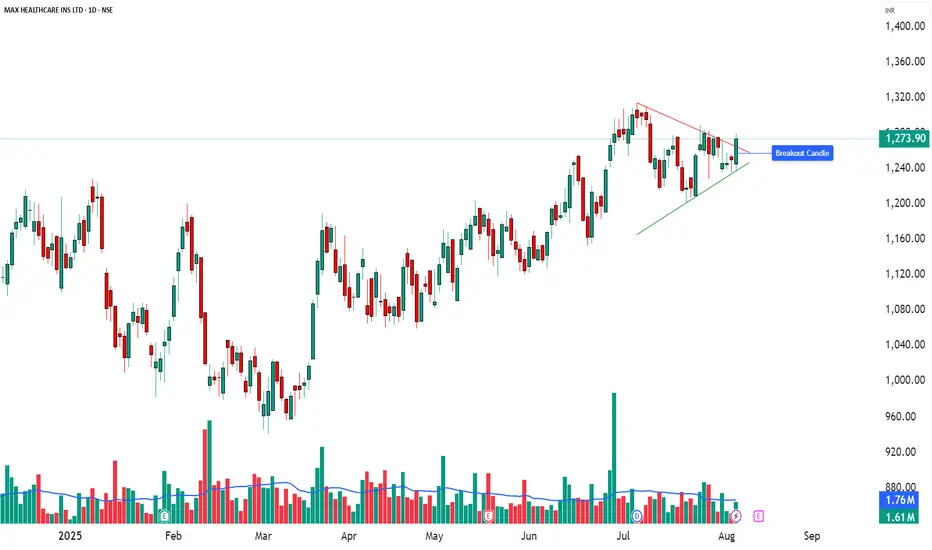
🔹 Between June and August, MAXHEALTH consolidated into a symmetrical triangle, a classic pattern suggesting price compression.
🔹 A bullish breakout occurred with a strong engulfing candle on above average volume — a potential early signal of trend continuation.
🔹 The breakout occurred near the apex of the triangle, increasing its validity.
💡 Such breakouts are commonly followed by retests or follow through moves. This post is intended to help learners spot and study such setups.
________________________________________________________________________________
📌 Key Reference Levels (Not Trade Levels)
As per the current chart structure, key reference levels for MAXHEALTH include resistance zones at ₹1,290.1, ₹1,306.3, and ₹1,332.6, which may act as potential supply areas in case of continued upward momentum. On the downside, important support zones are observed near ₹1,247.6, ₹1,221.3, and ₹1,205.1, where price could find buying interest if a pullback occurs. These levels are shared purely for technical context and educational study, not as trade recommendations.
________________________________________________________________________________
🧠 Learning Takeaways
✅ Symmetrical Triangle: Indicates indecision and tightening price range. Breakout direction often sets near term tone.
✅ Bullish Engulfing Candle: A strong reversal pattern when formed post consolidation or at trendline breaks.
✅ Volume Confirmation: Adds credibility to breakout strength — look for rising volume on breakouts.
🔍 Always watch for follow up candles, possible pullbacks (retest entries), or invalidation zones to study trade structure in real world setups.
________________________________________________________________________________
⚠️ Disclaimer & Educational Note
This content is strictly for educational and research purposes only. I am not a SEBI-registered advisor, and no buy/sell recommendations are being provided. All insights are based on personal analysis and experience and are not financial advice.
📘 This setup illustrates how combining price action (candlesticks), support/resistance zones, volume, and indicators like RSI or MACD can help build conviction in trades. However, trading—especially in derivatives like options—involves high risk, and losses can exceed the initial investment.
👉 Always do your own research and consult a SEBI-registered advisor before taking any position.
👉 Use strict risk management and only trade with capital you can afford to lose.
The author assumes no liability for any losses incurred.
By engaging with this content, you agree to these terms.
________________________________________________________________________________
💬 Found this helpful?
Drop your thoughts, questions, or insights in the comments below ⬇️ — let’s learn together!
🔁 Share this post with your trading friends and community — help them discover clean charts, structured setups, and zone-based learning.
✅ Follow simpletradewithpatience for clear setups, educational content, and a no-nonsense approach to price action, supply-demand zones, and risk-managed trades.
🚀 Trade with patience. Trust your charts. Stay clear-headed.
Because the goal is not just to trade — it's to trade better.
Be Self-Reliant | Trade with Patience | Learn with Charts & Zones 📊
MaxHealth good to keep on radar NSE:MAXHEALTH
Good to keep on the radar
Always respect SL & position sizing
===================
Trade Secret By Pratik
===================
Disclaimer
SEBI UNREGISTERED
This is our personal view and this analysis
is only for educational purposes
Please consult your advisor before
investing or trading
You are solely responsible for any
decisions
you take on basis of our research

MAXHEALTH | Inverted Head and Shoulder | Breakout | ATH
## 🩺 **MAXHEALTH – Inverted Head and Shoulder Breakout Analysis**
### 📊 **Pattern**:
✅ **Inverted Head and Shoulder** formation confirmed
* Base support near: ₹936
* Breakout zone: ₹1,200
* Current price: ₹1,232.80
* **Volume spike** on breakout = bullish confirmation
---
### 📐 **Breakout Target Calculation**
* Depth of Cup: **₹255.20**
* Target = ₹1,200 + ₹255.20 = **₹1,455.20**
📌 **Target Area marked** on chart near ₹1,455
---
### 🔍 **Key Technical Insights**
* **Resistance turned support**: ₹1,200 zone
* Strong **volume breakout** above resistance
* Handle was short & tight, indicating bullish strength
* RSI likely above 60 (momentum favoring bulls – though not shown here)
---
### 🎯 **Levels to Watch**
* **Support**: ₹1,200 (neckline), then ₹1,120
* **Resistance**: ₹1,300 minor, **₹1,455** is the measured move target
---
### 📈 **Bias**: **Bullish**
* Price + Volume + Pattern = Valid **Breakout**
* Position traders can aim for **₹1,455** with SL ₹1,200
---

MAXHEALTH | Inv HEAD AND SHOULDER | WACHLISTChart patterns shown for MAX Healthcare (NSE: MAXHEALTH):
---
🔍 **Pattern Observed:**
The chart showcases an INV HEAD AND SHOULDER pattern in progress, which is a bullish continuation pattern.
---
🔹 **Key Levels:**
* **resistance (neckline breakout)**: \~₹1,195–₹1,227 zone
* **Current price:** \~₹1,194.60

Max Healthcare Institute Ltd - Breakout Setup, Move is ON...#MAXHEALTH trading above Resistance of 991
Next Resistance is at 1392
Support is at 721
Here is previous chart:
Chart is self explanatory. Levels of breakout, possible up-moves (where stock may find resistances) and support (close below which, setup will be invalidated) are clearly defined.
Disclaimer: This is for demonstration and educational purpose only. This is not buying or selling recommendations. I am not SEBI registered. Please consult your financial advisor before taking any trade.

MAXHEALTH - Price Observation & OverviewOverview & Observation:
1. Trendline trap.
2. Good volume breakout.
3. Strength in buying.
4. Broke recent ATH.
Trade Plan:
1. Best entry was around 850. One more aggressive entry can be planned but the risk will be higher in that case.
- Stay tuned for further insights, updates and trade safely!
- If you liked the analysis, don't forget to leave a comment and boost the post. Happy trading!
Disclaimer: This is NOT a buy/sell recommendation. This post is meant for learning purposes only. Please, do your due diligence before investing.
Thanks & Regards,
Anubrata Ray

MAXHEALTH - Ichimoku Breakout📈 Stock Name - Max Healthcare Institute Ltd
🌐 Ichimoku Cloud Setup:
1️⃣ Today's close is above the Conversion Line.
2️⃣ Future Kumo is Turning Bullish.
3️⃣ Chikou span is slanting upwards.
All these parameters are shouting BULLISH at the Current Market Price and even more bullishness anticipated AFTER crossing 900.
🚨 Disclaimer: This is not a Buy or Sell recommendation. It's for educational purposes and a guiding light to learn trading in the market.
#CloudTrading
#IchimokuCloud
#IchimokuFollowers
#Ichimokuexpert
Excited about this analysis? Share your thoughts in the comments below!
👍 Like, Share, and Subscribe for daily market insights! 🚀
#StockAnalysis #MarketWatch #TradingEducation #ichimoku

MAXHEALTHMAXHEALTH:- Triangle pattern has formed, wait for the breakout.
Hello traders,
As always, simple and neat charts so everyone can understand and not make it too complicated.
rest details mentioned in the chart.
will be posting more such ideas like this. Until that, like share and follow :)
check my other ideas to get to know about all the successful trades based on price action.
Thanks,
Ajay.
keep learning and keep earning.

Unveiling the Potential in MAXHEALTH's Current TrendWelcome, traders! Today, we're diving into a fascinating analysis of MAXHEALTH, a stock that's showing some intriguing movements on the charts.
Understanding the Current Situation
MAXHEALTH has been a topic of interest lately, especially as it comes down from its all-time high.
Our focus will be on its behaviour around the 125 minute demand zone.
We'll analyse its movement on different time frames to get a comprehensive view.
Technical Analysis of MAXHEALTH
On the the daily chart, MAXHEALTH displays a clear uptrend. Notably, the price is reacting from the 20-day Exponential Moving Average (EMA 20) and an uptrend line. This confluence of indicators suggests a strong bullish momentum.
Furthermore, in the weekly chart, there are no significant supply zones overhead, indicating a relatively clear path for potential upward movements.
The Power of Demand Zones
In our 125 minute chart, we observe a robust demand zone. After this zone was established, MAXHEALTH broke its previous all-time high. The price has now returned to this demand zone and is showing positive reactions.
Trading Strategy and Risk Management
Considering the current scenario, planning a buy trade seems promising. Your stop loss (SL) should be placed just below the demand zone. As there are no immediate supply zones on the HTF, one could consider riding the rally, periodically trailing the stop loss.
For those targeting specific gains, the first target could be the all-time high of MAXHEALTH.
Please note that this analysis is for educational purposes only, and I am not a SEBI registered analyst.

Max Healthcare Max Healthcare showing good Structure for Further rally, Good for Swing & Long Term Investment

Max healthcare longMax healthcare long above 550
CMP 545
stoploss 495 (Daily candle closing basis)
Swing trade
Target 1 590
Target 2 617
Long term
Target 1 650
Target 2 700
Excellent Q1 results
capex is good.

Max Healthcare Clean BreakoutNSE:MAXHEALTH has given a clean breakout and a simple stop loss at 620 can be followed for this share. Fundamentally we can see Hospital Stocks doing really well (business) and the numbers are definitely translating into stock price performance.

MAXHEALTHNote:
1. Views are personal and for educational purposes only. Recheck and take the trade as per your RR.
2. Always remember SL is your lifeline, not the big target...
3. Follow us for more patterns and like, share so that we feel it is helpful to many and share more patterns...
3. Views given here is not a tip rather it is for educational purpose... Aftermarket opens, the condition might change so learn to handle different conditions...
Keep an eye ladies and gentlemen. Cheers and Happy Trading

MAXHEALTH - Ichimoku Bullish Breakout Stock Name - Max Healthcare Institute Ltd
Ichimoku Cloud Setup :
1). Today's close is above the Conversion Line
2). Future Kumo is Turning Bullish
3). Chikou span is slanting upwards
All these parameters are showing bullishness at Current Market Price
and more bullishness AFTER crossing 553
#This is not Buy and Sell recommendation to any one. This is for education purpose and a helping hand to learn trading in Market.
# Cloud Trading
# Ichimoku Cloud
# Ichimoku Followers
I hope you all like my analysis.
Please do share your thoughts into comment section.
Please give a like, share & subscribe for daily analysis.

MAXHEALTH - Will be enter in UNCHARTED territoryBullish on MAXHEALTH
Will be enter in UNCHARTED territory
Buy at 441
SL 428
Tgt 490

BREAKOUT IN MAXHEALTHBUY - MAX HEALTHCARE INSTITUTE
CMP - Rs. 471
Target - Rs. 710
.
.
Technicals -
1) Bullish Symmetrical Triangle BO
2) Multiple Resistance BO
.
.
Fundamentals -
1) Financial Analysis:
Looking at the financial performance of Max Healthcare, we can see that the company has shown consistent growth over the years. The revenue of the company has increased from INR 2,880.56 crore in FY2019 to INR 3,247.76 crore in FY2021, which is a CAGR of 12.6%. The company has also been able to maintain its gross margins at around 27-28% over the past three years. However, the company has been reporting losses for the past three years due to high finance costs and depreciation expenses.
The company's debt-to-equity ratio stands at 1.5, which is higher than the industry average of 0.6. The high debt levels can be attributed to the company's expansion plans and investments in new hospitals and diagnostic centers. However, the company has been able to service its debt obligations without any major issues.
2) Valuation:
Max Healthcare's current market capitalization is around INR 7,000 crore, and the stock is trading at a P/E ratio of around 108x. This valuation seems high compared to the industry average of 28x. However, the high P/E ratio can be justified by the company's growth prospects and the potential for higher profitability in the future.

Breakout in Max Healthcare Institute Ltd...Chart is self explanatory. Levels of breakout, possible up-moves (where stock may find resistances) and support (close below which, setup will be invalidated) are clearly defined.
Disclaimer: This is for demonstration and educational purpose only. This is not buying or selling recommendations. I am not SEBI registered. Please consult your financial advisor before taking any trade.

MAXHEALTH will hit the Target of 471Stay HOLD and enjoy the flight of MAXHEALTH
Is going to hit the price of 471
CMP 427

MAXHEALTH - Ichimoku Bullish Breakout Stock Name - Max Healthcare Institute Ltd
Ichimoku Cloud Setup :
1). Today's close is above the Conversion Line
2). Future Kumo is Turning Bullish
3). Chikou span is slanting upwards
All these parameters are showing bullishness at Current Market Price
and more bullishness AFTER crossing 460
#This is not Buy and Sell recommendation to any one. This is for education purpose and a helping hand to learn trading in Market.
# Cloud Trading
# Ichimoku Cloud
# Ichimoku Followers
I hope you all like my analysis.
Please do share your thoughts into comment section.
Please give a like, it motivates me to do analysis.

MAX HEALTH CARE |SHORT TERM/POSITIONAL |MAX HEALTH
cmp -430
Sl 400
Target 550- 600+
Breakout coming soon...company with good fundamentals... Can be a good risk reward trade....


Symmetrical triangle breakout in Max HealthChart -> Max Healthcare Weekly
After a beautiful uptrend, a consolidation was needed and that is what exactly has happened in Max Healthcare. A picture-perfect symmetrical triangle!
CMP: 413
Targets: 430, 458, and more
SL: 375, weekly close
Disclaimer: This is for educational purposes only, not any recommendations to buy or sell. As I am not SEBI registered, please consult your financial advisor before taking any action.
