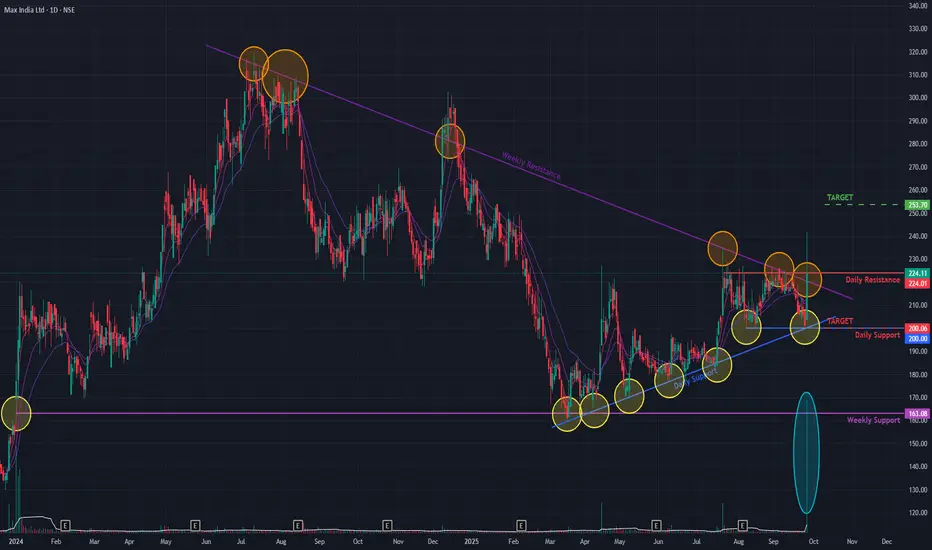
Max India (D) - Executes a Powerful Dual-Resistance BreakoutMax India has shown a significant bullish development, decisively breaking out of two key resistance levels today. The stock breached both a long-term angular resistance trendline from July 2024 and a short-term resistance from July 2025. This powerful move was confirmed by a massive surge of +14.95% on the back of exceptionally high trading volume, with the stock closing at ₹224.11 .
This breakout signals a potential acceleration of the reversal that began in March 2025, following a prolonged downtrend from the stock's All-Time High in July 2024.
A Mix of Bullish Indicators 👍
The technical landscape shows a confluence of positive signals, although some are still developing:
- Broad Momentum: The Relative Strength Index (RSI) is in a bullish crossover state on both the weekly and daily charts, confirming strong momentum.
- Long-Term Strength: A Golden Crossover appeared on the daily chart a few days ago, providing a strong long-term bullish signal.
- Developing Confirmation: While short-term Exponential Moving Averages (EMAs) show a bullish crossover on the weekly chart, they have not yet confirmed this on the daily timeframe, suggesting immediate-term momentum is still catching up.
Outlook: Awaiting Confirmation
While the breakout is powerful, re-confirmation is prudent. A common technical event is a retest of the broken resistance levels as new support.
- Bullish Case 📈: If the momentum continues and the breakout is sustained, the next potential target on the upside is the ₹250 resistance level.
- Bearish Case 📉: If the breakout fails to hold and momentum subsides, the stock could pull back to find support near the ₹200 level.
MAXINDIA
MAXIND - Weekly Chart Analysis, CMP-212.65Stock coming out of 21 week base of 34%range on a good volumes and is now sustaining above it for 2 weeks. Down week volumes are low showing strength.
170 shall act as a support as there is weekly gap away formed 170-172.65. A weekly close and a follow up thereafter shall make our view invalid.
248 - 280 - 321 - 440 are the levels that can be tested over the long term.
Disclaimer: This is just a study and shared here for educational purpose. It is not a buy/sell recommendation in any way. If you intend to trade this counter then do your own due diligence and trade at your own risk.

Max India Ltd - Long Setup, Move is ON...#MAXIND trading above Resistance of 131.50
Next Resistance is at 174
Support is at 92.70
Here is previous chart:
Chart is self explanatory. Entry, Resistances and Support are mentioned on the chart.
Disclaimer: This is for demonstration and educational purpose only. This is not buying or selling recommendations. I am not SEBI registered. Please consult your financial advisor before taking any trade.


MAXIND - Ichimoku Bullish Breakout Stock Name - Max India Ltd
Ichimoku Cloud Setup :
1). Today's close is above the Conversion Line
2). Future Kumo is Turning Bullish
3). Chikou span is slanting upwards
All these parameters are showing bullishness at Current Market Price
and more bullishness AFTER crossing 106.
#This is not Buy and Sell recommendation to any one. This is for education purpose and a helping hand to learn trading in Market.
# Cloud Trading
# Ichimoku Cloud
# Ichimoku Followers
I hope you all like my analysis.
Please do share your thoughts into comment section.
Please give a like, it motivates me to do analysis.

MAXIND - Ichimoku Bullish Breakout Stock Name - Max India Ltd
Ichimoku Cloud Setup :
1). Today's close is above the Conversion Line
2). Future Kumo is Turning Bullish
3). Chikou span is slanting upwards
All these parameters are showing bullishness at Current Market Price
and more bullishness AFTER crossing 417
#This is not Buy and Sell recommendation to any one. This is for education purpose and a helping hand to learn trading in Market.
# Cloud Trading
# Ichimoku Cloud
# Ichimoku Followers
I hope you all like my analysis.
Please do share your thoughts into comment section.
Please give a like, it motivates me to do analysis.

MAX INDIACall it Cup and Handle Pattern or an inverted Head and Shoulder pattern , the impact of the outcome is more or less the same.
Ride the pattern.


MaxIndia old support now Resistance @in_tradingviewNSE:MAXINDIA
old support is now Resistance
stand positive in negative market but with less vol.
may fall from 65 66
if close above 65 then we may see 72+
or
one can short near 65 for 60


Max India trying to bottom outMaxindia is trying to bottom out. Weekly positive #divergence in #RSI observed since April 2018 as prices made lower lows (last low of 68.75 in June 2018). Today's daily #candle made low of 75.30 and closed at 83.05. Will get interesting if it closes above 88. #watchlist
