Mazagon Dock Shipbuilders Ltd. - Stock AnalysisDate : 17-Sep-2025
LTP : Rs. 2,997
Technical View:
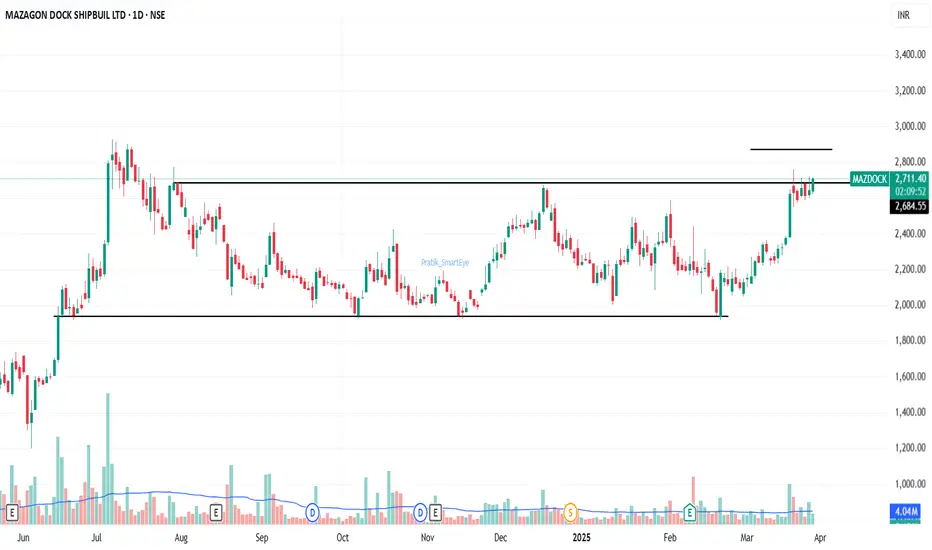
• NSE:MAZDOCK is in primary uptrend since Apr 2024 and was recently going through it's secondary downtrend within the primary uptrend.
• From it's all time high of 3,775 on 29-May-2025, it has retraced 31% to 2,589 on 1-Sep-2025 which is also close to Fibonacci retracement level 0.786 placed at 2,537.
• NSE:MAZDOCK has breakout from it's secondary downtrend on 10-Sep-2025. Volume has also increased in last few sessions.
• NSE:MAZDOCK has closed above 20 DEMA and 50 DEMA on 12-Sep-2025 and is trading above 20 DEMA and 50 DEMA since last few sessions.
• MACD has crossed over 0 and entered into bullish zone. It is trading at 29.87.
• RSI has crossed over 50 and trading in buy zone at 67.54.
• Both MACD and RSI are showing positive divergence, indicating trend reversal.
• Looking good to start a new swing from here.
• Resistance Levels : (R1) Rs. 3,369 --> (R2) Rs. 3,775 --> (R3) Rs. 4,500
• Support Level : Rs. 2,589
If you have liked this analysis, please Like/Boost this idea and follow me for more ideas.
Disclaimer : I am not a SEBI registered analyst/consultant and not recommending anyone to take any BUY or SELL position in stock market. Investing in stock market is risky and one should do a self analysis and validation before investing in stock market. My ideas are published for learning purpose only and are available to everyone at no cost/charge.
Mazagon

Elliott Wave Analysis & Technical Cross-VerificationsHello Friends, Welcome to RK_Chaarts,
Today, we're going to learn how to validate our Elliott Wave analysis by identifying additional factors that support our directional bias. Once we've plotted our Elliott Wave counts and identified a direction, we want to confirm whether other technical indicators and patterns align with our analysis. This helps strengthen our conviction in our directional bias and provides additional confidence in our trading decisions. Today, we'll explore some key points, including Elliott Wave theory, Exponential moving averages, Trend line breakouts, and Invalidation levels, as well as projected targets. And please note that this post is shared solely for educational purposes. It is not a trading idea, tip, or advisory. This is purely an Educational post.
Elliott Wave Theory structure & wave Counts
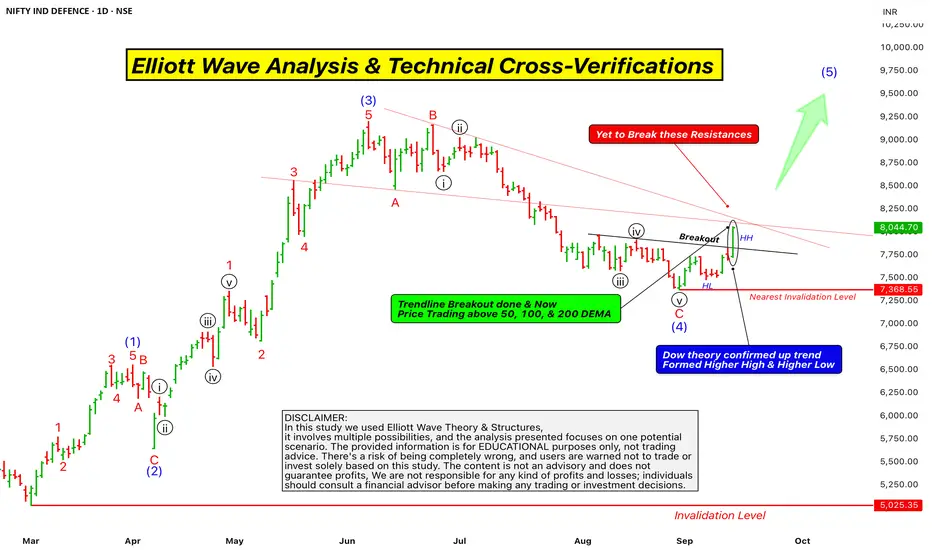
Here chart we are using Nifty India Defence sector, which is an index chart. We are analyzing it using Elliott Wave theory. It's very clear that from the March 2025 bottom, we've identified a clear Wave (1) Wave (2) Wave (3) and Wave (4) and now we've started Wave (5) of Intermediate degree in Blue.
Projections of wave (5)
According to the theory, the projected target for Wave (5) is typically between 123% to 161.8% of the length of Wave (4). So, we can at least assume that the price will reach 123% of Wave (4)’s length, and the price will move higher from here.
Trendline Breakout
The trend line breakout also confirms this. Since Wave (4) moved downwards, Wave (5) should move upwards, indicating a potential upward movement in price. This is a positive signal and a possibility.
Dow Theory confirmation of Trend changed
Additionally, we can see that in the daily time frame, the price has recently completed Wave (4) and formed a higher high, followed by a higher low, and then another higher high, along with a trend line breakout, which we've marked with a rounded ellipse on candle on the chart.
According to Dow theory, this formation of higher highs and higher lows, along with the trend line breakout, indicates that the index has the strength to break through resistance. These two factors strongly support our Elliott Wave projection, which suggests that the price will move upwards. The chart is looking bullish, indicating that a swing has been activated upwards from here.
Exponential Moving Averages
Furthermore, we can see that the price is trading above the 50-day exponential moving average (EMA) in the daily time frame, as well as above the 100-day EMA and the 200-day EMA. These three EMAs are major indicators, and the price is sustaining above all of them. This is also a very good positive sign that supports our view and this scenario.
Supporting Indicators
MACD
RSI
Some Hurdles to cross yet
Finally, we can see that the Zero B trend line, which is coming down from the top, has not been crossed by the price yet, and there has been no breakout. Additionally, we have drawn a trend line connecting the high of the third wave and the low of the fourth wave, which initially acted as resistance and later as support. This trend line is also approaching the same level as the Zero B trend line. So, we have two resistances converging at the same point, which the price has yet to break out of.
This could potentially be a hurdle, and it's possible that according to the Elliott Wave count, Wave (5) will arrive with five sub-divisions, which could lead to a retest of the previous trend line or a Retracement before moving further upwards.
Invalidation Level
According to Elliott Wave theory, the nearest invalidation level is the low of Wave (4), which is currently at 7368, and this level should not be breached. If it is, it will lead to a lower low, which would be an invalidation of the Elliott Wave count.
Overall, the chart of this index looks very promising and bullish. As we all know, the market can be unpredictable, but if this invalidation level is not triggered and the price doesn't break down, then the chart may move upwards with strength. This entire analysis that we discussed is for the Nifty India Defense index chart. Please note that this is not a trading tip or advice, but rather an educational perspective that we shared. Also, keep in mind that the Nifty Defense index is not tradable, but it does provide insight into the market's direction.
This post is shared purely for educational purpose & it’s Not a trading advice.
I am not Sebi registered analyst.
My studies are for educational purpose only.
Please Consult your financial advisor before trading or investing.
I am not responsible for any kinds of your profits and your losses.
Most investors treat trading as a hobby because they have a full-time job doing something else.
However, If you treat trading like a business, it will pay you like a business.
If you treat like a hobby, hobbies don't pay, they cost you...!
Hope this post is helpful to community
Thanks
RK💕
Disclaimer and Risk Warning.
The analysis and discussion provided on in.tradingview.com is intended for educational purposes only and should not be relied upon for trading decisions. RK_Chaarts is not an investment adviser and the information provided here should not be taken as professional investment advice. Before buying or selling any investments, securities, or precious metals, it is recommended that you conduct your own due diligence. RK_Chaarts does not share in your profits and will not take responsibility for any losses you may incur. So Please Consult your financial advisor before trading or investing.
Mazagaon Dock - Consolidation BreakoutMazagon Dock Shipbuilders Ltd. CMP 2700. Attempting a consolidation range breakout. Resistance at all time high levels.
Mazagon Dock Shipbuilders Ltd. - Breakout OpportunityDate : 5-Dec-2024
LTP : Rs. 4,880.70
Targets: (T1) Rs. 5,545 --> (T2) Rs. 5,860 --> (T3) Rs. 7,100
SL : Rs. 4,245
Technical View:
• NSE:MAZDOCK is in primary uptrend and was recently going through it's secondary downtrend within primary uptrend.
• After touching the high of 5,860 on 5-Jul-2024, it has retraced 34% to 3,851.20 level.
• NSE:MAZDOCK has breakout from it's secondary downtrend with higher than average volume on 4-Dec-2024. This breakout is also supported by increased volume in last few sessions.
• NSE:MAZDOCK have formed double bottom pattern between 3,851.20 and 4,925 levels. Breaking 4,925 level will also give breakout from double bottom pattern.
• Company has fixed 27-Dec-2024 as record date for 2/1 stock split. Target levels can be revised post stock split.
• NSE:MAZDOCK is trading above 20 DEMA and 50 DEMA since last few sessions. 20 DEMA has crossed over 50 DEMA on 2-Dec-2024.
• RSI is in buy zone and trading at 71.93. MACD is bullish and trading at 135.74.
• Both RSI and MACD are showing positive divergence.
• Looking good to start a new swing from here.
Liked the analysis? Boost/Like this idea and follow my ID.
Disclaimer: I am not a SEBI registered analyst/consultant and not recommending anyone to take any BUY or SELL position in stock market. Investing in stock market is risky and one should do a self analysis and validation before investing in stock market. My ideas are published for learning purpose only and are available to everyone at no cost/charge.

Mazagon Dock cmp 4594.15 by Daily Chart view*Mazagon Dock cmp 4594.15 by Daily Chart view*
- Support Zone 3840 to 3920 Price Band
- Resistance Zone 4820 to 4960 Price Band
- Price Breakout above Falling Resistance Trendline
- Weekly Support at 4325 > 3920 > 3550 with Resistance at 4960 > 5265 > 5550 > ATH 5860
- *Decent probability maybe anticipated to breach across the Resistance Zone by the way the Volumes are building up over the past few days*

Mazagon Dock Shipbuilders Ltd - Breakout OpportunityDate : 13-Jun-2024
Rating : Buy - Positional Trade
LTP : Rs. 3,389.90
Targets: (1) Rs. 3,478 --> (2) Rs. 4,144 --> (2) Rs. 5,222
SL : Rs. 2,975 on daily close basis
Technical View:
• After breaking out from its 8 month's long sideways trend on 17-May-2024, NSE:MAZDOCK has started moving in primary uptrend. Recently it was going through it's secondary downtrend.
• After touching the high of 3,478 on 30-May-2024, it has retraced 31% to 2,400 level.
• On 13-Jun-2024, NSE:MAZDOCK has broke out from its secondary down trend with high volume.
• Prices are trading above 20 DMA, 50 DMA and 21 DEMA.
• RSI is trading at 64.74 and MACD is trading at 192.33.
• Looking strong from here onwards.
Disclaimer : I am not a SEBI registered analyst/consultant and not recommending anyone to take any BUY or SELL position in stock market. Investing in stock market is risky and one should do a self analysis and validation before investing in stock market. Ideas are published for learning purpose only.

Mazagon Dock Shipbuilders Ltd - Breakout OpportunityDate : 17-May-2024
Rating : Buy - Positional Trade
LTP : Rs. 2,756.65
Targets: Rs. 3,228 ++
SL : Rs. 2,525 on daily close basis
Technical View:
• After touching the high of 2,484.70 on 8-Sep-2023 during it's previous uptrend, NSE:MAZDOCK is moving in sideways since Sep-2023 between 2,525 and 1,742 levels as indicated by dark orange lines in above chart.
• On 17-May-2024, NSE:MAZDOCK has broke out from its 8 month's long sideways trend with very high volume.
• NSE:MAZDOCK is currently trading above 20 DMA, 50 DMA and 21 DEMA.
• RSI is at 72.58 and MACD is at 79.62.
• Both RSI and MACD have given bullish crossover recently and are in support of further upward journey.
Disclaimer : I am not a SEBI registered analyst/consultant and not recommending anyone to take any BUY or SELL position in stock market. Investing in stock market is risky and one should do a self analysis and validation before investing in stock market. Ideas are published for learning purpose only.

Mazagon Dock Shipbuilders Ltd - Breakout OpportunityDate : 23-Apr-2024
Rating : Buy - Positional Trade
LTP : Rs. 2,258.65
Targets: (1) Rs. 2,492 --> (2) Rs. 2,900
SL : Rs. 2,040
Technical View:
• After touching the high of 2,484.70 on 8-Sep-2023 during it's previous uptrend, NSE:MAZDOCK is moving in sideways since Sep-2023 between 2,492 and 1,742 levels as indicated by dark orange lines in above chart.
• On 3-Apr-2024, NSE:MAZDOCK has broke out from its secondary downtrend, indicated by dark red line within the sideways trend. Based on this break out 2,492 can be considered as the 1st target for current swing within the sideways movement.
• If NSE:MAZDOCK will be able to break the higher level of current sideways movement i.e. 2,492, then 2nd target of 2,900 will be very much possible which is Fib. 1.61 level.
• Breaking 2,492 level will actually create double break outs. (1) Break out from current sideways movement and (2) Break out from the double bottom pattern, which is currently in making as indicated by gray lines in above chart.
• RSI is at 61.52 and MACD is at 50.27. Both are in support of further upward journey.
• CAUTION: If NSE:MAZDOCK is not able to break 2,492 level then it will continue in sideways movement targeting 1,742 level. If it fails to break 2,492 level then long positional position should be exited.
Disclaimer : I am not a SEBI registered analyst/consultant and not recommending anyone to take any BUY or SELL position in stock market. Investing in stock market is risky and one should do a self analysis and validation before investing in stock market.

Mazagon Dock Shipbuilders Ltd. - Mid and Long Term OpportunityDate: 16-Dec-2023
Rating: Buy (Mid Term as well as Long Term Opportunity)
LTP: Rs. 2,082.85
Target: (1) Rs. 2,360 --> (2) Rs. 2,484 --> (3) Rs. 2,943++
Outlook: To counter China in Indian Ocean region, India plans to have 160 warships by 2030 and 175 by 2035 at an estimated cost of two trillion rupees. NSE:MAZDOCK is considered one of the beneficiaries.
Disclaimer: I am not a SEBI registered analyst/consultant and not recommending anyone to take any BUY or SELL position in stock market. Investing in stock market is risky and one should do a self analysis and validation before investing in stock market.

Mazagon Dock Looks Extremely StrongMazagon has given a very strong breakout with all defence theme related stocks moving in today's market. Keep a Stop Loss at 910 and continue to hold. This stock completed its correction properly and then moved ahead. Good pick in my opinion.
