Mazdock : A Sleeping Giant Mazgaon Dock broke out of a very strong resistance after forming a base to form new life time high
Post that if you notice
1) volumes dropped
2) Price has fallen
3) There is an obvious invalidation of the breakout which took it to life time high
4) Classic Smart Money Liquidity Sweep
It has posted a healthy set of results in the last quarter and with defense spending ramping up this stock is going to perform extremely well.
It can 2X from here in a reasonably good amount of time.
Watch for a high volume Marubozu on the chart, any time now!
MAZDOCK

MAZDOCK – TECHNICAL ANALYSIS - W PATTERN________________________________________________________________________________
📈 MAZDOCK – TECHNICAL ANALYSIS
📆 Date: July 4, 2025 | ⏱ Timeframe: Daily Chart
🔍 Educational Breakdown – For Learning & Study Use Only
________________________________________________________________________________
🔹 Price Action Zones
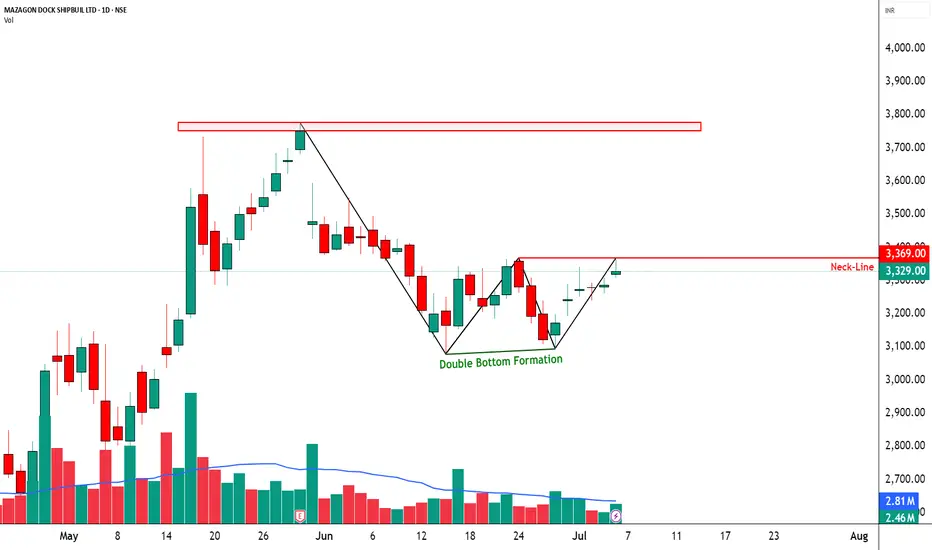
• 🔴 Top Range: 3775
• Resistance: 3362 – 3396 – 3423
• 🟢 Bottom Range: 3077.7
• Support: 3241 – 3274 – 3301
________________________________________________________________________________
🔹 Chart Pattern: ✅ W-Bottom Formation
A clean W-shaped reversal pattern is forming. Price is respecting demand zones and gradually forming higher lows. Neckline lies around 3369 — breakout above this may fuel further upside.
________________________________________________________________________________
🔹 Reversal Candlestick Patterns:
⛔ No major reversal candle on 4th July 2025.
________________________________________________________________________________
🔹 Volume Footprint:
✅ Gradual volume pickup
🚨 Watch for breakout above 3362–3396 with volume >3.5M
🔼 A successful breakout may trigger a swift move toward 3425–3520.
________________________________________________________________________________
🔹 Trend Bias: ✅ Bullish
Short-term momentum favors the bulls with sectoral tailwinds from PSU + Defense themes.
________________________________________________________________________________
📌 What’s Catching Our Eye:
• W-Bottom Pattern nearing breakout
• Price reclaimed key demand zone and consolidating just below resistance
• PSU + Defense theme rally adds sector momentum
________________________________________________________________________________
👀 What We’re Watching For:
• Breakout Confirmation: Daily close above 3396 with 3.5M+ volume
• Pullback Re-entry: Ideal zone 3300–3310 for fresh entries
• Volume Spike: Key trigger for breakout validation
________________________________________________________________________________
⚠️ Risks to Watch:
• Low volume breakout = Bull trap risk
• Sector rotation or sudden weakness in PSU/Defense
• Breakdown below 3240 = pattern failure & shift in bias
________________________________________________________________________________
🔮 What to Expect Next:
• ⚡ Retest of 3362–3396 range likely
• 🔄 Minor consolidation / handle formation possible
• 🔄 Watch for volatility near resistance (intraday fakeouts)
________________________________________________________________________________
📊 Trade Plan (Based on Logic + Volume Confirmation)
🔼 Breakout Long Setup:
• Entry: Above 3369
• Stop Loss: 3300
• Risk–Reward: ~1:1 to 1:2
📌 Why:
• W-bottom breakout
• Sector strength + price structure alignment
• Volume >3.5M is the key trigger
________________________________________________________________________________
🔁 Pullback Long Setup:
• Entry Zone: 3305–3310
• Stop Loss: 3240 (Support 3)
• Risk–Reward: ~1:1 to 1:2
📌 Why:
• Tight SL near structure
• Good risk-reward for early entry
________________________________________________________________________________
🔽 Bearish Setup (Rejection from Resistance):
• Entry: Below 3300
• Stop Loss: Above 3365
• Risk–Reward: ~Flexible — as per individual trader's strategy and risk appetite
📌 Why:
• Rejection from neckline
• Low-volume breakout = trap
• Breakdown below support shifts structure to bearish
________________________________________________________________________________
❌ Invalidation Triggers:
• Daily Close below 3240
• Bearish Marubozu with volume = shift to supply pressure
________________________________________________________________________________
📌 Intraday Supply Zones Noted (15-Min Chart):
The 15-minute chart reveals the presence of multiple intraday supply zones, indicating short-term selling pressure.
🟥 Tested Supply Zone: 3337.30 – 3346.30 | SL: 3352.20
🟥 Strong Supply Zone: 3349.40 – 3358.60 | SL: 3364.50
These zones may act as resistance levels for intraday traders. Watch for price rejection or confirmation candles in these areas before planning any breakout trades.
________________________________________________________________________________
⚠️ Disclaimer:
This analysis is for educational purposes only.
STWP is not a SEBI-registered advisor.
No buy/sell recommendations are made.
Please consult your financial advisor before trading.
STWP is not responsible for trading decisions based on this post.
________________________________________________________________________________
💬 Found this helpful?
Have you caught this W-pattern early?
Share your thoughts in the comments ⬇️
🔁 Spread the insight with fellow traders
✅ Follow STWP for smart technical setups backed by volume and price action
🚀 Let’s trade with patience, logic, and clarity!
Be Self-Reliant | Trade with Patience | Learn with Logic
________________________________________________________________________________
MAZDOCK - – INTRADAY ZONE ANALYSIS________________________________________________________________________________📈 MAZAGON DOCK SHIPBUILDERS LTD. – INTRADAY ZONE ANALYSIS
📆 Date: July 1, 2025 | ⏱ Timeframe: 15-Minute Chart
🔍 Educational Breakdown – For Learning & Study Use Only
________________________________________________________________________________
🔹 Price Action Zones
🔴 Top Range (Resistance): ₹3341
🟢 Bottom Range (Support): ₹3094
⚪ No Trade Zone: (Trade only with trend + confirmation in this zone)
________________________________________________________________________________
🧩 Chart Pattern: No visible chart pattern seen.
________________________________________________________________________________
🔁 Reversal Candlestick Patterns:
🔴 Top Range:
✅ Multiple strong rejection candles near ₹3341 along with long upper wicks and volume drop — suggesting supply zone holding.
🟢 Bottom Range:
✅ Bullish Marubozu and wide-range green candles seen around ₹3094, confirming strong buyer interest and a potential reversal zone.
________________________________________________________________________________
🧠 1. Trade Plan (Based on Reason and Logic)
🔼 Bullish Trade:
Idea: Go long if price retests ₹3120–₹3094 demand zone with bullish confirmation (strong bullish candle, reversal candles, volume support, long wick)
Stop Loss: Below ₹3090
Risk-Reward: 1:1 | 1:2+
Logic: Strong buyer reaction from demand zone previously suggests continued interest if tested again.
________________________________________________________________________________
🔽 Bearish Trade:
Idea: Short if price retests ₹3341–₹3310 and rejects with bearish candle formation (strong bearish candle, reversal candles, volume support, long wick).
Stop Loss: Above ₹3347.55
Risk-Reward: 1:1 | 1:2+
Logic: Supply zone confirmed with rejections earlier. Reversal here can lead to downside till mid or demand zone.
________________________________________________________________________________
📦 2. Trade Plan Based on Demand/Supply Zones
🟥 Supply Zone: ₹3341 – ₹3310
SL: ₹3347.55
Plan: Enter short if price shows rejection with bearish confirmation at this zone.
Risk-Reward: 1:1 | 1:2+
🟩 Demand Zone: ₹3120 – ₹3094
SL: ₹3090
Plan: Enter long on bullish reversal setup from this demand area.
Risk-Reward: 1:1 | 1:2+
________________________________________________________________________________
📌 Disclaimer
This analysis is for educational and study purposes only. It does not constitute investment advice. The author is not SEBI-registered. Please consult a SEBI-registered advisor before trading. Always use strict risk management and act only on confirmation.
________________________________________________________________________________
💬 Comments
What’s your view on MAZDOCK?
Will it break the supply zone and rally higher, or revisit the demand zone before bouncing back?
Share your thoughts and chart setups below 👇
________________________________________________________________________________

Mazagon Dock Shipbuilders - Breakout Setup, Move is ON...#MAZDOCK trading above Resistance of 4315
Next Resistance is at 6033
Support is at 2955
Here are previous charts:
Chart is self explanatory. Levels of breakout, possible up-moves (where stock may find resistances) and support (close below which, setup will be invalidated) are clearly defined.
Disclaimer: This is for demonstration and educational purpose only. This is not buying or selling recommendations. I am not SEBI registered. Please consult your financial advisor before taking any trade.

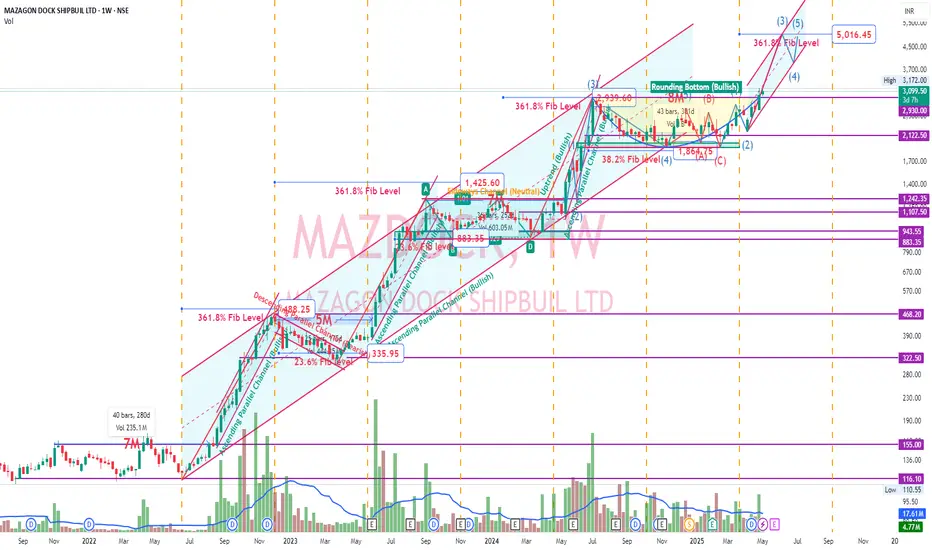
Mazdock - Undocked after 8M Rounding BottomMazdock renowned shipbuilding company has constructed 801 vessels since 1960, including warships, submarines, cargo/passenger ships, and offshore platforms.
Order Book
As of Q2 FY25, the company’s total order book was Rs. 39,872 Cr, which includes 37 vessels scheduled for delivery.
Order Book Mix:
Shipbuilding: 70%
Submarine and Heavy Engineering: 30%
Fundamentals
Company has excellent fundamentals with ROE and ROCE above 20% and increasing. Negative working capital, Debt free, increasing sales and profit with dividend payout of around 29%. Stellar Operating profit margin and rising along with increase in stakes of both DII and FII in recent quarter.
Technicals
On observing the chart, We could witness stock roaring 100% atleast after every consolidation of around 5-8 months. History tend to repeat itself. Fundamentals are good. Overall aerospace and defense sector are in good position. Check that custom index chart which was published. Mazdock has the potential to reach 5K which is 361.8% Fib level. In past, it has always reached that fib level. Pivot R3 is also around 5278.45. We can also see that breakout of rounding bottom pattern has occurred.
Disclaimer: Learning Purpose
Mazagon Dock Shipbuilders Ltd - MAZDOCK - CnH Daily BOHere’s the **technical analysis** for **Mazagon Dock Shipbuilders Ltd. (MAZDOCK)** based on your shared chart:
---
### 🚢 **Mazagon Dock (NSE) Technical Analysis**
1. **Pattern Observed:**
- **Cup and Handle** pattern nicely formed.
- **Breakout Level** being tested around ₹2750–2785.
2. **Key Levels:**
- **Breakout Level:** ~₹2750.
- **Current Price:** ~₹2786.
- **Resistance Levels:**
- Immediate: ₹2930 (recent high).
- Major Target: **₹3566** (as per measured move projection).
- **Support Levels:**
- ₹2750 (recent breakout area).
- ₹2500 (strong base in case of pullback).
3. **Volume Confirmation:**
- Good rise in volume during breakout attempt — a very strong bullish indicator.
4. **Target Projection:**
- Cup Depth ≈ ₹825.
- Target = Breakout Zone + Cup Depth
- ₹2750 + ₹825 ≈ **₹3566** (exactly matching your chart projection).
5. **Trend Strength:**
- Long-term higher high and higher low structure visible.
- Bullish bias very strong above ₹2750.
---
### 📈 **Summary**
| Aspect | Detail |
|:------|:-------|
| Pattern | Cup and Handle |
| Breakout Level | ₹2750 |
| Immediate Target | ₹2930 |
| Major Target | ₹3566 |
| Support | ₹2750, ₹2500 |
| Bias | **Strong Bullish** |
---
### 📋 **Trading Idea (Example Setup)**
- **Entry:** ₹2785–2800 after confirmation and stability.
- **Stop Loss:** ₹2600 (safer below previous structure).
- **Target 1:** ₹2930.
- **Target 2:** ₹3566.
---
### 🧠 Important Observations:
- If price struggles around ₹2930 and rejects, it could retest ₹2750 before moving higher — so don't panic if a small pullback happens.
- RSI, MACD momentum check would be ideal to ensure strength (optional).
---
**Summary:**
✅ **Mazagon Dock** is looking **extremely strong** technically, with **good breakout** happening.
✅ Above ₹2750–2785, it could quickly move toward ₹2930 and later ₹3566 with strength! 🚀
---
Would you like me to also **rank all 4 stocks (ICICI Bank, BEL, HAL, Mazagon Dock)** based on their **chart strength, pattern quality, and risk/reward** so you can clearly decide the best opportunities? 📊
(Will prepare a simple and clear table if you want!) ✅

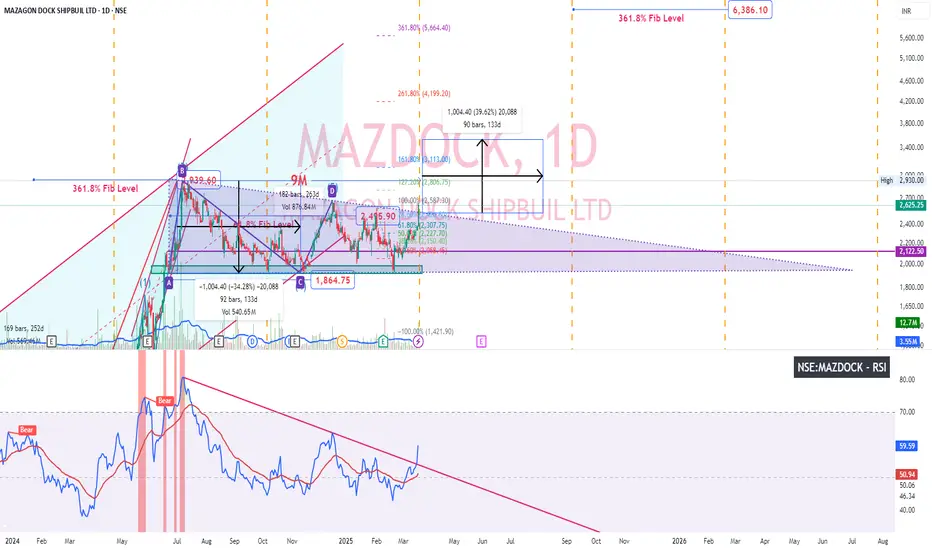
Mazdock - Price, RSI breakout - D timeframeMazdock after good Q3 descending triangle breakout. Usually descending triangle is bearish pattern. Let's see if the target 3539.40 gets reached (height of the triangle)
MAZDOCK - Ready for the next moveThe stock has been a market favorite. Technically it has cooled down owing to the Wave analysis which every stock goes through. Overall the Stock is in Stage 2. The stock is now gearing up to give Range Breakout.
On the Fundamental side:
- Strong Long Term Fundamental Strength with an average Return on Equity (ROE) of 24.14%
- Healthy long term growth as Net Sales has grown by an annual rate of 24.97% and Operating profit at 94.40%
- Company has a low Debt to Equity ratio (avg) at 0 times
- The company has declared Positive results for the last 8 consecutive quarters
- NET SALES(9M) At Rs 8,217.50 cr has Grown at 35.18 %
- ROCE(HY) Highest at 44.63 %
- INVENTORY TURNOVER RATIO(HY) Highest at 2.19 times
- Increasing Participation by Institutional Investors. Institutional investors have increased their stake by 0.56% over the previous quarter and collectively hold 3.02% of the company.

Amazing swing trading idea for tomorrow I make educational content videos for swing / positional trading

Flag Breakout: Mazgaon Dock Above 4500, Targeting 6000Details:
Asset: Mazgaon Dock Shipbuilders Limited (MAZDOCK)
Breakout Level: 4500
Potential Target: 6000
Stop Loss: Below 4500 or as per risk tolerance
Timeframe: Short to medium-term
Rationale: Mazgaon Dock has been consolidating in a channel since July 2024, and it has now broken out above the 4500 level. This flag breakout pattern suggests that the stock could see a strong upward move, potentially reaching 6000 in the coming weeks.
Market Analysis:
Technical Breakout: The stock has broken through the key resistance level of 4500, signaling the end of its consolidation phase and the start of a new bullish trend.
Consolidation Phase: The consolidation from July 2024 built strong technical support, and the breakout now opens up the potential for a sharp rally.
Price Target:
The initial target is set at 6000, based on the flag breakout pattern and historical price movements.
Risk Management:
A stop loss below 4500 is recommended to manage downside risk in case the breakout fails or the stock pulls back temporarily.
Timeframe:
The move toward 6000 is anticipated over the short to medium-term, depending on market sentiment and the strength of the breakout.
Risk-Reward Ratio: The setup offers a favorable risk-reward ratio, with significant upside potential to 6000 and a clear stop loss level near the breakout point.
This breakout presents a strong opportunity, but always ensure to assess risk, market conditions, and your own portfolio strategy before making decisions.

MAZDOCK Looks BullishMazdock has given a breakout from it's trendline. It is ready to reach it's All Time High Again.
Note: This analysis is for educational purpose only.
NSE:MAZDOCK NSE:MAZDOCK

MAZDOCK BULLISH WAVE5 FormingMAZDOCK BULLISH
After long correction upto 0.5 from 3rd wave top, formed 4
5th wave started, long way to go.
ELLIOTT WAVE THEORY Rocks 😎

Grse & Mazdock: Hidden Channels Unveiled! CT Breakouts ahead ? In this video, we dive deep into the strikingly similar price structures of GRSE and Mazdock. Both stocks are navigating a hidden parallel channel, with a recent breakout of a key counter trendline. GRSE is showing trendline support, despite making slightly lower lows, while volumes across both stocks suggest potential for bigger moves. Watch closely as we map out potential pathways for future price action setups. Keep these stocks on your radar and let's revisit after the breakout!

MazdockMazdock is a very importent indian defence companie and groth year on year
so my veiw bullish and big move upside expect some weak
entry level -3270
sl- 3100
target- 3970 to 5000
only study perpus not recommended take tred
so time to time track and learn chart pattern

Mazagon Dock Shipbuilders Ltd - Breakout OpportunityDate : 13-Jun-2024
Rating : Buy - Positional Trade
LTP : Rs. 3,389.90
Targets: (1) Rs. 3,478 --> (2) Rs. 4,144 --> (2) Rs. 5,222
SL : Rs. 2,975 on daily close basis
Technical View:
• After breaking out from its 8 month's long sideways trend on 17-May-2024, NSE:MAZDOCK has started moving in primary uptrend. Recently it was going through it's secondary downtrend.
• After touching the high of 3,478 on 30-May-2024, it has retraced 31% to 2,400 level.
• On 13-Jun-2024, NSE:MAZDOCK has broke out from its secondary down trend with high volume.
• Prices are trading above 20 DMA, 50 DMA and 21 DEMA.
• RSI is trading at 64.74 and MACD is trading at 192.33.
• Looking strong from here onwards.
Disclaimer : I am not a SEBI registered analyst/consultant and not recommending anyone to take any BUY or SELL position in stock market. Investing in stock market is risky and one should do a self analysis and validation before investing in stock market. Ideas are published for learning purpose only.

Mazagon Dock Shipbuilders - Breakout Setup, Move is ON...#MAZDOCK trading above Resistance of 3619
Next Resistance is at 4315
Support is at 2492
Here are previous charts:
Chart is self explanatory. Levels of breakout, possible up-moves (where stock may find resistances) and support (close below which, setup will be invalidated) are clearly defined.
Disclaimer: This is for demonstration and educational purpose only. This is not buying or selling recommendations. I am not SEBI registered. Please consult your financial advisor before taking any trade.

Mazdock breakoutMazdock followed by stellar results agrees to make electric tugs. daily chart showing breakout. Volumes rising in 15m chart. Fundamentally strong stock.
Disclaimer: Holding

Mazagon Dock Shipbuilders - Breakout Setup, Move is ON...#MAZDOCK trading above Resistance of 2955
Next Resistance is at 3619
Support is at 1986
Here are previous charts:
Chart is self explanatory. Levels of breakout, possible up-moves (where stock may find resistances) and support (close below which, setup will be invalidated) are clearly defined.
Disclaimer: This is for demonstration and educational purpose only. This is not buying or selling recommendations. I am not SEBI registered. Please consult your financial advisor before taking any trade.

Paras, another stock want to dance, setting up well-Long base BO then
Elections results create volatility but
Setting up again:
-Recovered fast with volumes then red candle on low vol n bounced from 10 ema
-Defence stocks are making good setups
-Good shakeout of 21 ema
-tightness

Mazdock, setting up again with other defence stocks. -Posted great results. Whole defence sector strong.
-Breakout from long base.
-After 4th July (Election result day) volatility bloodbath, recovered fast n filled that big red candle.
-Tightness
- Lots of white dots (5% move with 1M volume) suggests big institutions are behind the stocks, retailers cant create that much volume.
-Downtrendline tested 3 times.

Mazagon Dock Shipbuilders - Long Setup, Move is ON...#MAZDOCK trading above Resistance of 1986
Next Resistance is at 2955
Support is at 1530
Here are previous charts:
Chart is self explanatory. Entry, Resistances and Support are mentioned on the chart.
Disclaimer: This is for demonstration and educational purpose only. This is not buying or selling recommendations. I am not SEBI registered. Please consult your financial advisor before taking any trade.

Weekly Chart of MAZDOCK, Ready for breakout.Mazagon Dock Shipbuilders Ltd. is an Indian shipyard located in Mumbai, Maharashtra. The company is a public sector undertaking of the Ministry of Defence (India). Mazagon Dock builds a variety of ships, including warships, submarines, and merchant ships.
The company's stock price has been on an upward trend in recent months, due to a number of factors, including increased government spending on defense, and a growing demand for Indian-built ships. However, the stock price is also volatile, and it is important to do your own research before investing in any stock.

Mazagon Dock Shipbuilders Ltd - Breakout OpportunityDate : 23-Apr-2024
Rating : Buy - Positional Trade
LTP : Rs. 2,258.65
Targets: (1) Rs. 2,492 --> (2) Rs. 2,900
SL : Rs. 2,040
Technical View:
• After touching the high of 2,484.70 on 8-Sep-2023 during it's previous uptrend, NSE:MAZDOCK is moving in sideways since Sep-2023 between 2,492 and 1,742 levels as indicated by dark orange lines in above chart.
• On 3-Apr-2024, NSE:MAZDOCK has broke out from its secondary downtrend, indicated by dark red line within the sideways trend. Based on this break out 2,492 can be considered as the 1st target for current swing within the sideways movement.
• If NSE:MAZDOCK will be able to break the higher level of current sideways movement i.e. 2,492, then 2nd target of 2,900 will be very much possible which is Fib. 1.61 level.
• Breaking 2,492 level will actually create double break outs. (1) Break out from current sideways movement and (2) Break out from the double bottom pattern, which is currently in making as indicated by gray lines in above chart.
• RSI is at 61.52 and MACD is at 50.27. Both are in support of further upward journey.
• CAUTION: If NSE:MAZDOCK is not able to break 2,492 level then it will continue in sideways movement targeting 1,742 level. If it fails to break 2,492 level then long positional position should be exited.
Disclaimer : I am not a SEBI registered analyst/consultant and not recommending anyone to take any BUY or SELL position in stock market. Investing in stock market is risky and one should do a self analysis and validation before investing in stock market.
