Mazdock Long - Technical AnalysisMAZDOCK Technical Analysis Summary
Current Price : 2,985.00
Technical Reasons to Pick MAZDOCK
1 - Dow Theory Confirmation
- Higher Highs (HH) - Higher Lows (HL)
- Clear uptrend structure maintained
2 - EMA Support Structure - Took support from 100 EMA on a weekly Timeframe
- Trading above sorted EMA 100/200
- Strong momentum indication
- Bullish reversal from key moving average
4 - A clear Hidden RSI Divergence
- Indicates continuation of uptrend
- Target 1 : 3,240.00
- Target 2 : 3,502.30
- Target 3 : 3,774.00
- Grand Target : 4,094.00
Risk Management
Watch for sustained break below 100 EMA for trend reversal
Overall Bias : BULLISH
Strategy : Buy on dips near EMA support levels.
Mazdockanalysis

MAZDOCK – TECHNICAL ANALYSIS - W PATTERN________________________________________________________________________________
📈 MAZDOCK – TECHNICAL ANALYSIS
📆 Date: July 4, 2025 | ⏱ Timeframe: Daily Chart
🔍 Educational Breakdown – For Learning & Study Use Only
________________________________________________________________________________
🔹 Price Action Zones
• 🔴 Top Range: 3775
• Resistance: 3362 – 3396 – 3423
• 🟢 Bottom Range: 3077.7
• Support: 3241 – 3274 – 3301
________________________________________________________________________________
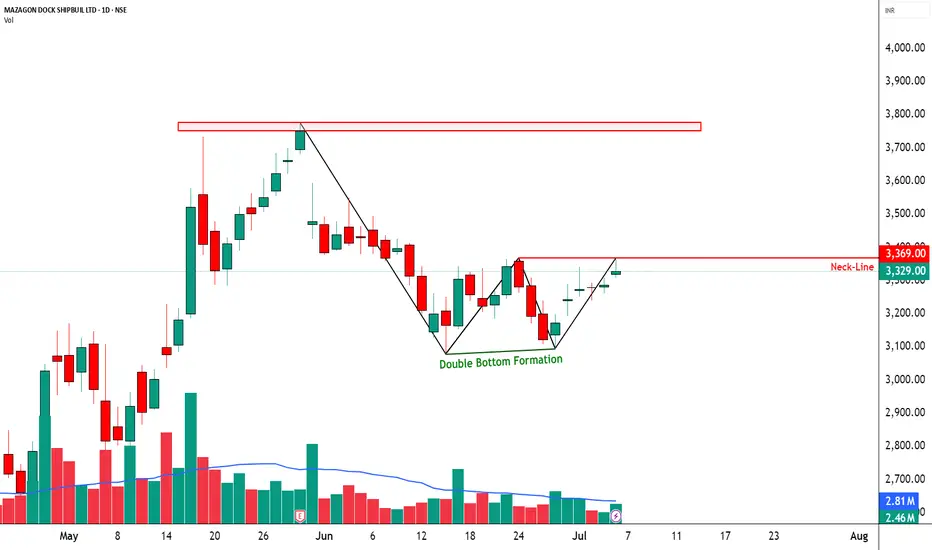
🔹 Chart Pattern: ✅ W-Bottom Formation
A clean W-shaped reversal pattern is forming. Price is respecting demand zones and gradually forming higher lows. Neckline lies around 3369 — breakout above this may fuel further upside.
________________________________________________________________________________
🔹 Reversal Candlestick Patterns:
⛔ No major reversal candle on 4th July 2025.
________________________________________________________________________________
🔹 Volume Footprint:
✅ Gradual volume pickup
🚨 Watch for breakout above 3362–3396 with volume >3.5M
🔼 A successful breakout may trigger a swift move toward 3425–3520.
________________________________________________________________________________
🔹 Trend Bias: ✅ Bullish
Short-term momentum favors the bulls with sectoral tailwinds from PSU + Defense themes.
________________________________________________________________________________
📌 What’s Catching Our Eye:
• W-Bottom Pattern nearing breakout
• Price reclaimed key demand zone and consolidating just below resistance
• PSU + Defense theme rally adds sector momentum
________________________________________________________________________________
👀 What We’re Watching For:
• Breakout Confirmation: Daily close above 3396 with 3.5M+ volume
• Pullback Re-entry: Ideal zone 3300–3310 for fresh entries
• Volume Spike: Key trigger for breakout validation
________________________________________________________________________________
⚠️ Risks to Watch:
• Low volume breakout = Bull trap risk
• Sector rotation or sudden weakness in PSU/Defense
• Breakdown below 3240 = pattern failure & shift in bias
________________________________________________________________________________
🔮 What to Expect Next:
• ⚡ Retest of 3362–3396 range likely
• 🔄 Minor consolidation / handle formation possible
• 🔄 Watch for volatility near resistance (intraday fakeouts)
________________________________________________________________________________
📊 Trade Plan (Based on Logic + Volume Confirmation)
🔼 Breakout Long Setup:
• Entry: Above 3369
• Stop Loss: 3300
• Risk–Reward: ~1:1 to 1:2
📌 Why:
• W-bottom breakout
• Sector strength + price structure alignment
• Volume >3.5M is the key trigger
________________________________________________________________________________
🔁 Pullback Long Setup:
• Entry Zone: 3305–3310
• Stop Loss: 3240 (Support 3)
• Risk–Reward: ~1:1 to 1:2
📌 Why:
• Tight SL near structure
• Good risk-reward for early entry
________________________________________________________________________________
🔽 Bearish Setup (Rejection from Resistance):
• Entry: Below 3300
• Stop Loss: Above 3365
• Risk–Reward: ~Flexible — as per individual trader's strategy and risk appetite
📌 Why:
• Rejection from neckline
• Low-volume breakout = trap
• Breakdown below support shifts structure to bearish
________________________________________________________________________________
❌ Invalidation Triggers:
• Daily Close below 3240
• Bearish Marubozu with volume = shift to supply pressure
________________________________________________________________________________
📌 Intraday Supply Zones Noted (15-Min Chart):
The 15-minute chart reveals the presence of multiple intraday supply zones, indicating short-term selling pressure.
🟥 Tested Supply Zone: 3337.30 – 3346.30 | SL: 3352.20
🟥 Strong Supply Zone: 3349.40 – 3358.60 | SL: 3364.50
These zones may act as resistance levels for intraday traders. Watch for price rejection or confirmation candles in these areas before planning any breakout trades.
________________________________________________________________________________
⚠️ Disclaimer:
This analysis is for educational purposes only.
STWP is not a SEBI-registered advisor.
No buy/sell recommendations are made.
Please consult your financial advisor before trading.
STWP is not responsible for trading decisions based on this post.
________________________________________________________________________________
💬 Found this helpful?
Have you caught this W-pattern early?
Share your thoughts in the comments ⬇️
🔁 Spread the insight with fellow traders
✅ Follow STWP for smart technical setups backed by volume and price action
🚀 Let’s trade with patience, logic, and clarity!
Be Self-Reliant | Trade with Patience | Learn with Logic
________________________________________________________________________________
MAZDOCK - – INTRADAY ZONE ANALYSIS________________________________________________________________________________📈 MAZAGON DOCK SHIPBUILDERS LTD. – INTRADAY ZONE ANALYSIS
📆 Date: July 1, 2025 | ⏱ Timeframe: 15-Minute Chart
🔍 Educational Breakdown – For Learning & Study Use Only
________________________________________________________________________________
🔹 Price Action Zones
🔴 Top Range (Resistance): ₹3341
🟢 Bottom Range (Support): ₹3094
⚪ No Trade Zone: (Trade only with trend + confirmation in this zone)
________________________________________________________________________________
🧩 Chart Pattern: No visible chart pattern seen.
________________________________________________________________________________
🔁 Reversal Candlestick Patterns:
🔴 Top Range:
✅ Multiple strong rejection candles near ₹3341 along with long upper wicks and volume drop — suggesting supply zone holding.
🟢 Bottom Range:
✅ Bullish Marubozu and wide-range green candles seen around ₹3094, confirming strong buyer interest and a potential reversal zone.
________________________________________________________________________________
🧠 1. Trade Plan (Based on Reason and Logic)
🔼 Bullish Trade:
Idea: Go long if price retests ₹3120–₹3094 demand zone with bullish confirmation (strong bullish candle, reversal candles, volume support, long wick)
Stop Loss: Below ₹3090
Risk-Reward: 1:1 | 1:2+
Logic: Strong buyer reaction from demand zone previously suggests continued interest if tested again.
________________________________________________________________________________
🔽 Bearish Trade:
Idea: Short if price retests ₹3341–₹3310 and rejects with bearish candle formation (strong bearish candle, reversal candles, volume support, long wick).
Stop Loss: Above ₹3347.55
Risk-Reward: 1:1 | 1:2+
Logic: Supply zone confirmed with rejections earlier. Reversal here can lead to downside till mid or demand zone.
________________________________________________________________________________
📦 2. Trade Plan Based on Demand/Supply Zones
🟥 Supply Zone: ₹3341 – ₹3310
SL: ₹3347.55
Plan: Enter short if price shows rejection with bearish confirmation at this zone.
Risk-Reward: 1:1 | 1:2+
🟩 Demand Zone: ₹3120 – ₹3094
SL: ₹3090
Plan: Enter long on bullish reversal setup from this demand area.
Risk-Reward: 1:1 | 1:2+
________________________________________________________________________________
📌 Disclaimer
This analysis is for educational and study purposes only. It does not constitute investment advice. The author is not SEBI-registered. Please consult a SEBI-registered advisor before trading. Always use strict risk management and act only on confirmation.
________________________________________________________________________________
💬 Comments
What’s your view on MAZDOCK?
Will it break the supply zone and rally higher, or revisit the demand zone before bouncing back?
Share your thoughts and chart setups below 👇
________________________________________________________________________________
