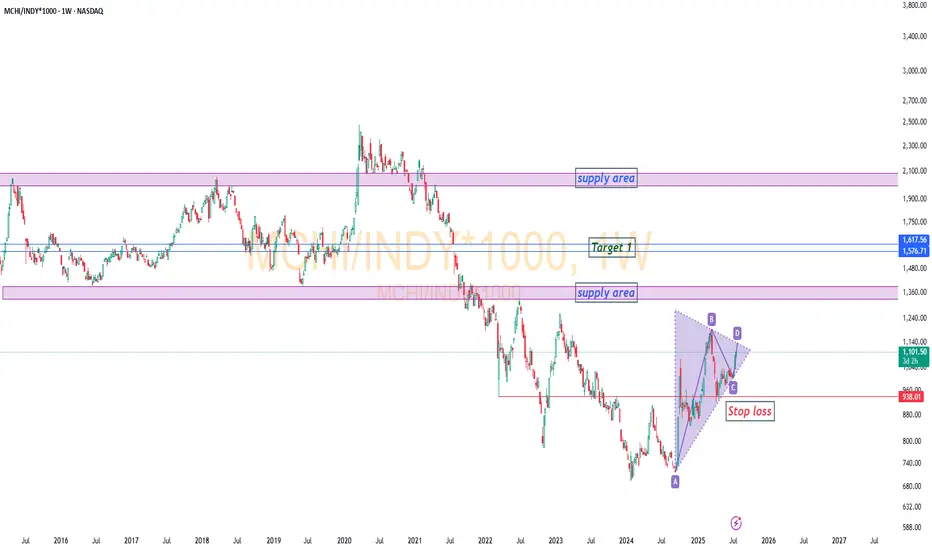
MCHI / IndyRelative Comparison Analysis: MCHI vs. INDY (CMP: 1084)
On the weekly chart, MCHI appears poised to outperform INDY if it sustains above the 1130–1230 zone. The 1330–1390 region may act as an initial supply zone.
Target 1: 1582–1617
(Estimated timeline: ~1 year or more)
Target 2 / Next Supply Zone: 2000–2080
A breakout above the supply zone (1330–1390) could materialize within the next 8 months if momentum builds.
Suggested Stop Loss: 940 (on a weekly closing basis)
This analysis is based on relative strength trends and supply-demand dynamics visible on the long-term chart.